
 Join our Discord
Use test execution reports in Test Management
Create, view, filter, export, and share test execution reports to track coverage, stability, flakiness, and failures across builds and projects.
A test execution report aggregates test executions across the builds, projects, tags, or metadata you select. This report shows how the status of each unique test is aggregated across every build in scope.
In test execution reports, status displays the latest test execution state. So, a test that failed in an earlier build but passed on its most recent run shows as Passed.
This platform feature is available with Automate, App Automate, Test Management, Test Reporting & Analytics, and Automate TurboScale.
When to use a test execution report
Use a test execution report to answer one question: whether your suite is ready to release. It lists every unique test in scope and its consolidated status across all the builds and projects you include. This report shows a single, deduplicated pass or fail picture of your test suite, so that you don’t have to check builds one by one.
Common uses:
- Release readiness, go or no-go: Confirm every unique test is green using the Summary, New failures, and Always failing tiles before shipping.
- Stability and flakiness tracking: Monitor results over a chosen time window.
- Cross-project coverage audit: See what’s covered across projects in one view.
- Proof-of-coverage snapshot: Share a deduplicated picture of your suite for sign-off or compliance.
Reports is a paid capability. You can create a report as private, visible only to you, or public, visible to everyone in your organization.
What a test execution report includes
Each test execution report offers:
-
Data sources: Select a data source type:
- Static: Select specific build runs.
-
Dynamic: Define criteria using filters. Time frame and Projects are mandatory. Add any of the following optional filters to narrow the data source further:
- Users
- Unique build names
- Build tags
- Test tags
- Hooks visibility
- Host names
- Folder names
- CI runs only
- Branch
- Device
- OS
- Browser
- Stat tiles: High-value metrics such as summary counts, flaky tests, new failures, always failing, and open issues.
- Tabular view: Customizable columns such as test name, status, browser and OS, project name, build name, path, failure rate, last 10 runs, and smart tags. The Last 10 runs column shows only the tests that satisfy your filter criteria, which might result in counts less than 10.
- Drilldown: Click a test row to open test health or the debugger, or click a stat tile to apply a filter such as New Failures.
Stat tiles
Each stat tile surfaces a different signal about the tests in scope:
| Stat tile | What it means | How to read it |
|---|---|---|
| Summary | Passed, Failed, Skipped, and Other counts across every unique test in scope. | A release-readiness number. |
| Flaky tests | Tests that pass on a retry or flip status across recent runs. | Investigate before you trust their results in a release decision. |
| New failures | Tests failing with an error not seen in recent runs. | A new regression, triage before release. |
| Always failing | Tests continuously failing with the same error across recent runs. | Chronically broken, quarantine or fix before gating. |
| Open issues | Tests already linked to a bug or ticket in your issue tracker. | Already tracked, confirm the fix ships instead of re-triaging. |
The stat tiles Flaky Tests, New Failures, and Always Failing include only automation runs.
How to create a test execution report
To create a test execution report:
-
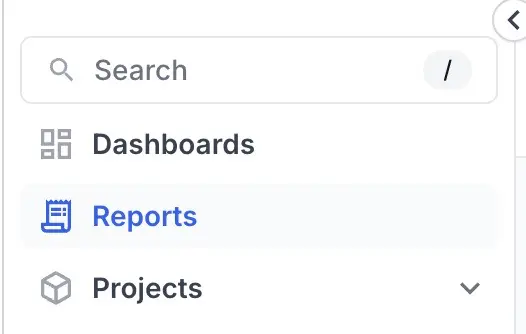
Open Reports from the sidebar.
- Select Create Report.
-
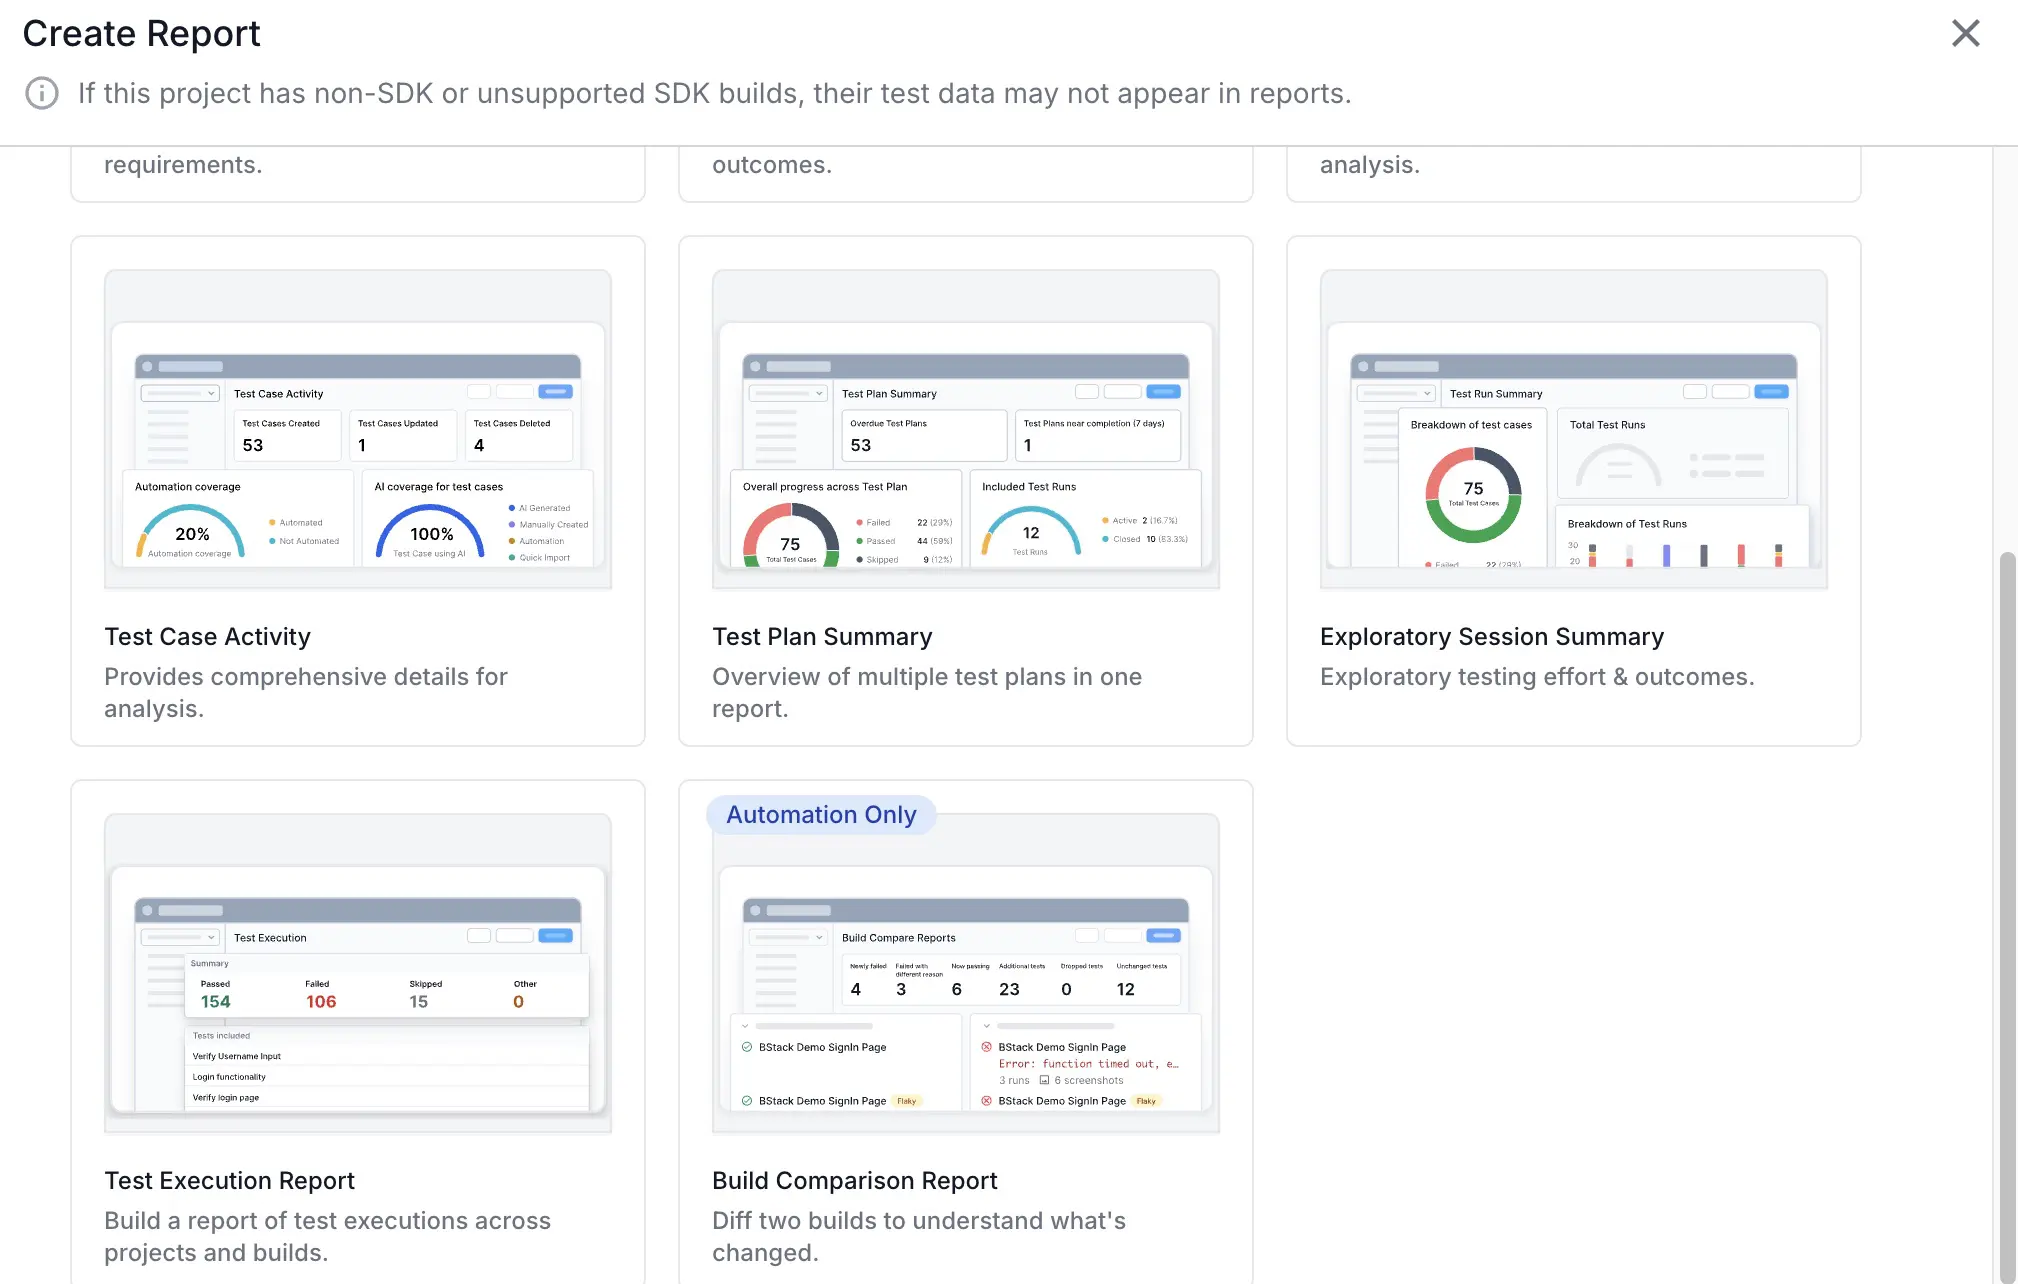
Select Test Execution Report as the report type.
- Add a data source:
- Click Add Data.
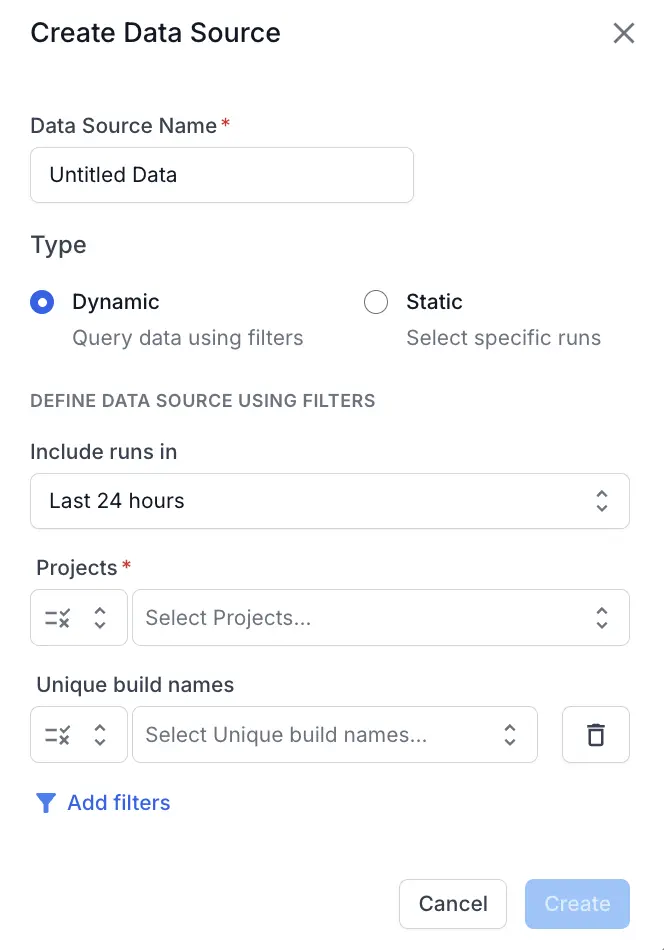
- Enter a name for the data source.
- Select a data source type: Dynamic to query data using filters, or Static to select specific runs.
- For a dynamic data source, select a time frame and one or more projects, then click Add filters to narrow the data source further with build tags, test tags, branch, device, OS, browser, and more.
- For a static data source, select a project and date range, then select the specific builds you want to include.
- Click Create. Repeat to add more data sources.
- Click Save and finish.
- Enter a name for the report.
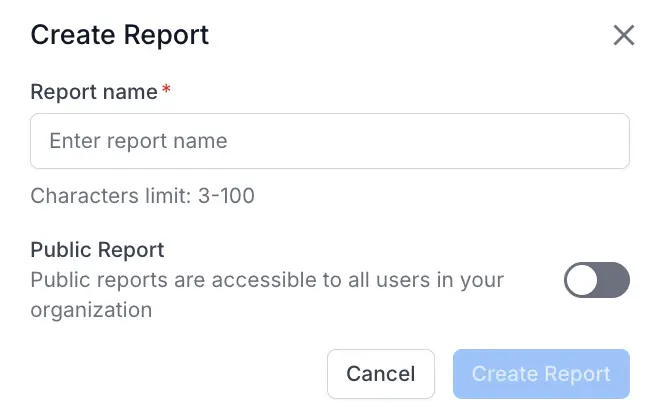
- Switch on Public Report if you want to share it within your organization.
- Click Create Report.
How to view a test execution report
To view a test execution report:
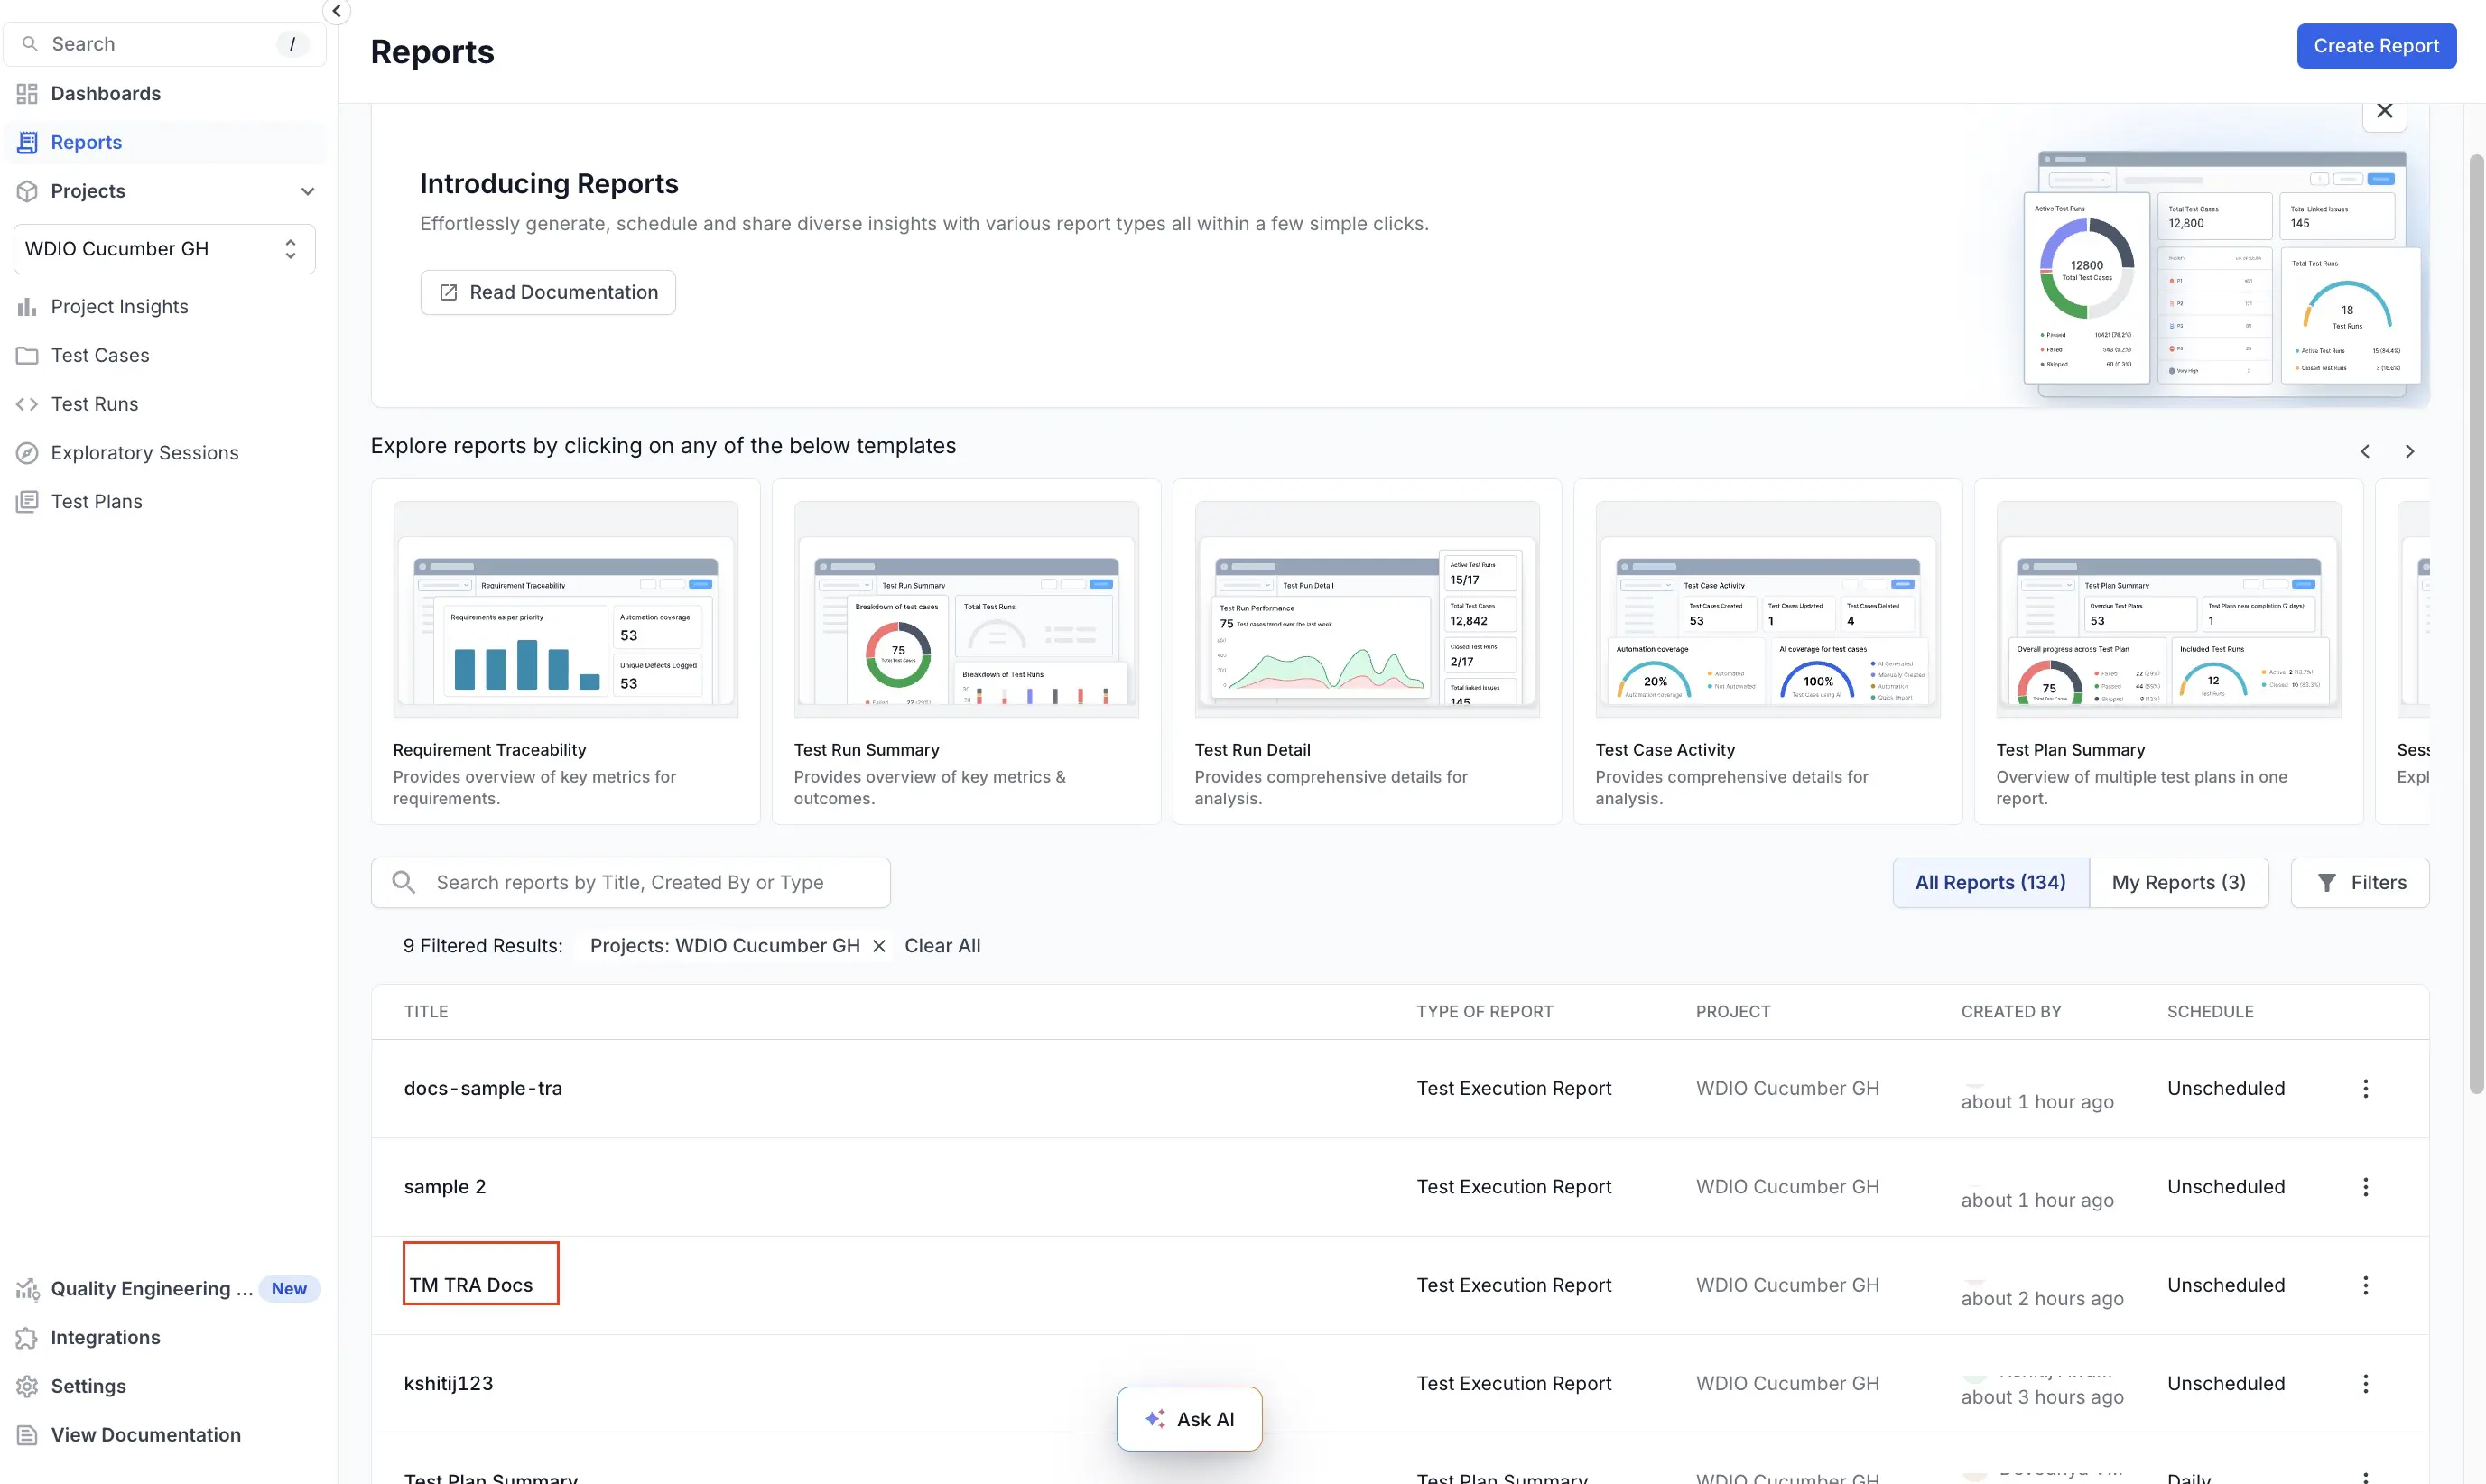
- Open Reports from the sidebar.
-
From the list of available reports, select the test execution report you want to view. The list contains a column to denote the type of the report.
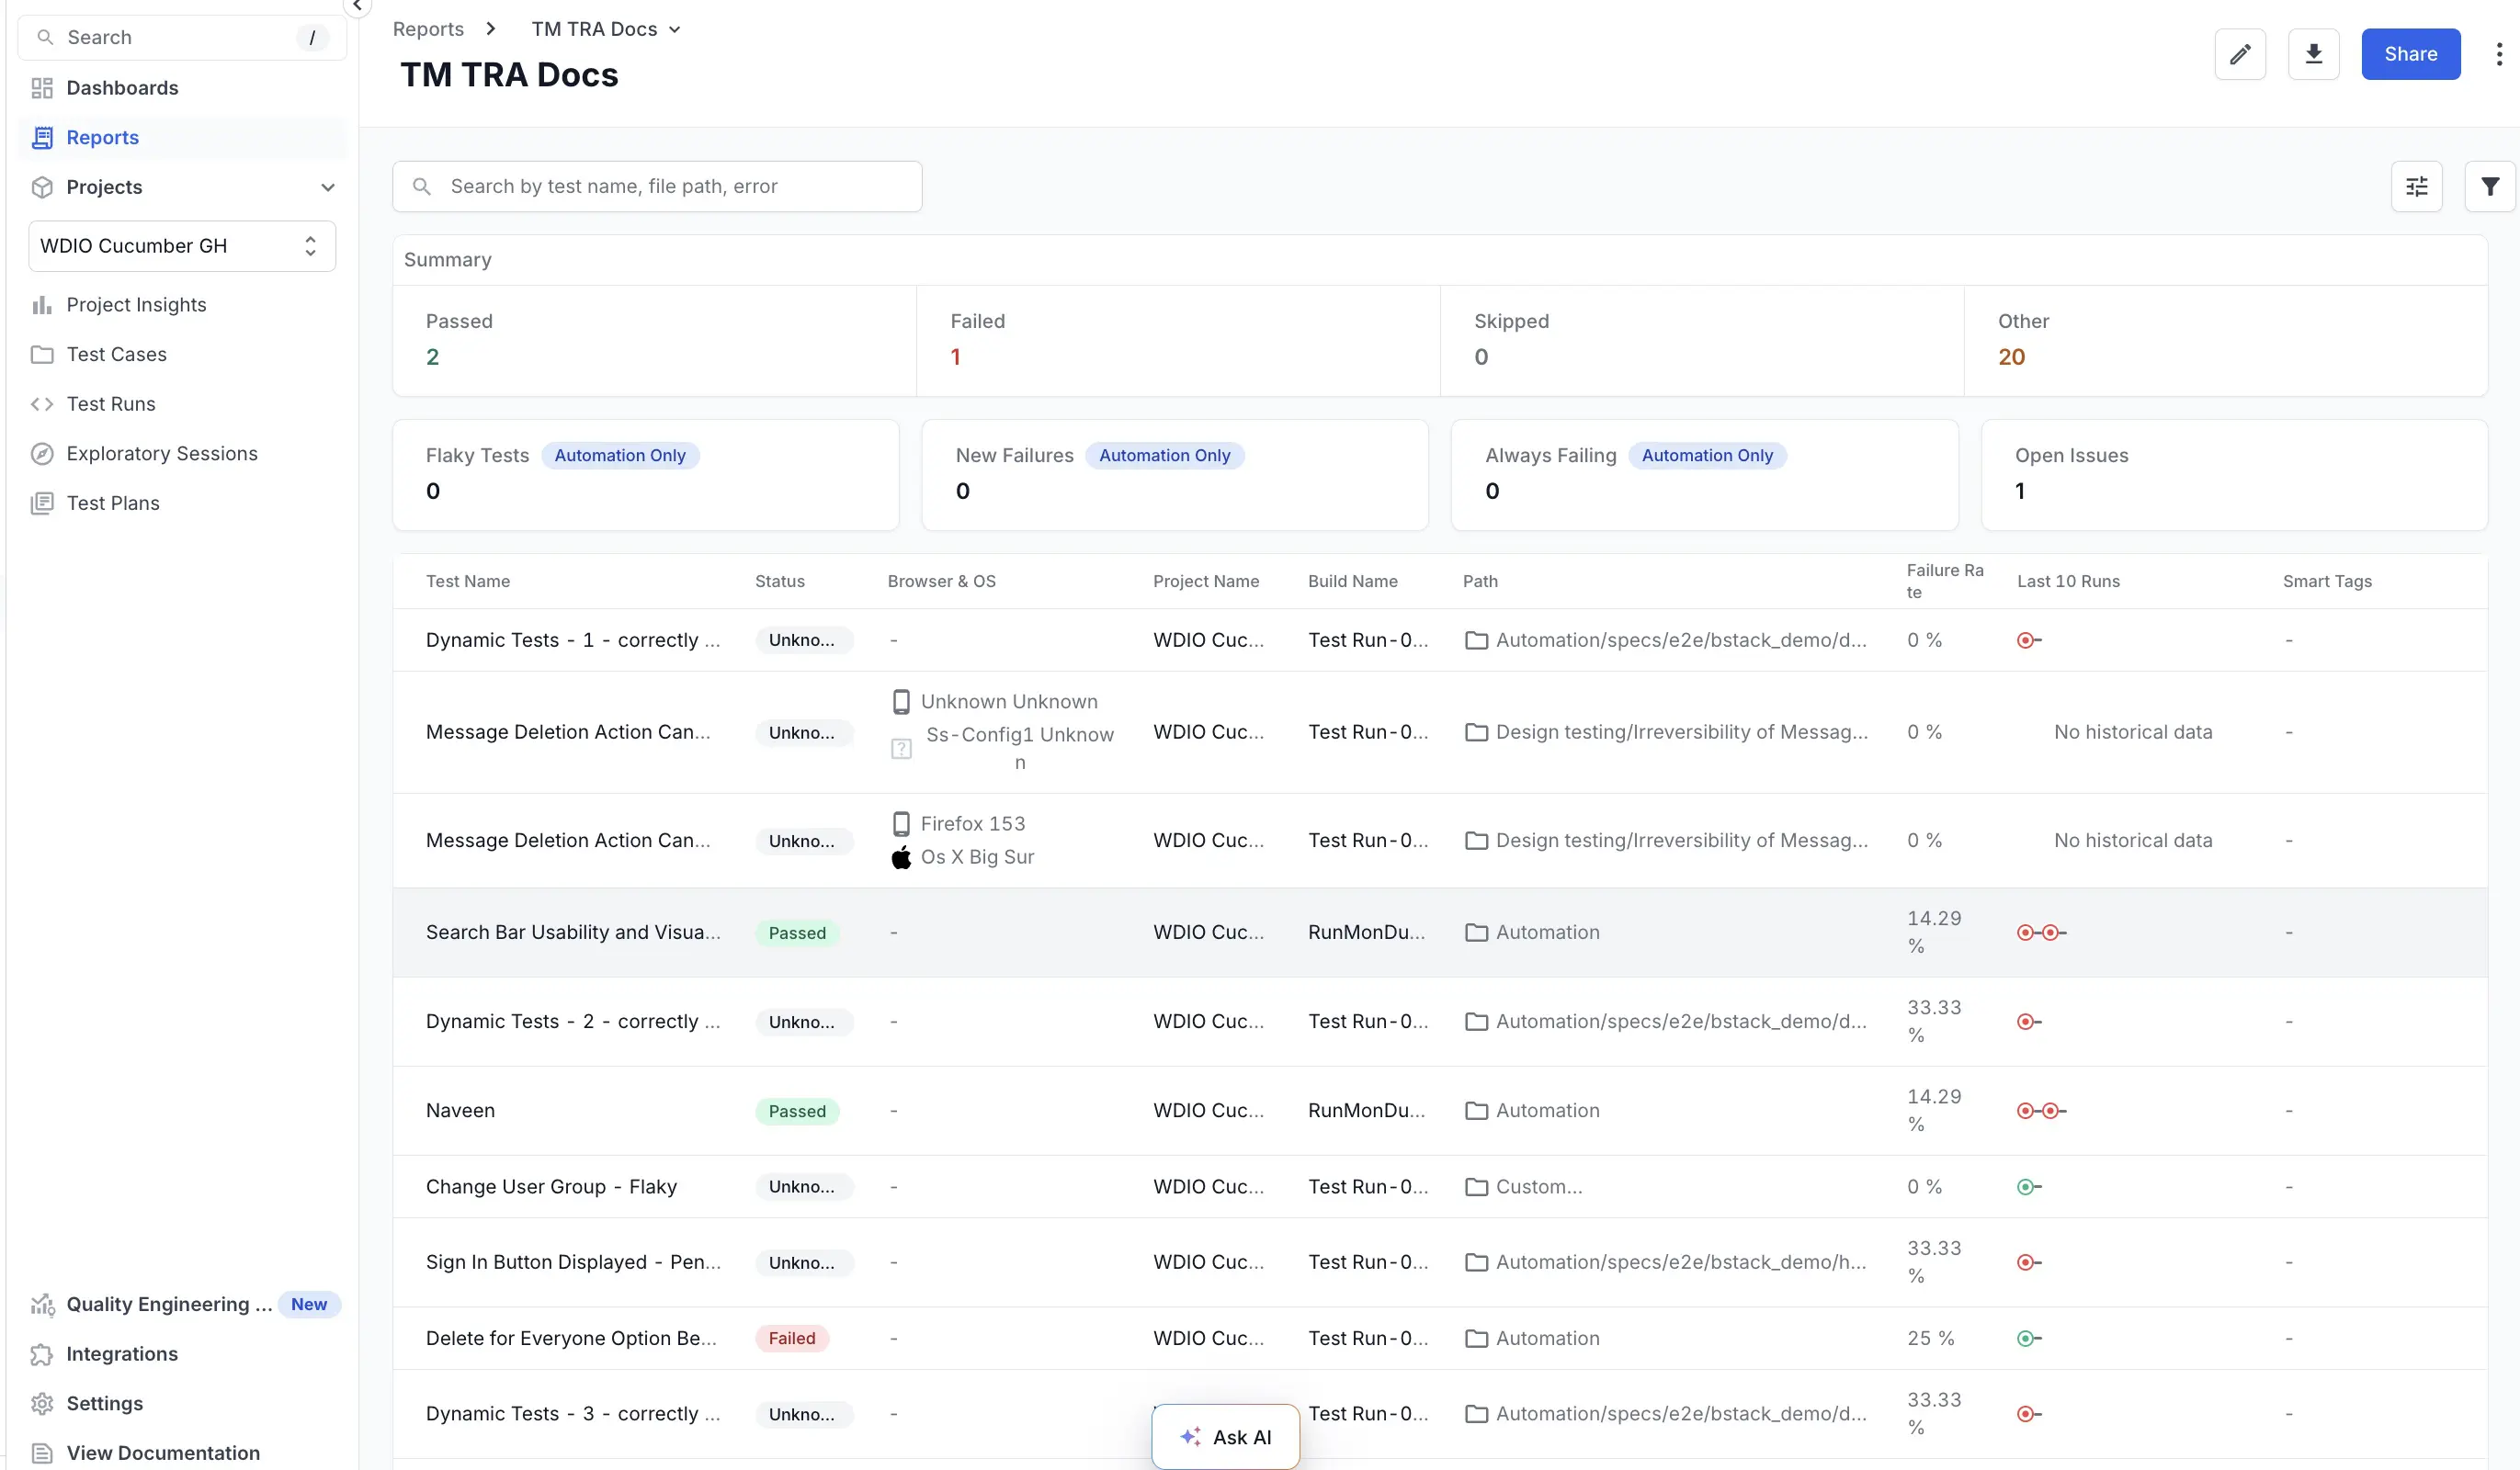
- Search and filter the table. Your personal filter state does not change the saved configuration:
- Use the search bar to find tests by name, file path, or error.
- Use Filters to refine by status, flaky, new failure, always failing, open issues, hooks visibility, user, folder, and project custom fields.
- Interact with stat tiles. Click a tile, for example Failed, to filter the table to that status.
- Drill down:
- Click a test row to open the test’s detail panel with history, trend, build information, and custom fields, or the debugger.
- Hover over the Last 10 runs sequence for run status tooltips.
- Expand failure stack trace column entries for detailed logs.
- Refine the table view. Sort, search, and filter within columns. Global search applies across fields.
- Export the report using the download buttons in the top-right corner.
- Share the report:
- Copy the link to retain current filters.
- Use the public URL if visibility is org-wide.
Unique test
Every test has a test hash associated with it, which is used to uniquely identify the test. If there are two tests with the same test hash, they are identified as the same test in the test execution report.
In automation runs, BrowserStack calculates the test hash using specific criteria, or you can define your own. For details, see Understand test history grouping.
For manual runs, BrowserStack builds the test hash by combining the test case ID, the data set row if the test is data-driven, the OS and version, the browser and full version, and the device.
Best practices
Follow these best practices to get the most out of test execution reports:
- Keep filters consistent when performing trend comparisons.
- Quarantine highly unstable tests surfaced in flakiness metrics before release gating.
- Use test execution reports as proof of coverage for sign-off meetings.
- Regularly export and archive test execution reports for compliance trails.
Troubleshooting
If you encounter issues while using test execution reports, consider the following troubleshooting tips:
- Incomplete data: Verify project access and retention window coverage.
- Missing columns: Re-enter Edit Mode to enable additional fields.
- Unexpected duplicates: Check overlapping data source segments. Deduplication might mask intended separate entries.
Related resources
- Test run summary report: Review the outcome of a single test run at a glance.
- Share and download reports: Export a report or share it through a public URL.
We're sorry to hear that. Please share your feedback so we can do better
Contact our Support team for immediate help while we work on improving our docs.
We're continuously improving our docs. We'd love to know what you liked
We're sorry to hear that. Please share your feedback so we can do better
Contact our Support team for immediate help while we work on improving our docs.
We're continuously improving our docs. We'd love to know what you liked
Thank you for your valuable feedback!