New dashboard migration guide for Automate & App Automate
Make maximum use of the new dashboard features in BrowserStack Automate and App Automate.
The new Test Reporting & Analytics (TRA) dashboard offers a faster, more flexible workflow than the old Automate or App Automate dashboards while preserving familiar patterns. The improvements include fewer clicks, better discoverability, and access to improved features of the new dashboard over the old dashboard experience.
The new dashboard is more informative and useful for analyzing and debugging your test suites. While transitioning from the old dashboard to the new one, you can adopt the following three-step process:
- First, simulate the old dashboard experience in a few steps.
- Then, optimize the navigation.
- And finally, apply advanced optimization techniques to make maximum use of the new dashboard.
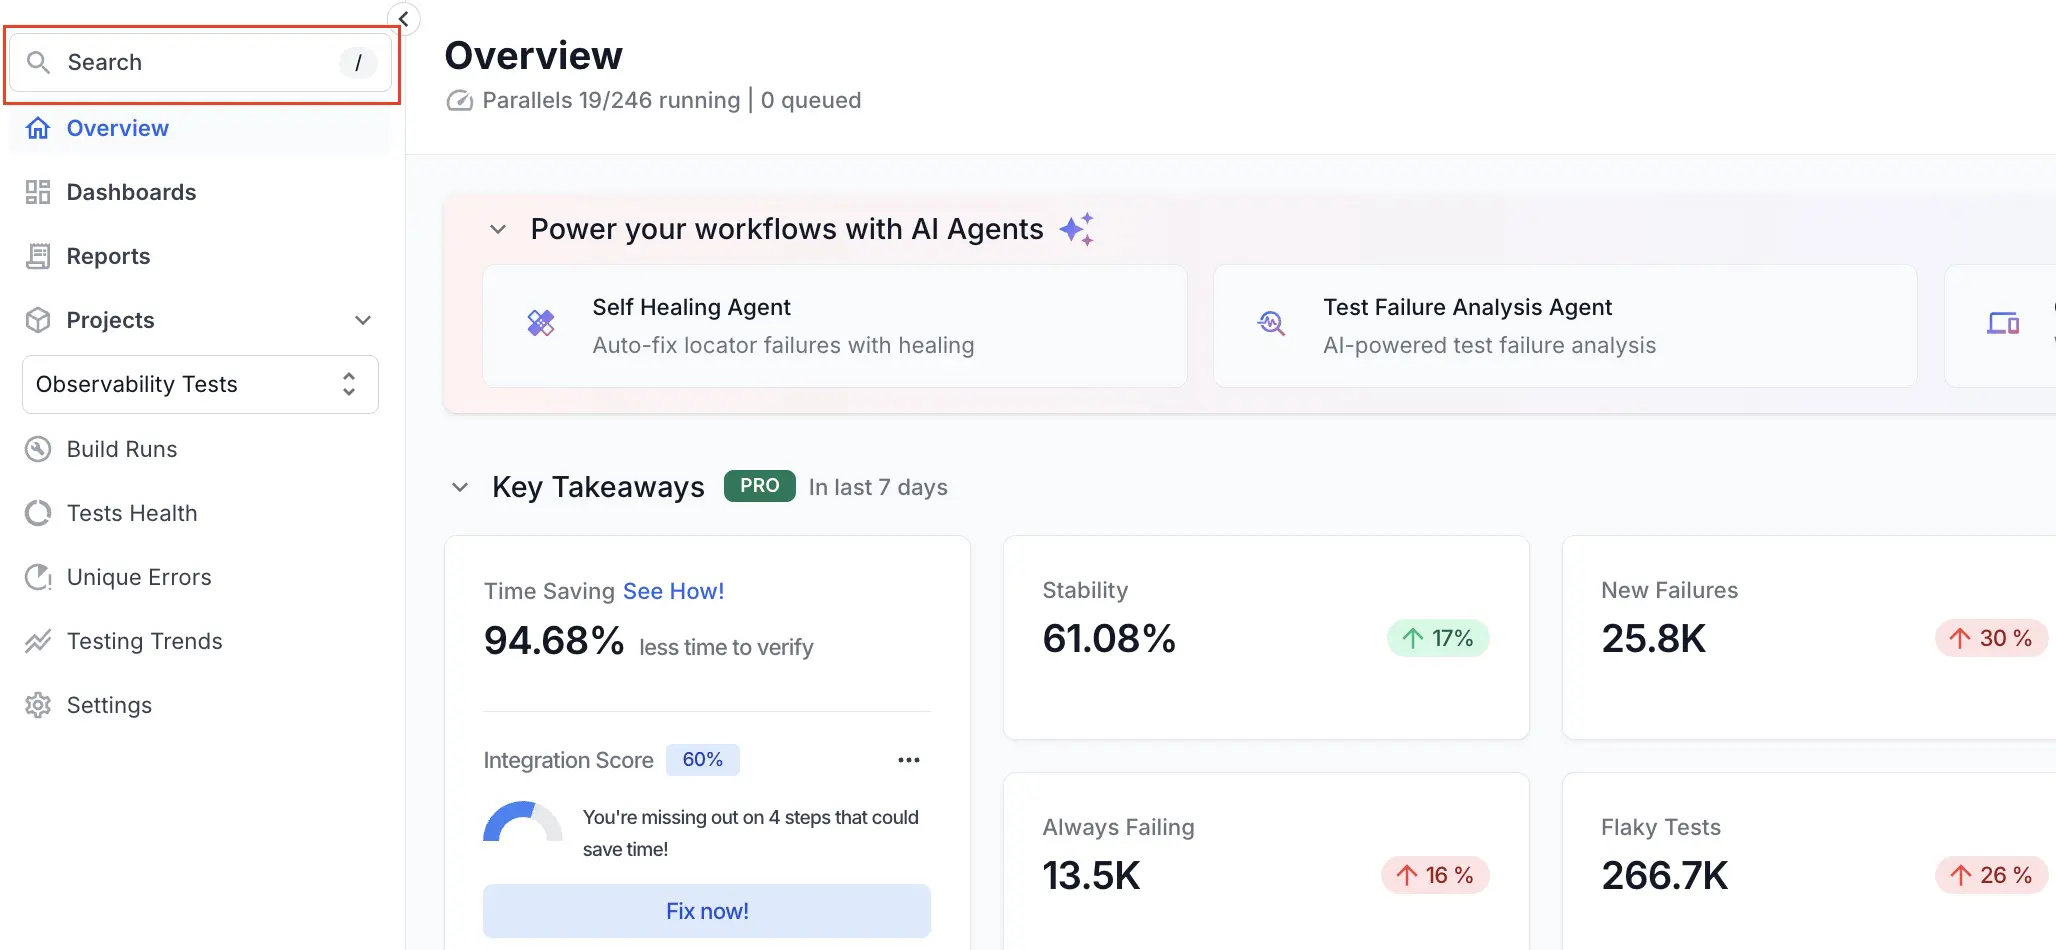
Quick access
The new dashboard makes it easier to find important information. Use the following navigation guide to locate key features, manage your assets, and monitor your testing activity within the dashboard:
-
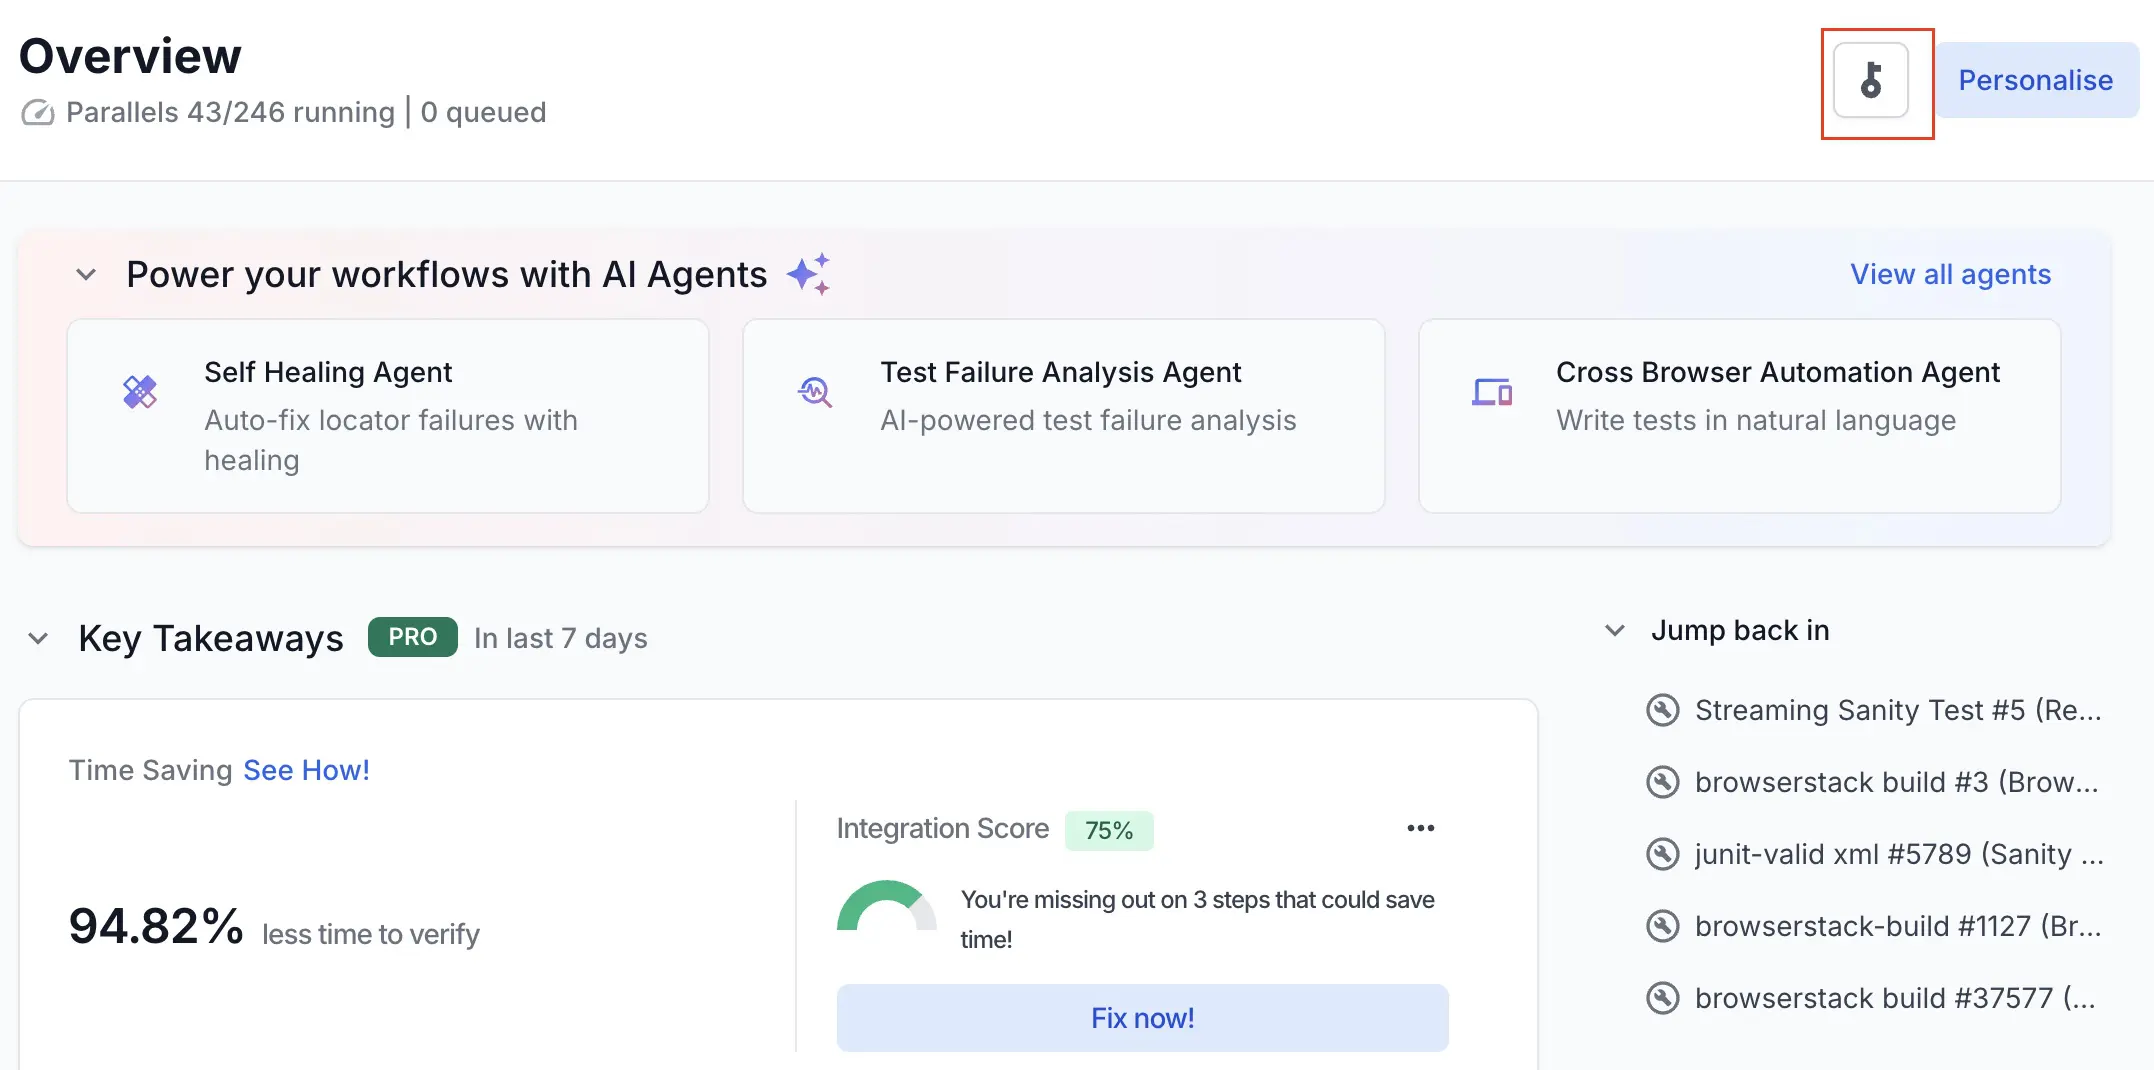
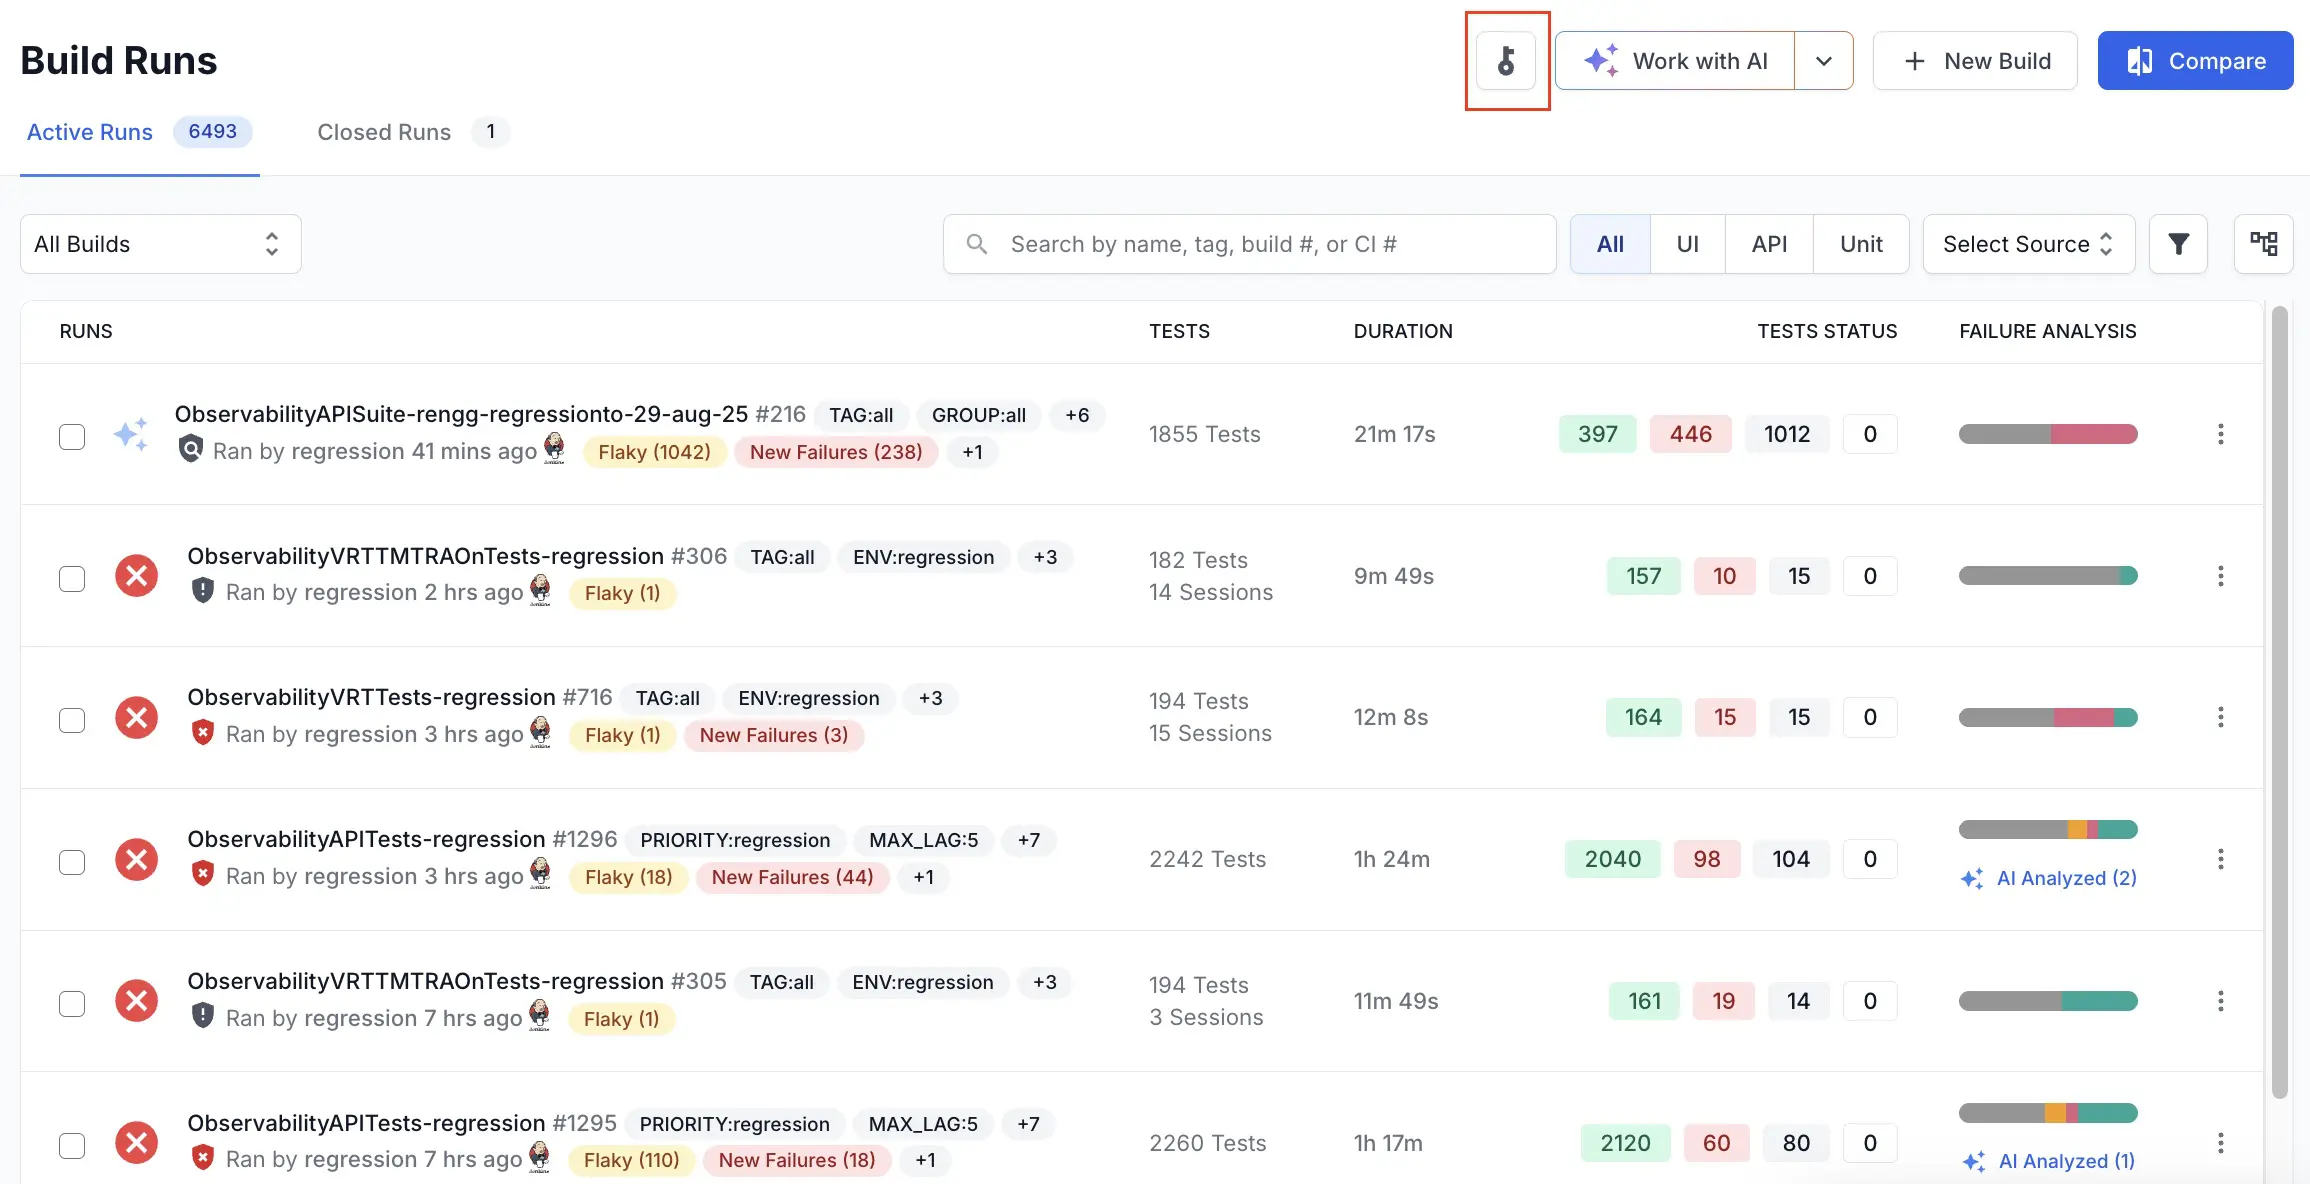
Access Keys: Navigate to the Overview or Build Runs page and click the key button.
-
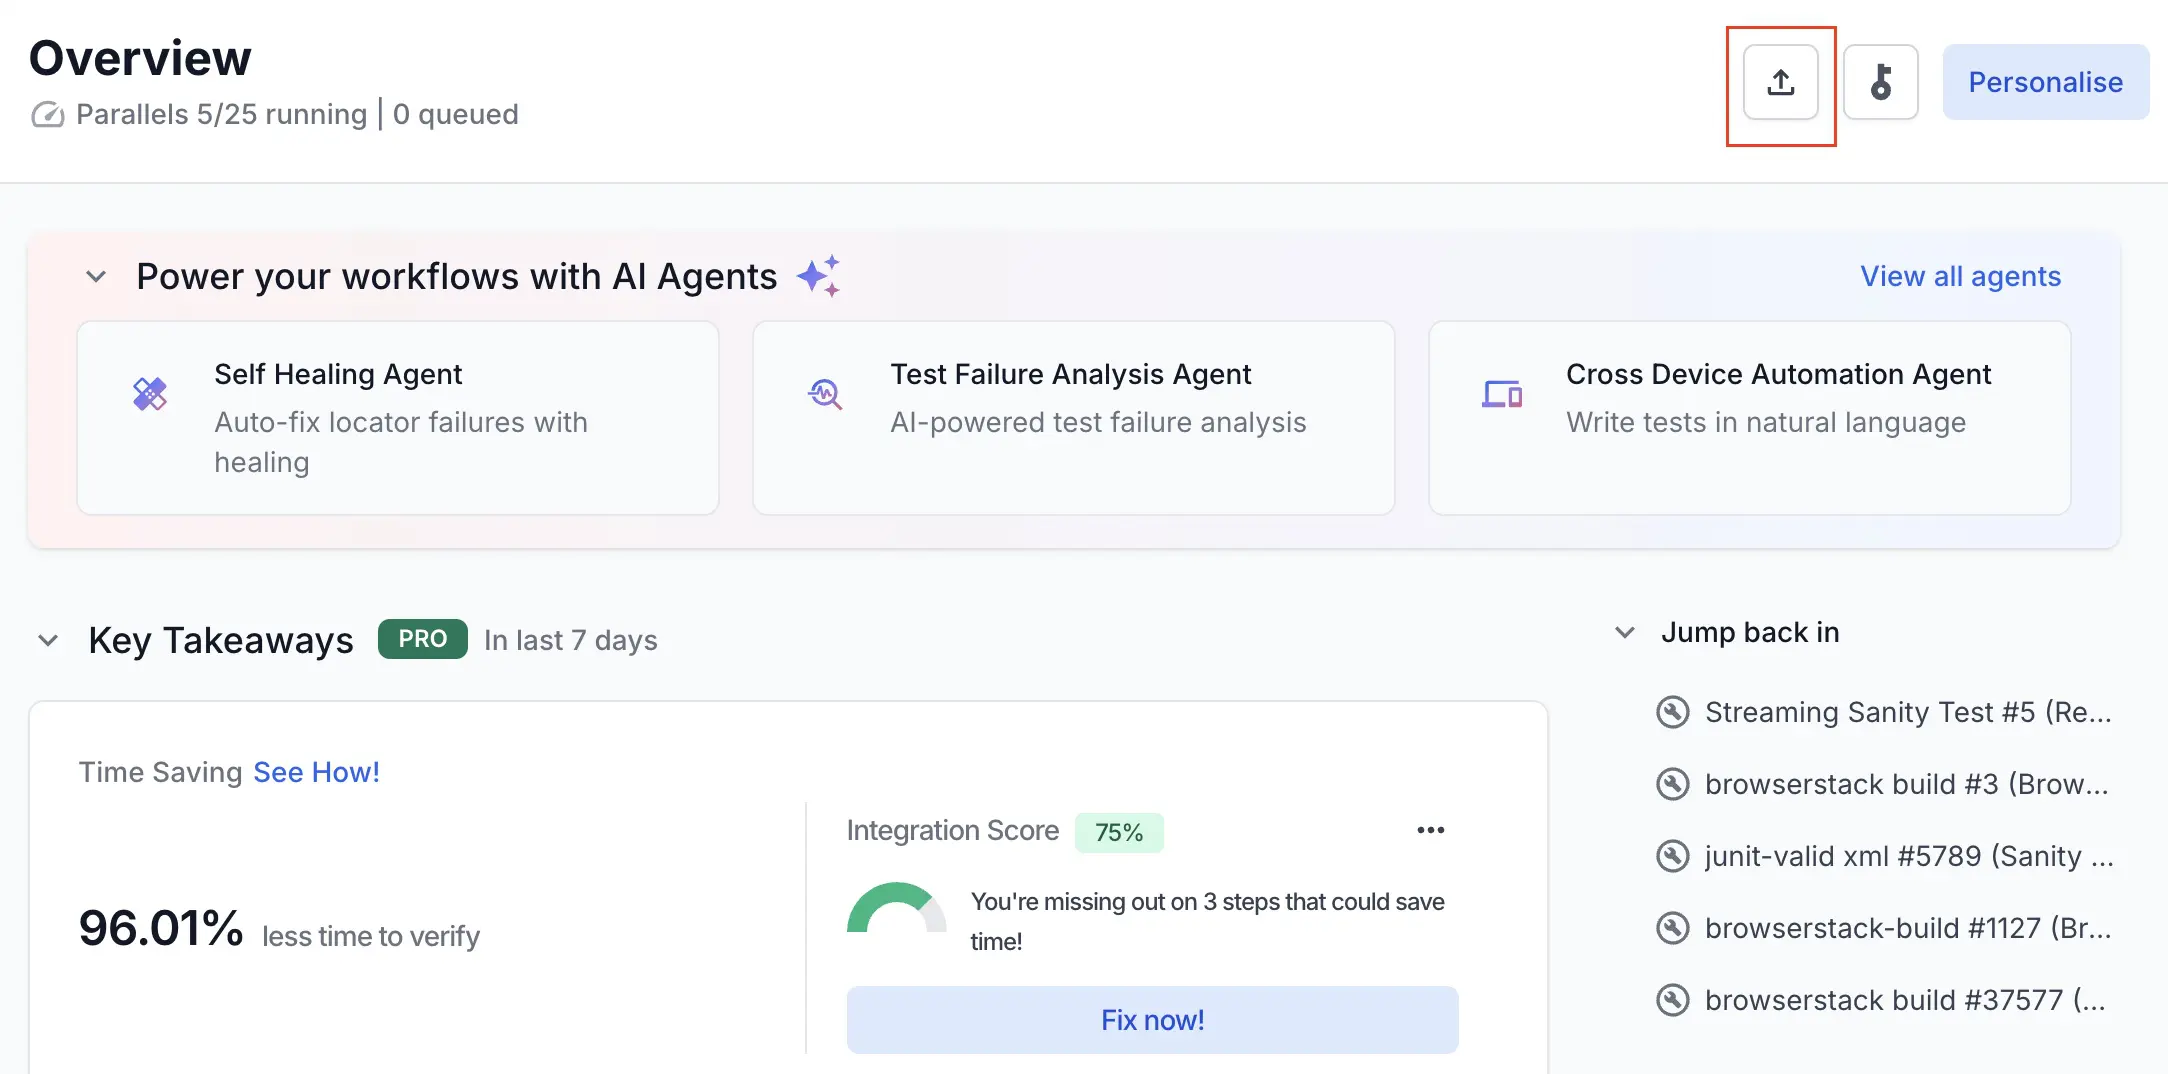
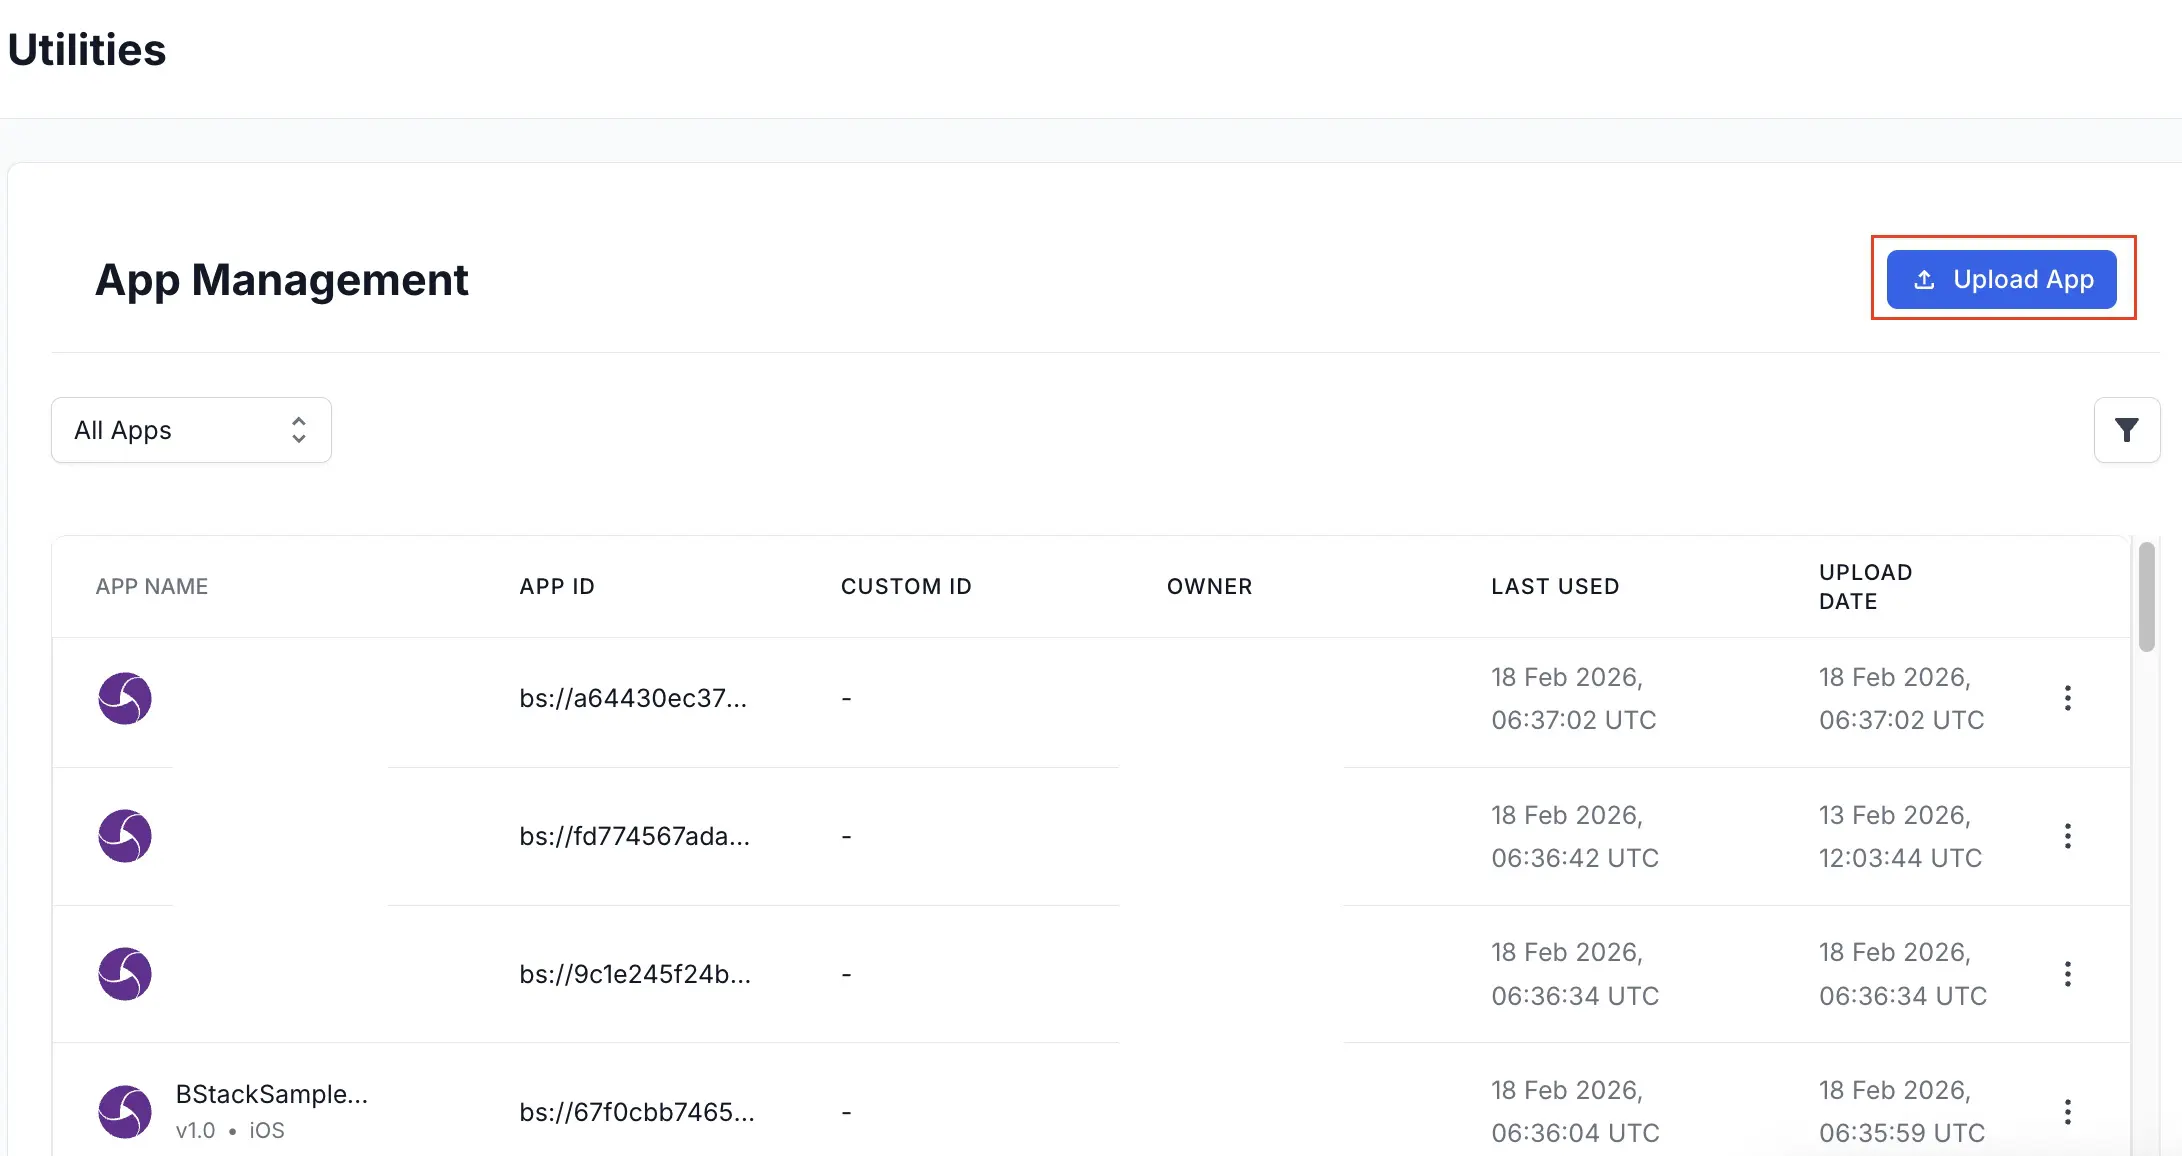
App Uploads: Use the Overview or App Management page in App Automate.
-
Live parallel usage: Check the Usage Snapshot in the primary left sidebar.

-
Project location: Find Projects under Overview.
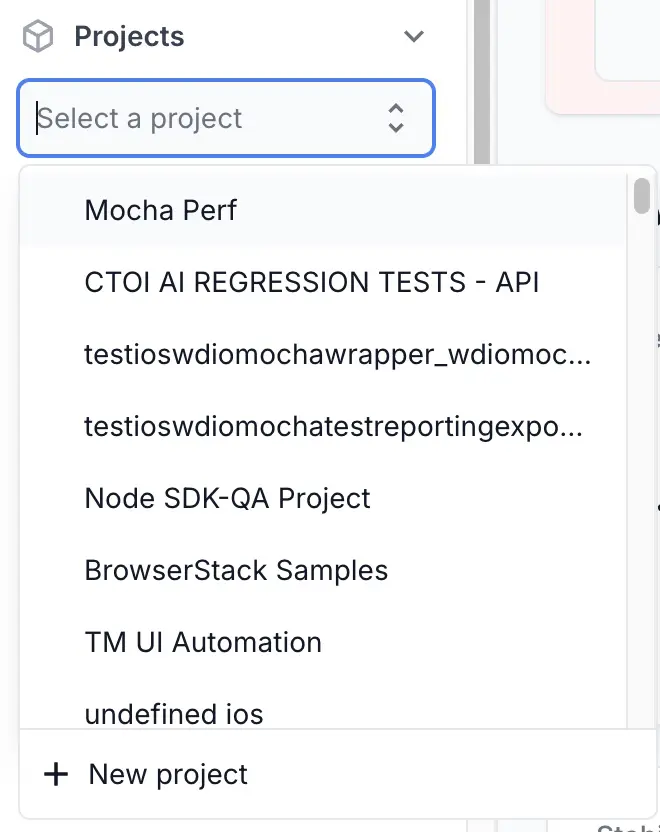
The new dashboard organizes your test suite into projects. Provide static project names using the projectName capability to get the most benefit from the new dashboard.
-
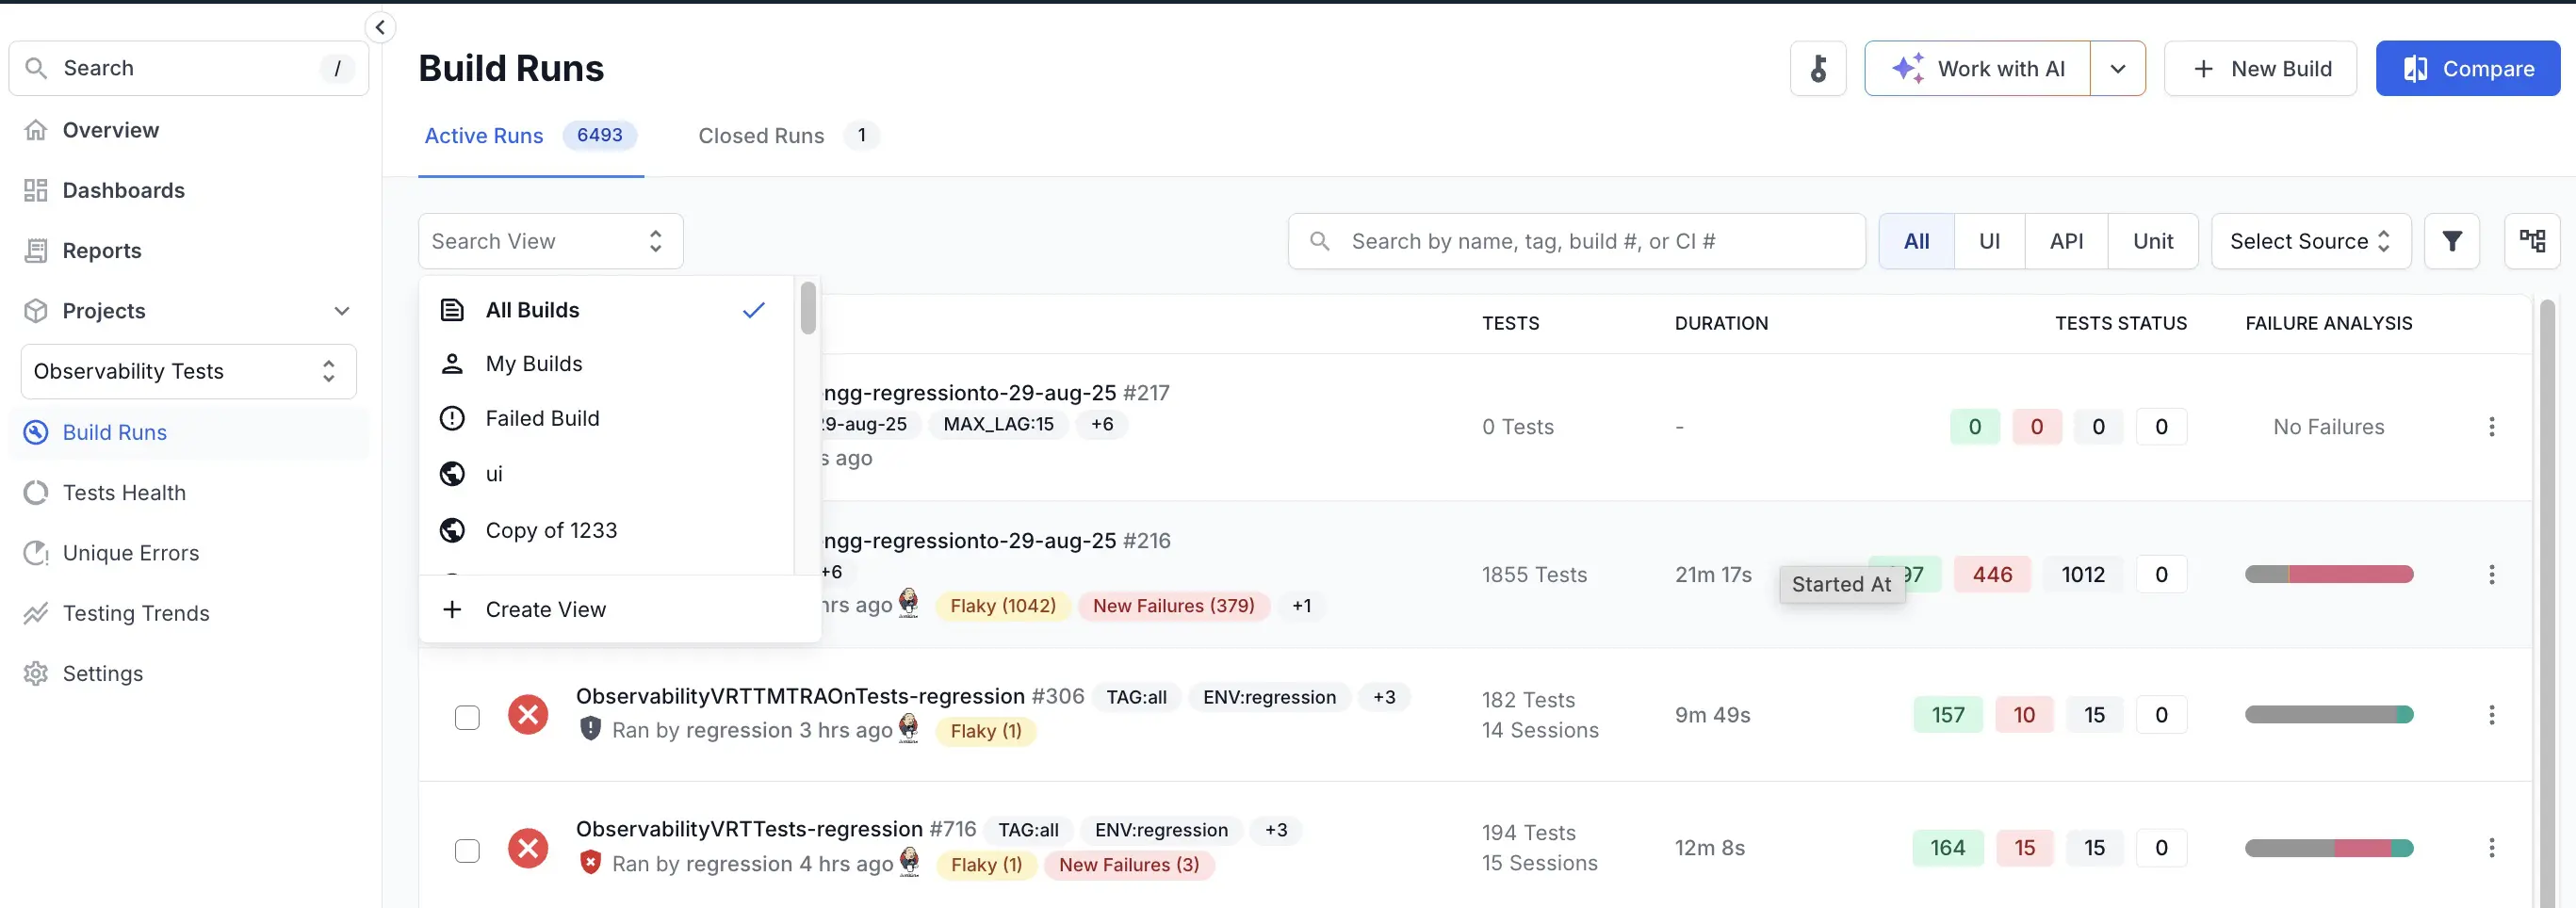
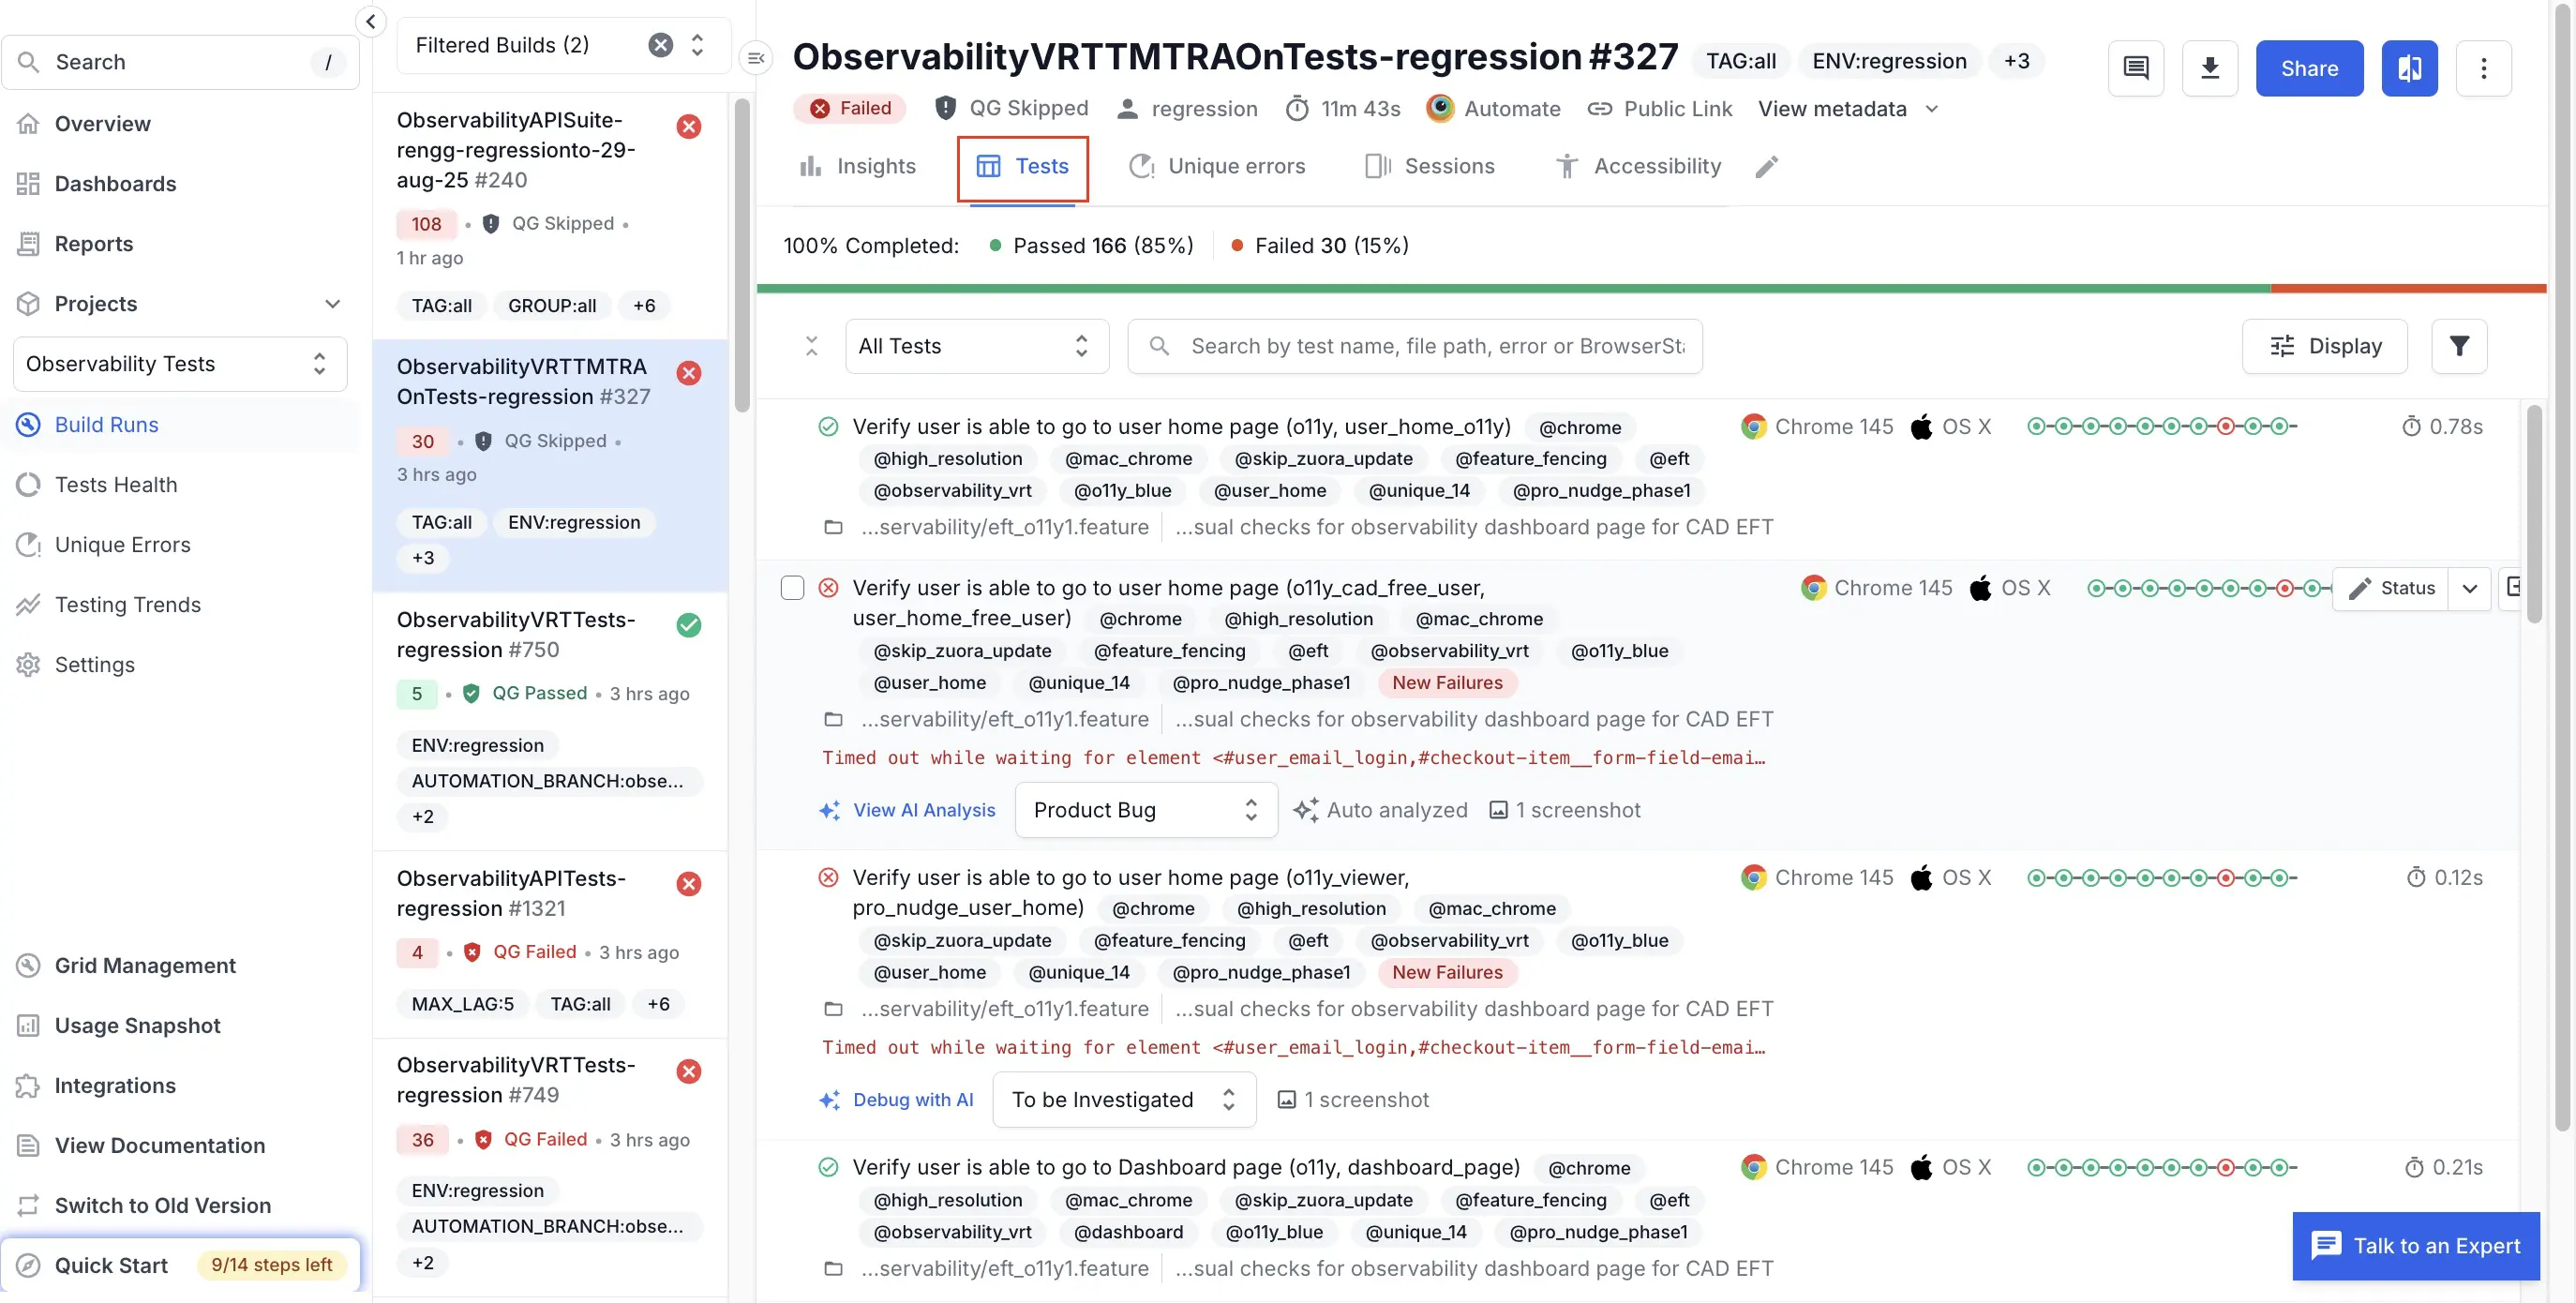
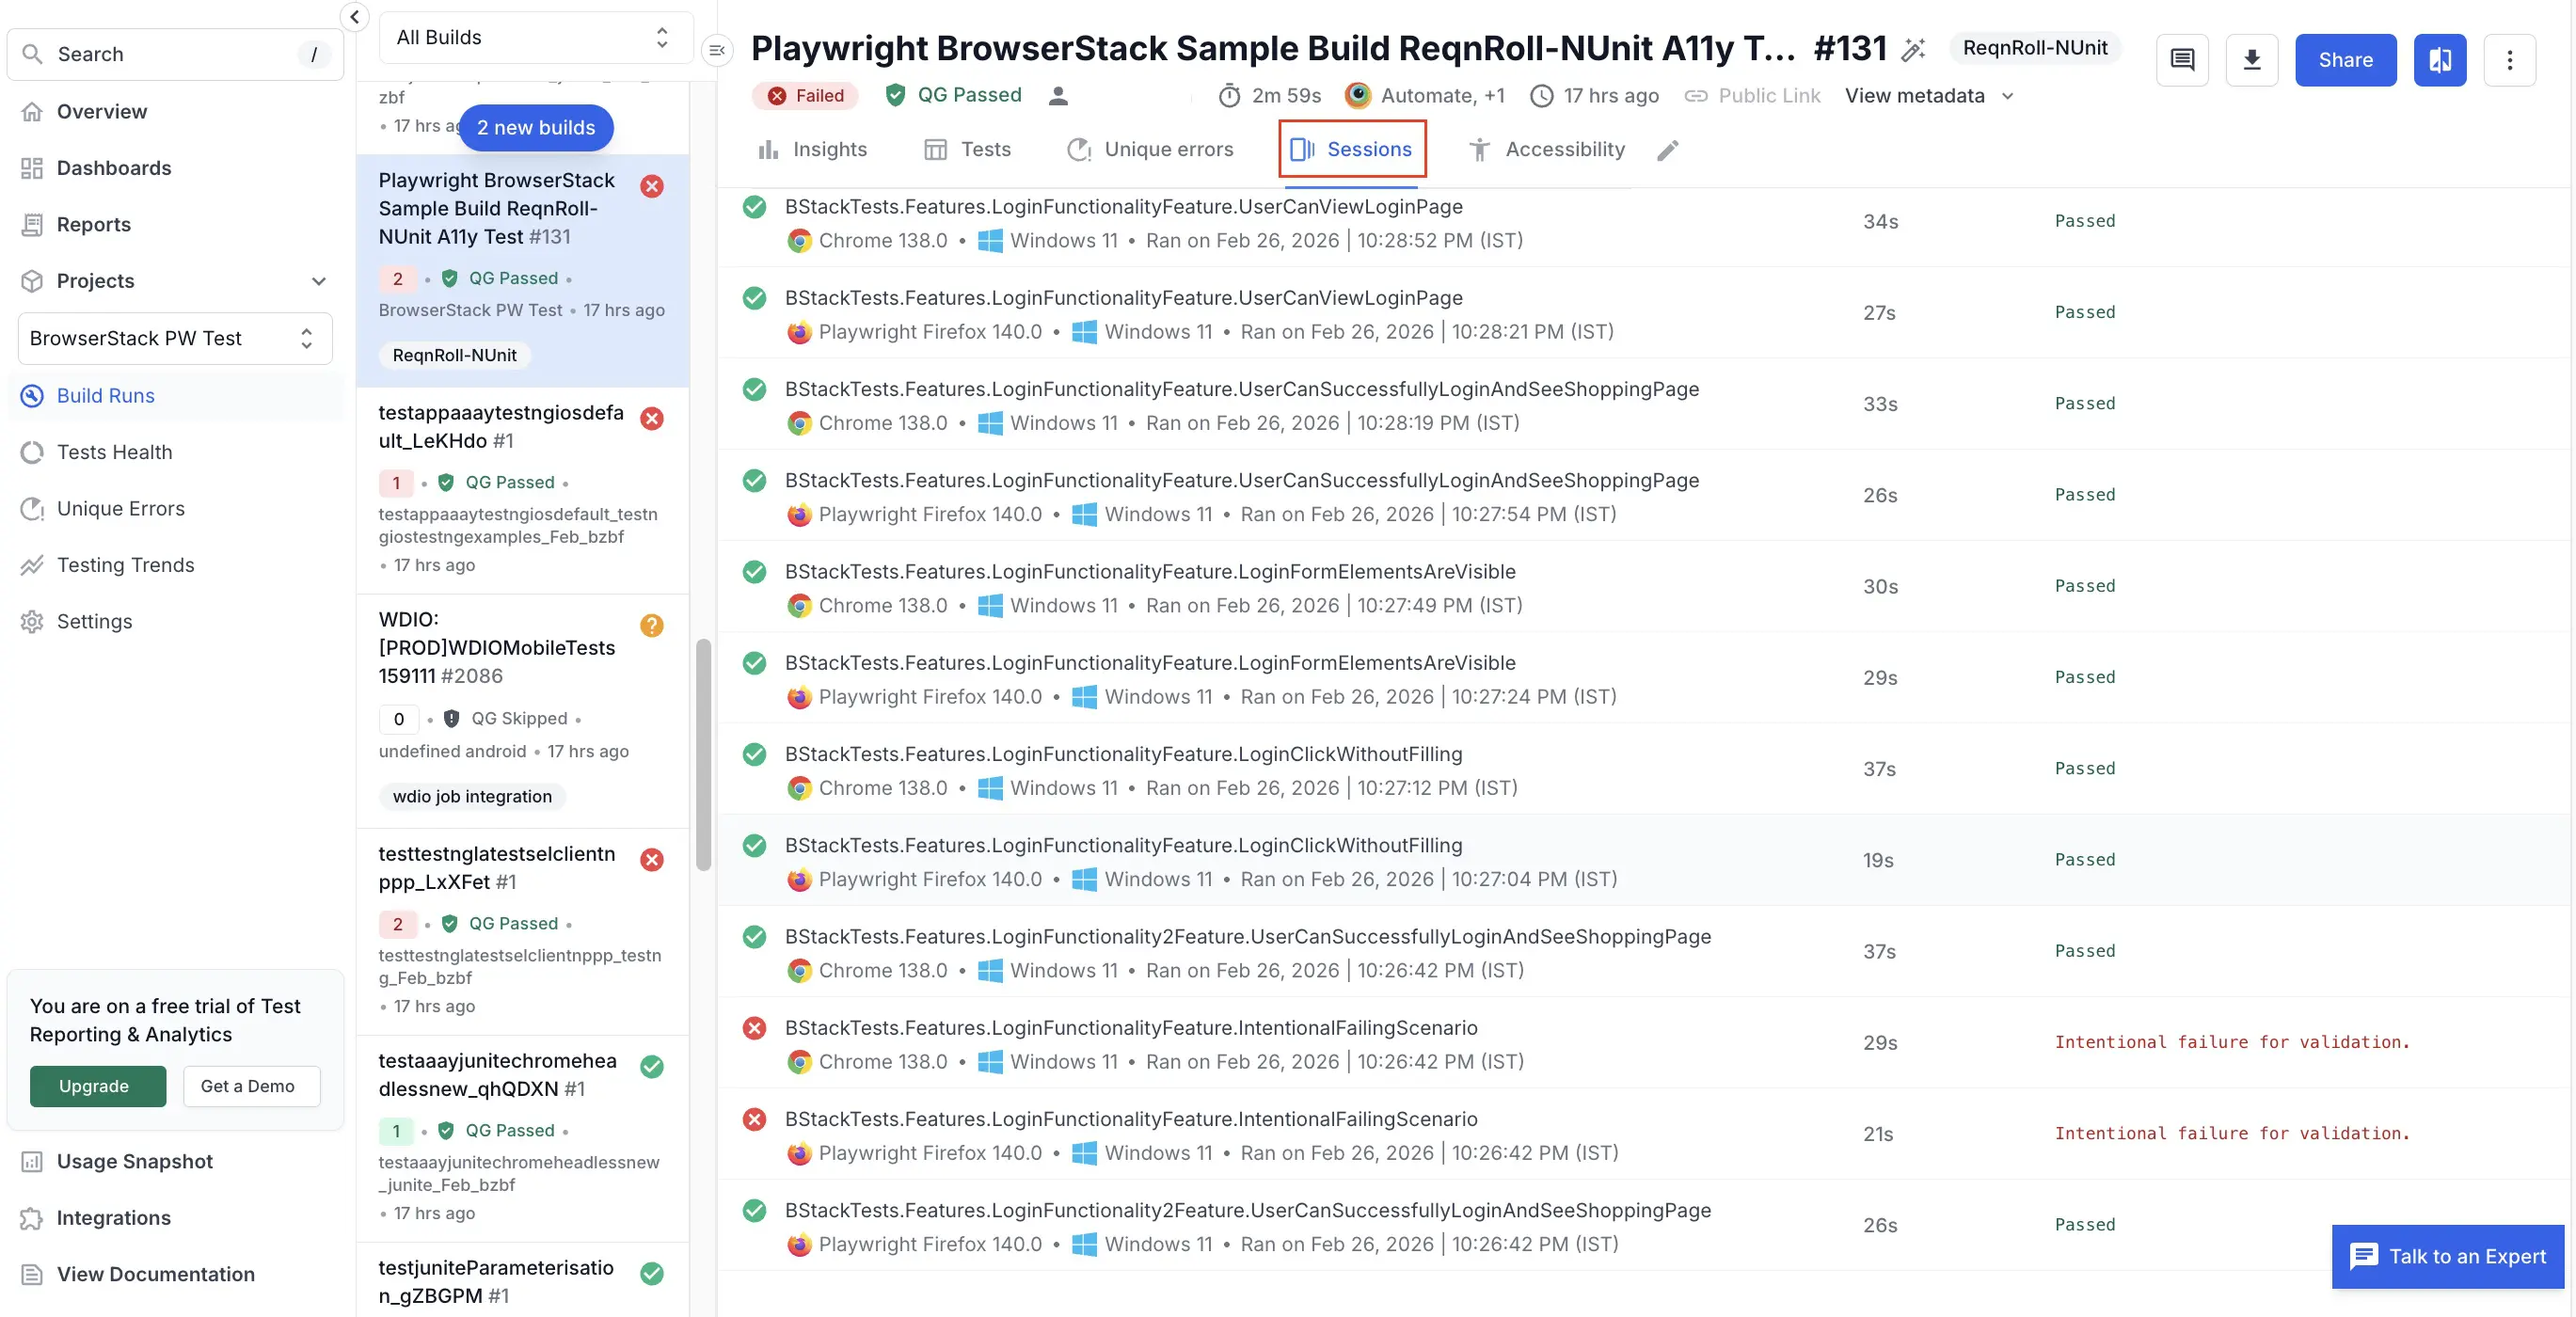
Build Runs location: Find Build Runs under the Projects menu. You can use the Search View drop-down to select All Builds, My Builds, or any specific build.
-
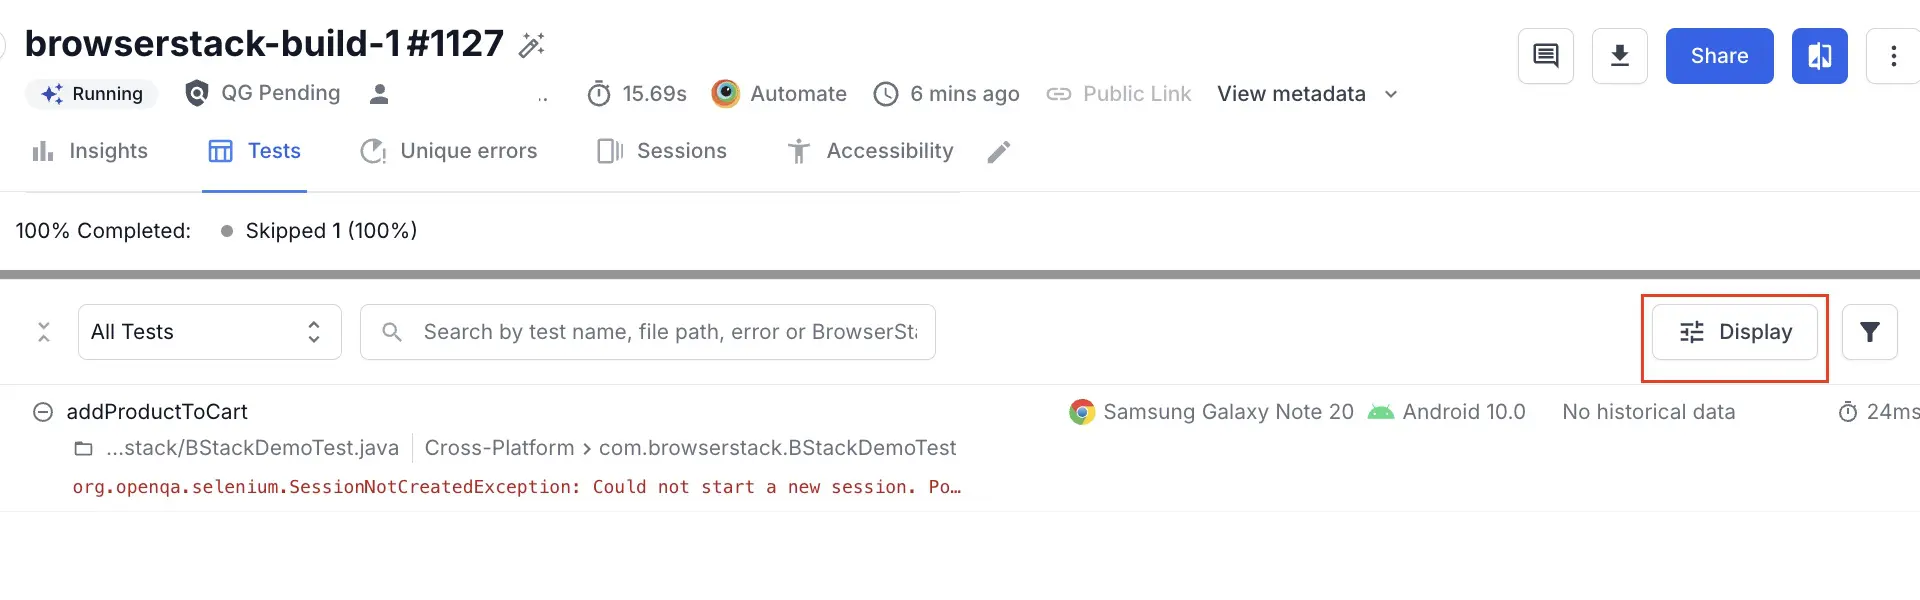
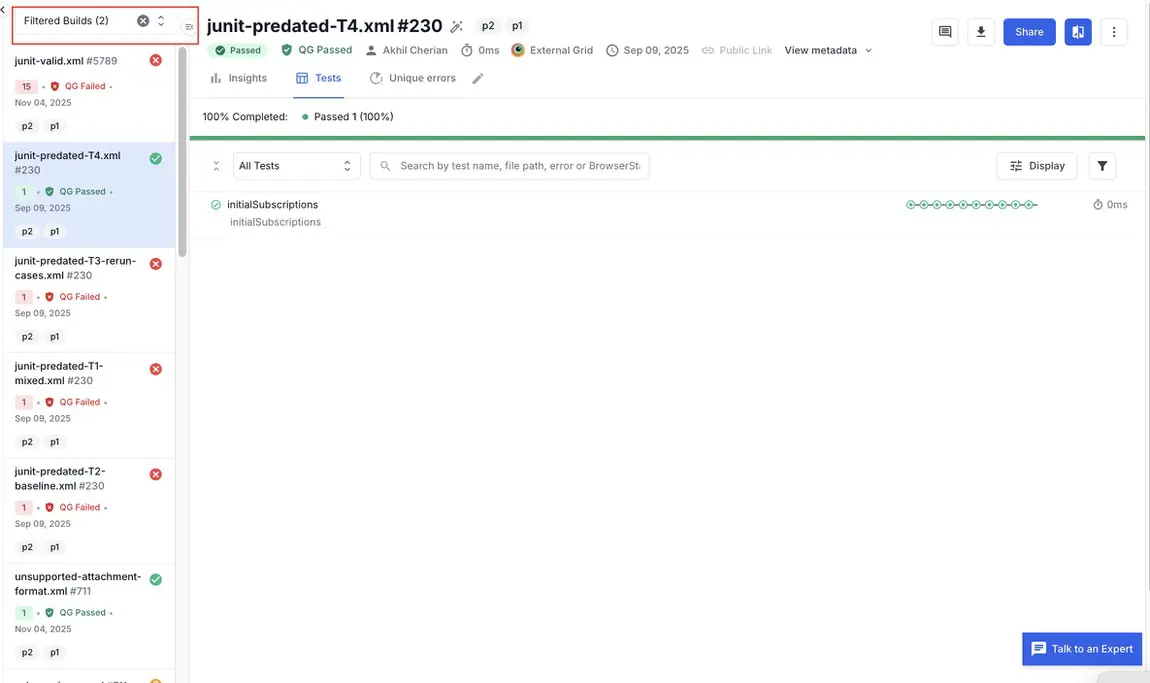
Build details (Tests): Click a build run to view the build in detail. Specific tests are located within the Tests tab of Build Runs. A Test is a single logical test case from your test suite (for example, one ‘it’ block in JavaScript, or one test method in JUnit/TestNG).
The Tests tab is where you see test-level results and analytics, like pass/fail status, history across runs, flakiness, and other insights. In this view, tests are grouped into one if they are rerun in the same build.
-
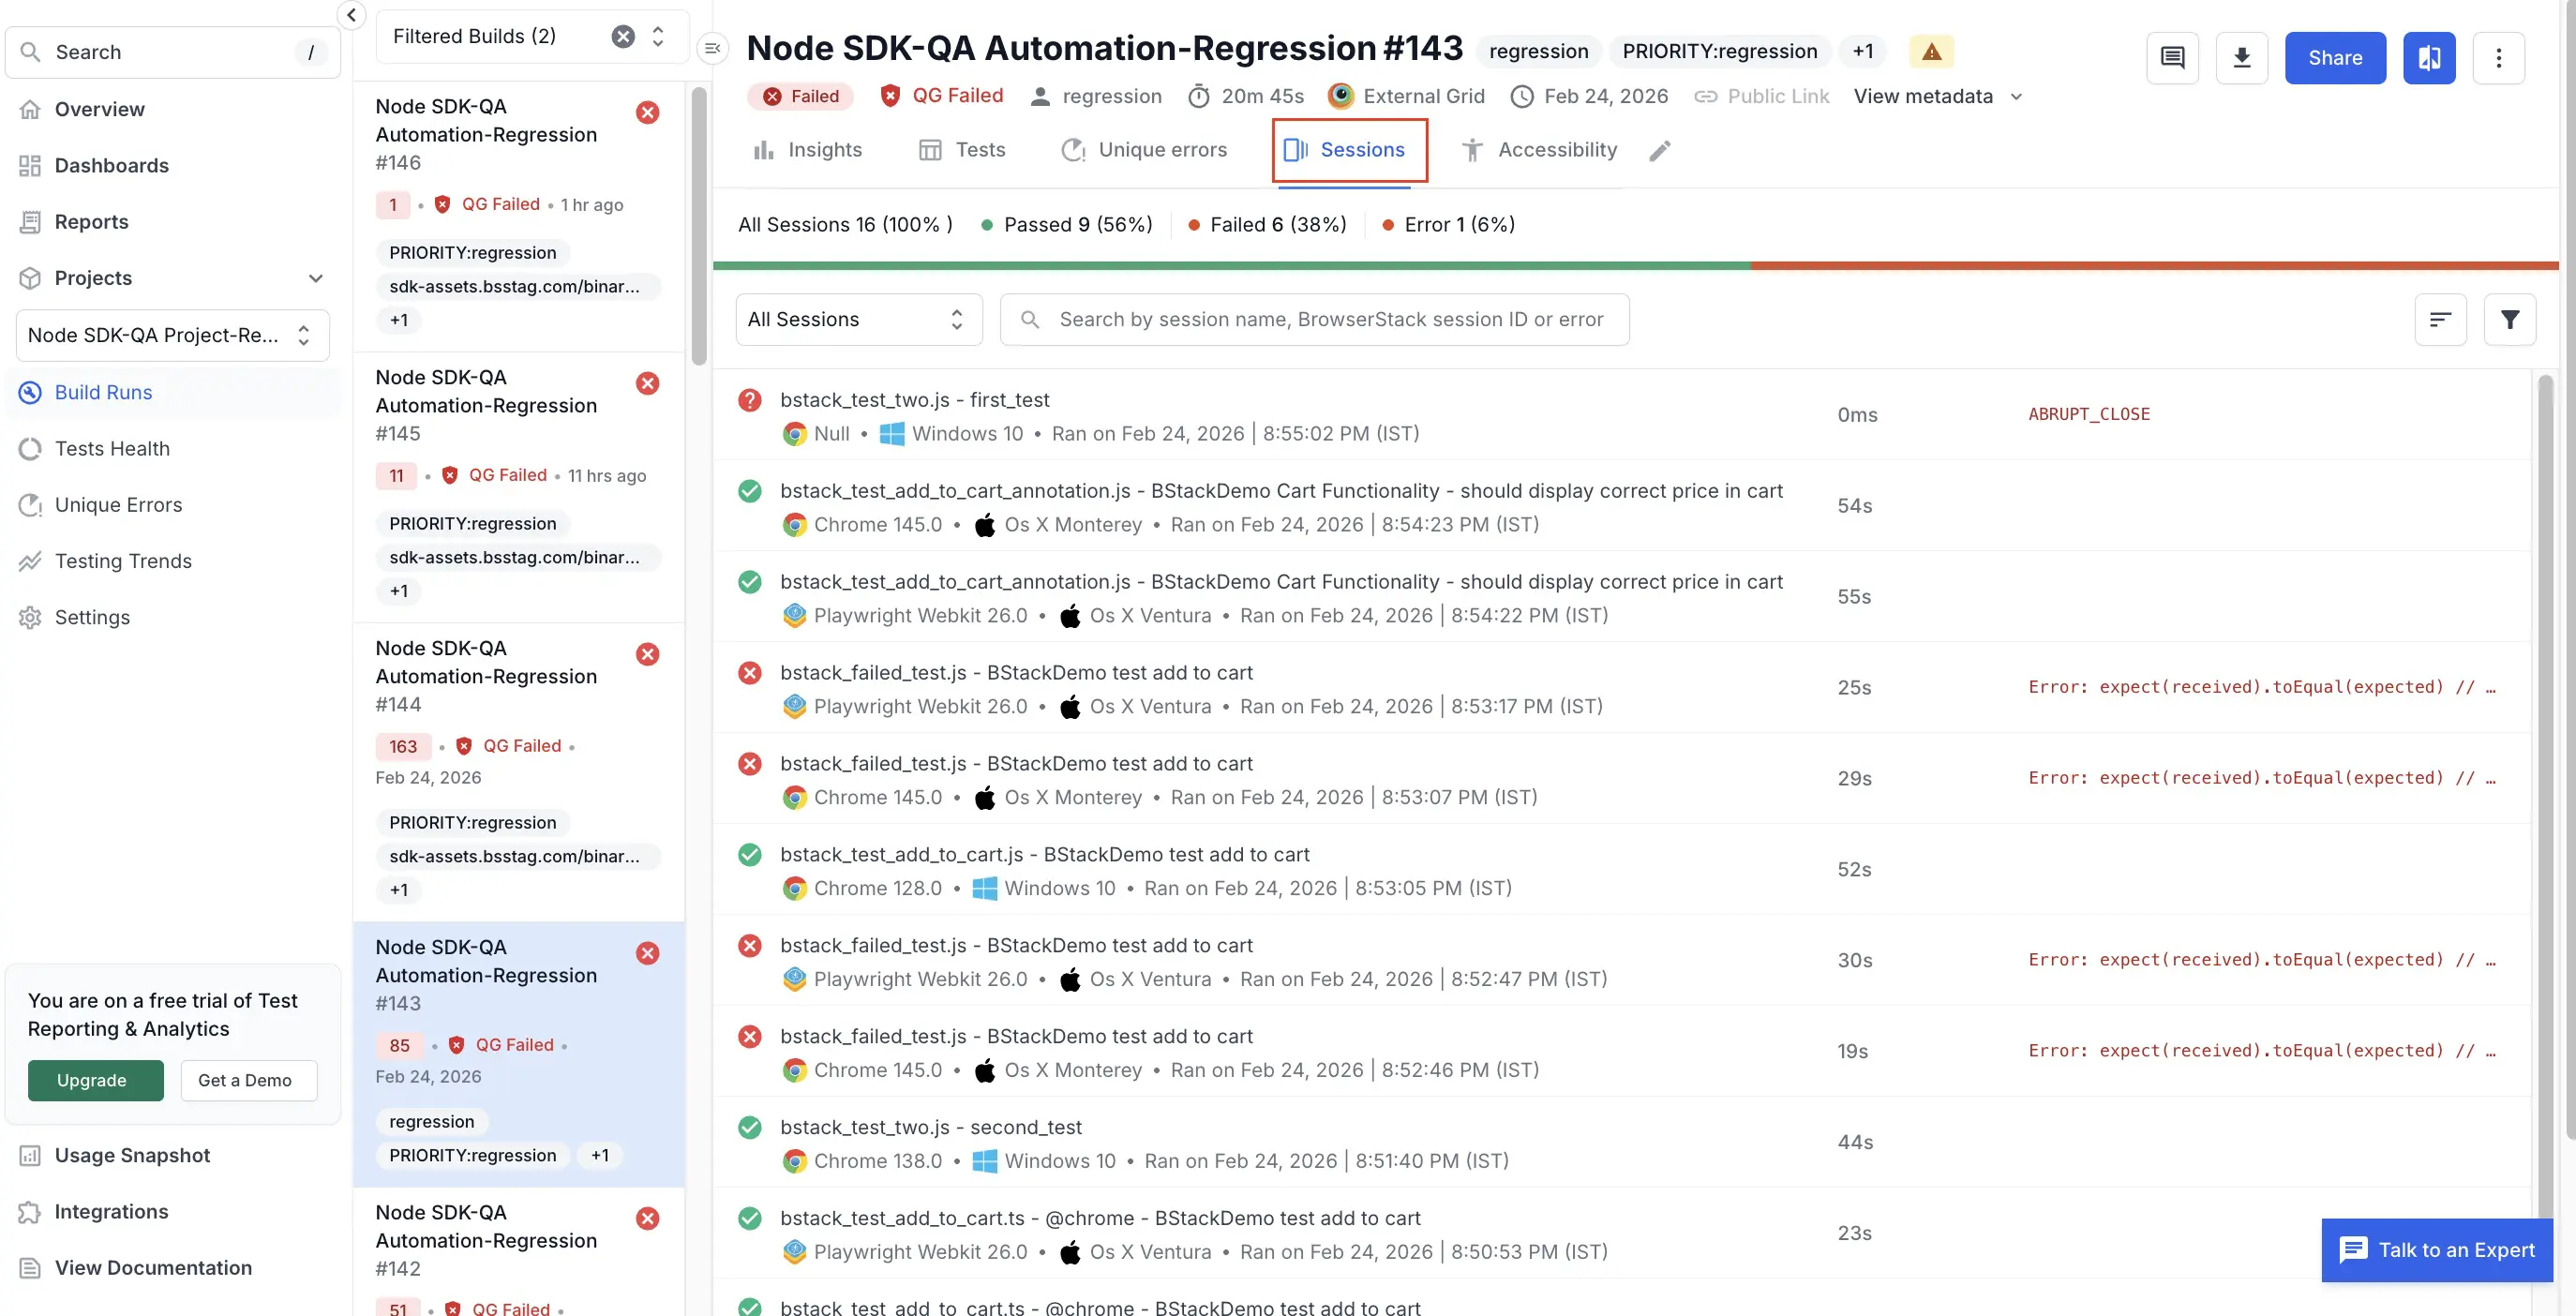
Build details (Sessions): Click the Sessions tab of Build Runs to view individual sessions. A session is a single run of your test on a specific browser or device on BrowserStack. It starts when your test script opens a browser or app on BrowserStack and ends when the driver quits. Each session has its own video, logs, and other debug data. The Sessions tab is where you see everything that happened on that machine including video, device/browser details, console & network logs, etc.
-
Search: Use the search box in the primary left sidebar to quickly locate tests, sessions, builds, or projects.
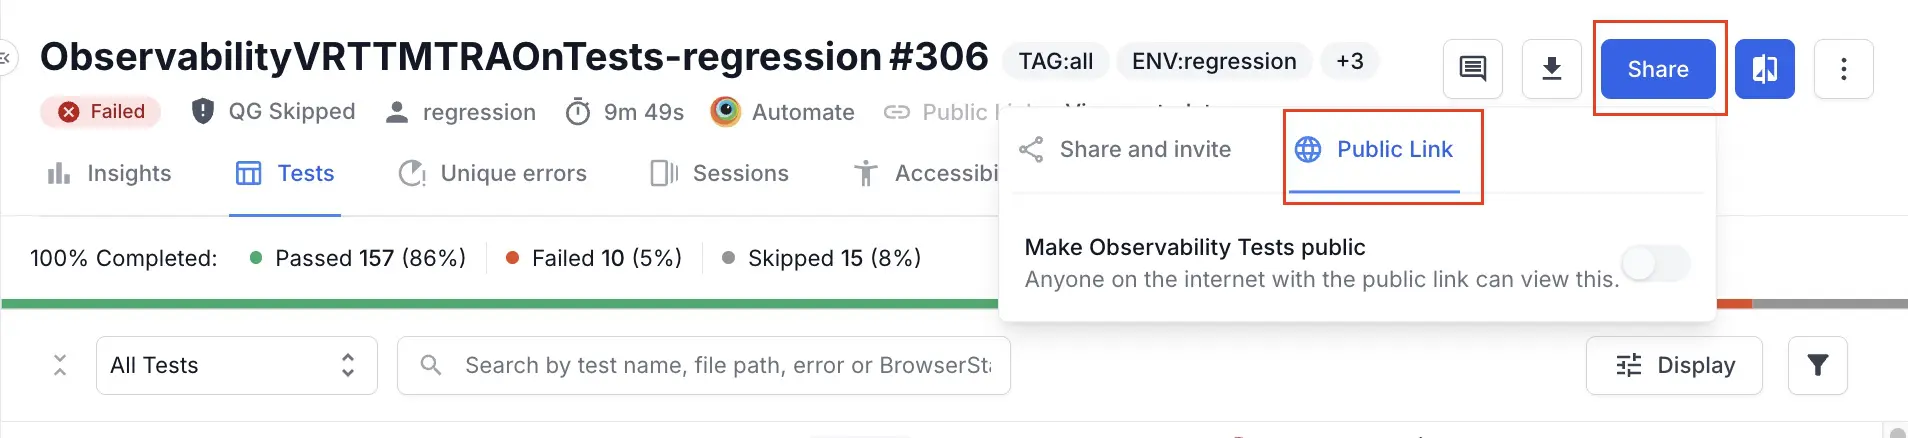
- You can share links with individuals outside your team using public links. With public links, you can share these artifacts with clients, vendors, or other stakeholders without adding them to your BrowserStack account. You can share builds, dashboards, and test results within your team or externally. For example, when raising issues in Jira, Slack, or email, you can paste direct TRA links to a specific build, a filtered failed-tests view, or a single failing test. Teammates can directly view the exact context without extra clicks.
Organize your tests
To get maximum benefits of the new dashboard, you need to organize tests in your test suites:
- Set a static project name per suite instead of per build run (e.g., per product line or environment). A static project name for a test suite helps to create meaningful insights in the new dashboard.
- Set the projectName capability to organize the builds.
-
Standardize build naming in your test suites. Consistent build names enhance the effectiveness of the Overview and build list sidebar. Follow these guidelines to configure the
buildNamecapability to get the most value out of the new dashboard:- Use a static name for
buildNamewhen running the same test suite across multiple browsers in your nightly regression job. - Use a different static name for
buildNamewhen running a subset of tests in your sanity job. - Do not use dynamic build names as BrowserStack maps historical runs of a test case in the context of the build name, and dynamic build names can lead to incomplete or inaccurate historical run stats.
- For more information, see the How to use build names within projects section.
- Use a static name for
Optimize your workflow in the new dashboard
You can improve your transition to the new dashboard experience in the following ways:
Simulate the old dashboard experience
-
Follow these steps to recreate the old dashboard experience:
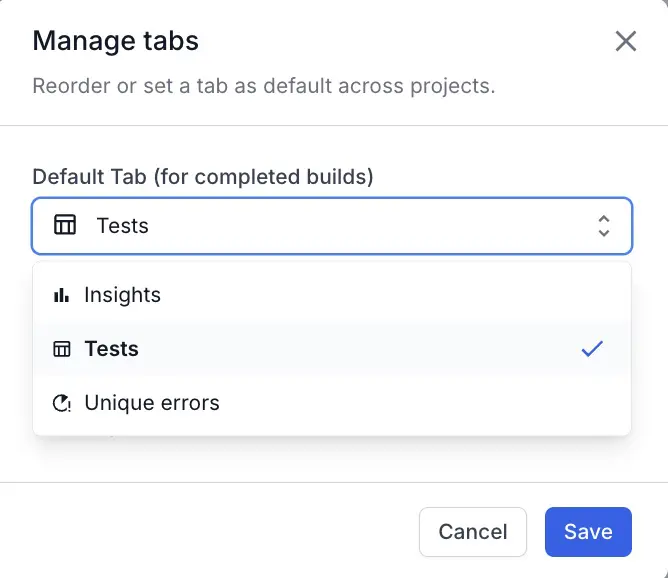
- To set Tests as the default tab in Build Runs:
- Click the edit icon next to the tabs.
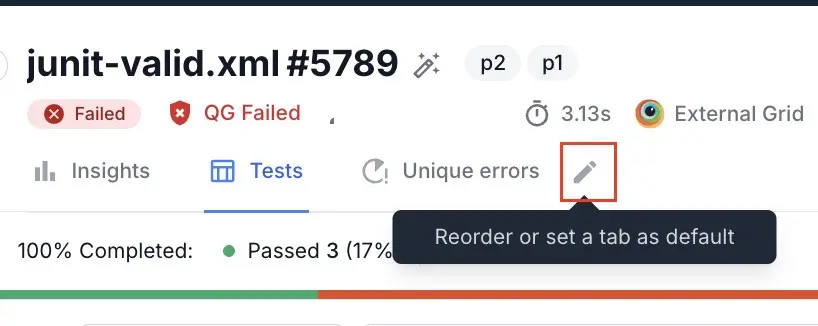
- Select Tests from the menu and click Save to set the Tests tab as the first tab when you open a build. This configuration removes the extra click and closely matches the old dashboard.
- Click the edit icon next to the tabs.
- To switch Tests layout to a list view:
- Click Display. The List layout shows more tests per screen and makes it easier to scan status and metadata. The list layout is also closer to the old dashboard’s test listing experience.
- Select Flat listing and click Apply.
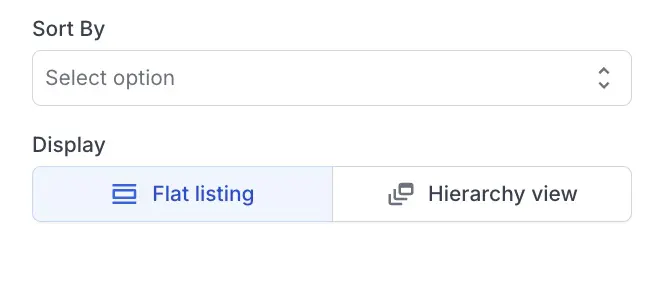
- Click Display. The List layout shows more tests per screen and makes it easier to scan status and metadata. The list layout is also closer to the old dashboard’s test listing experience.
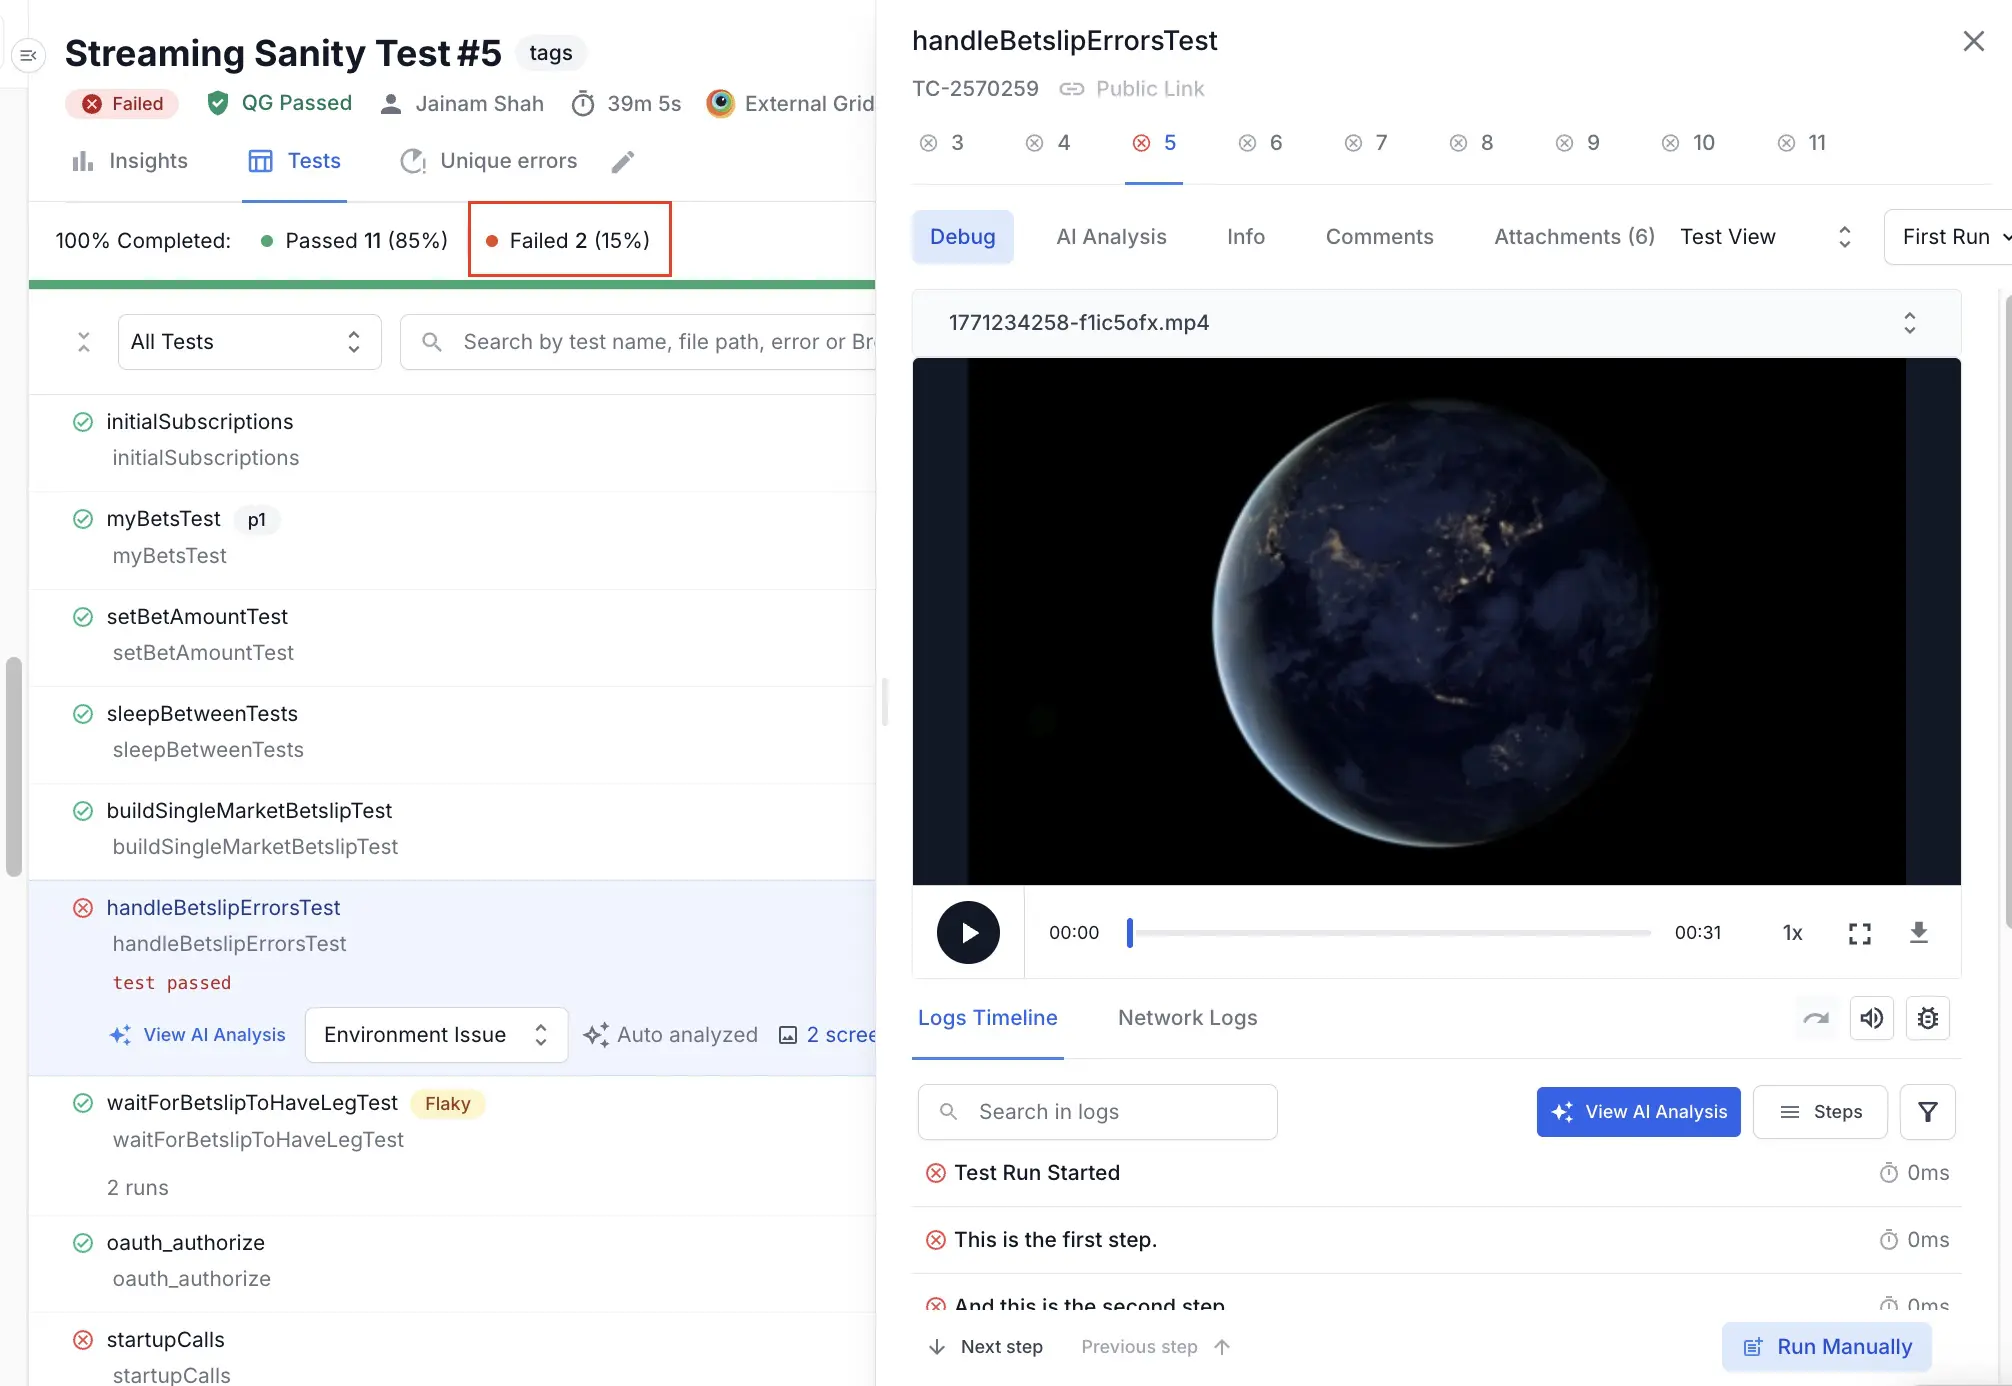
- To view a two-column layout:
- Open any test from the Tests tab.
- Expand the test detail panel from the default one-column layout to a two-column layout.
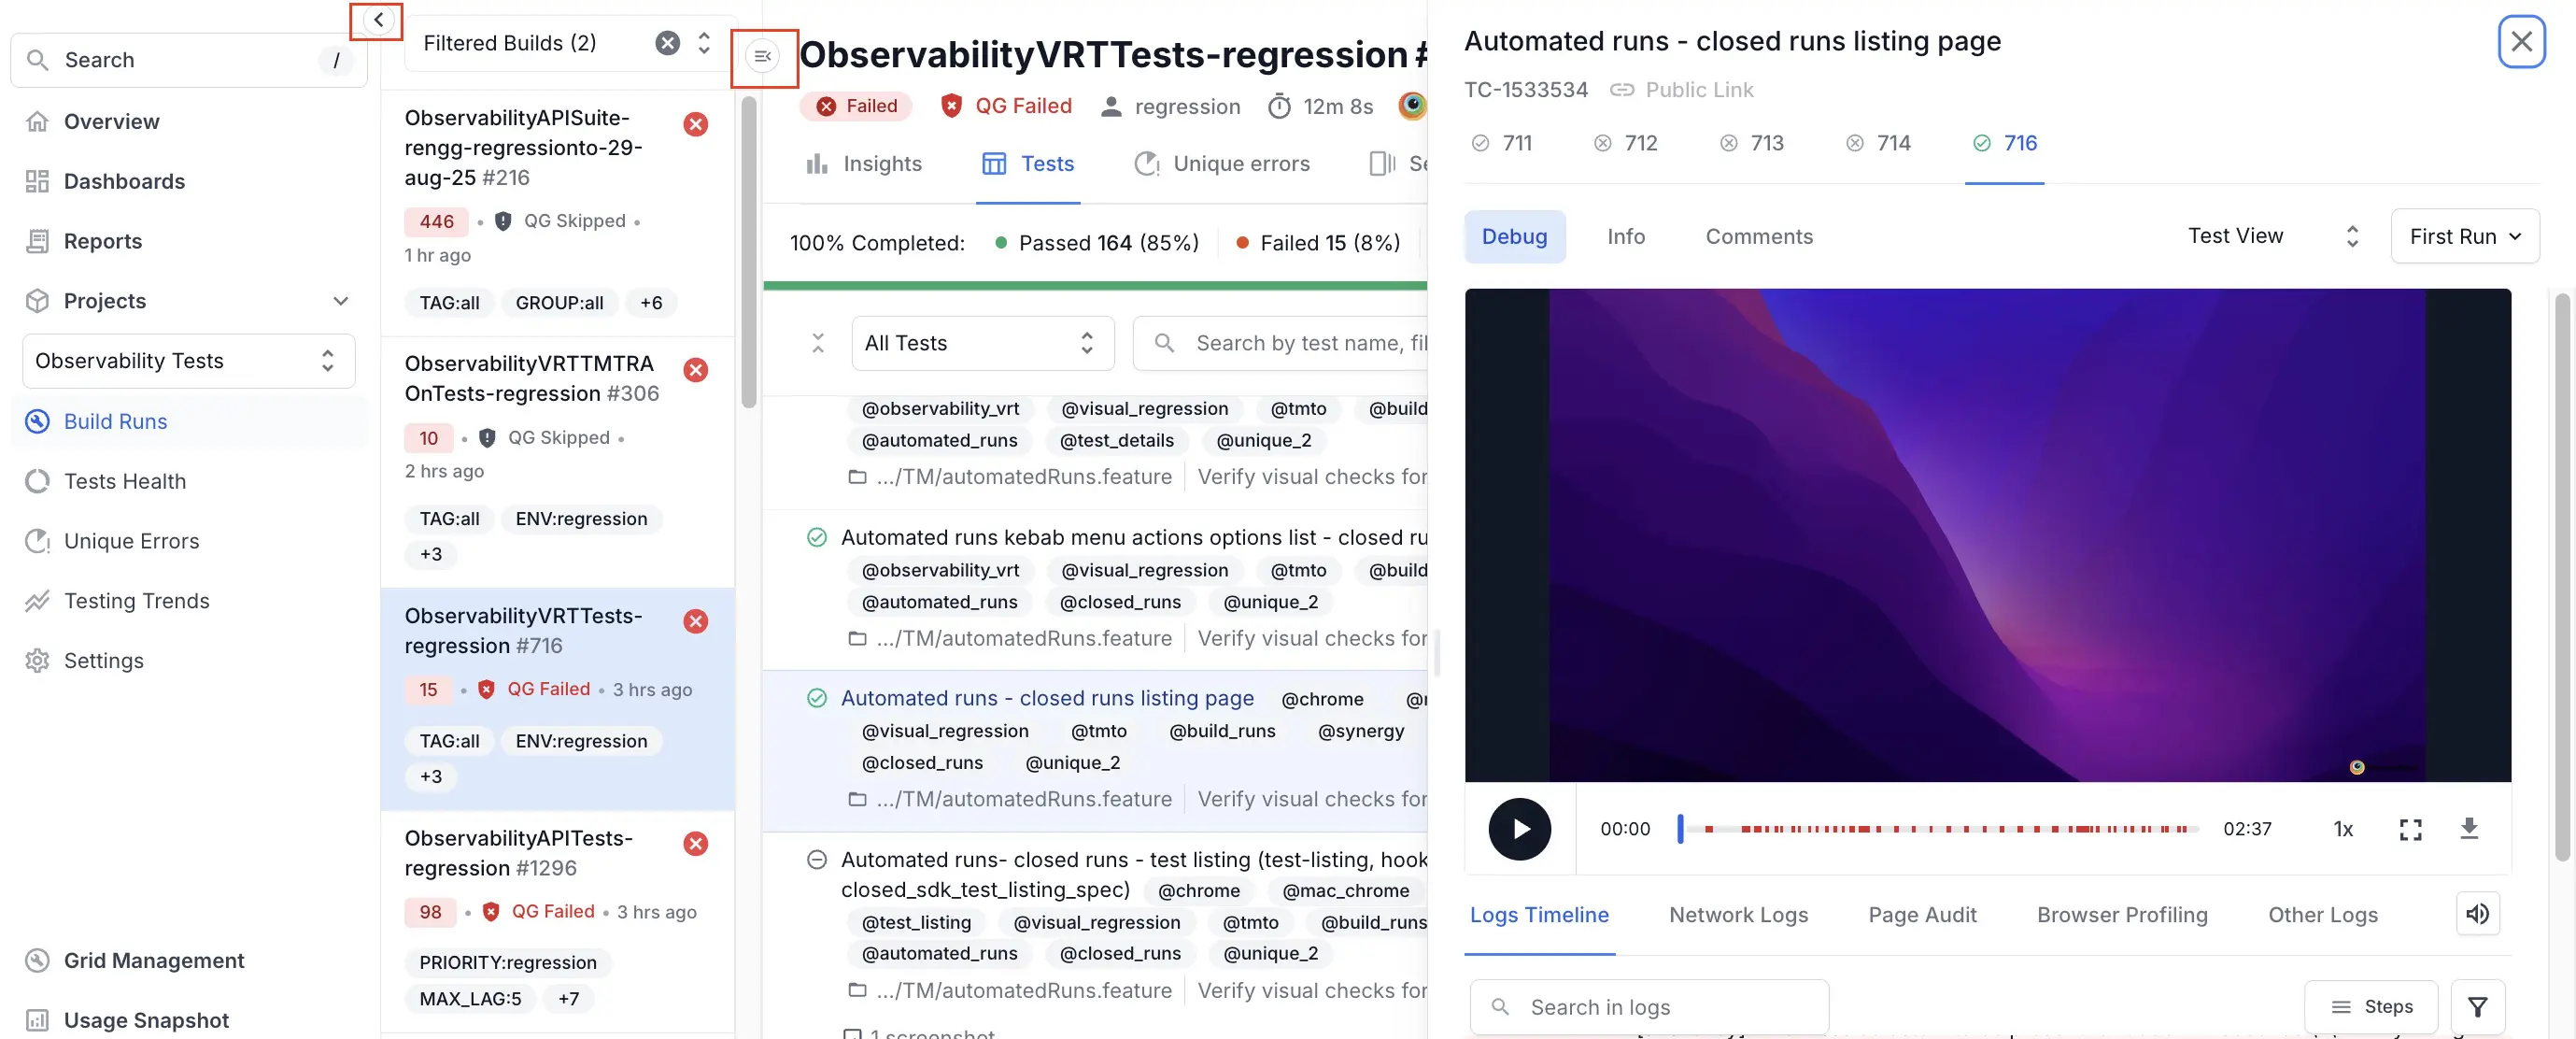 The two column layout has the following advantages:
- View logs, video, and metadata side-by-side.
- Reduce scrolling and context switching.
- Debug tests in a layout similar to the old dashboard.
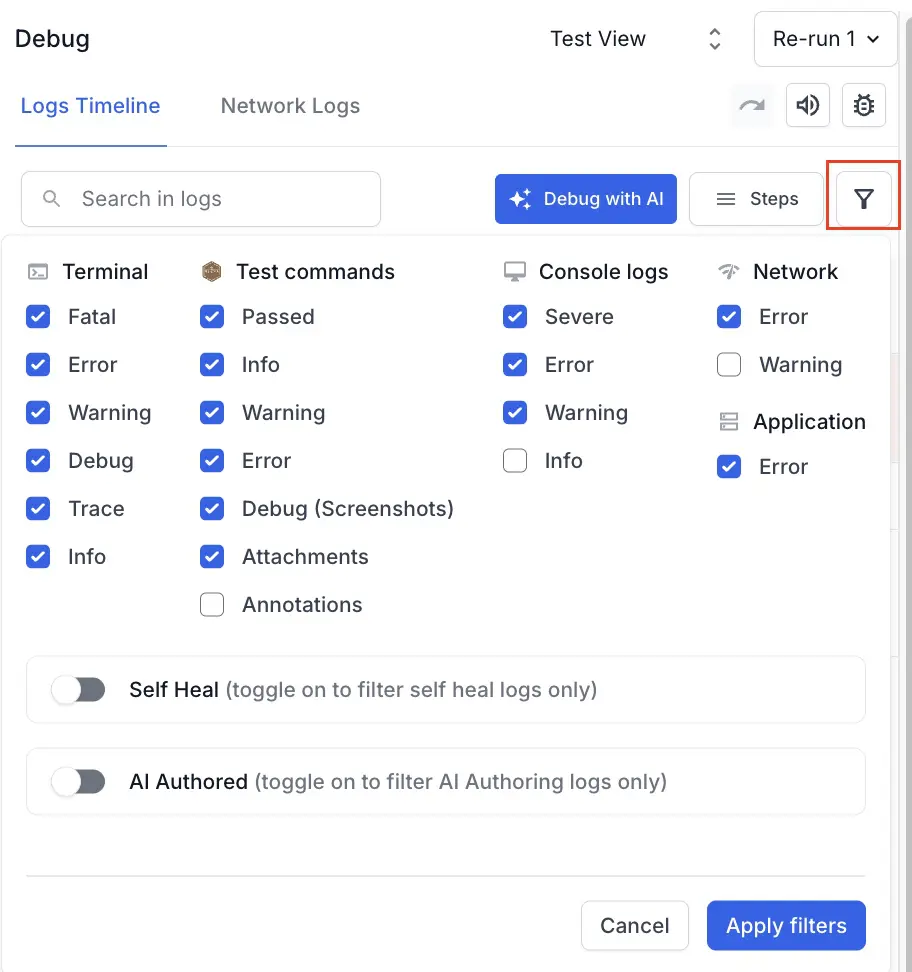
- To reduce the number of logs, click the filter icon and disable console logs or device logs.
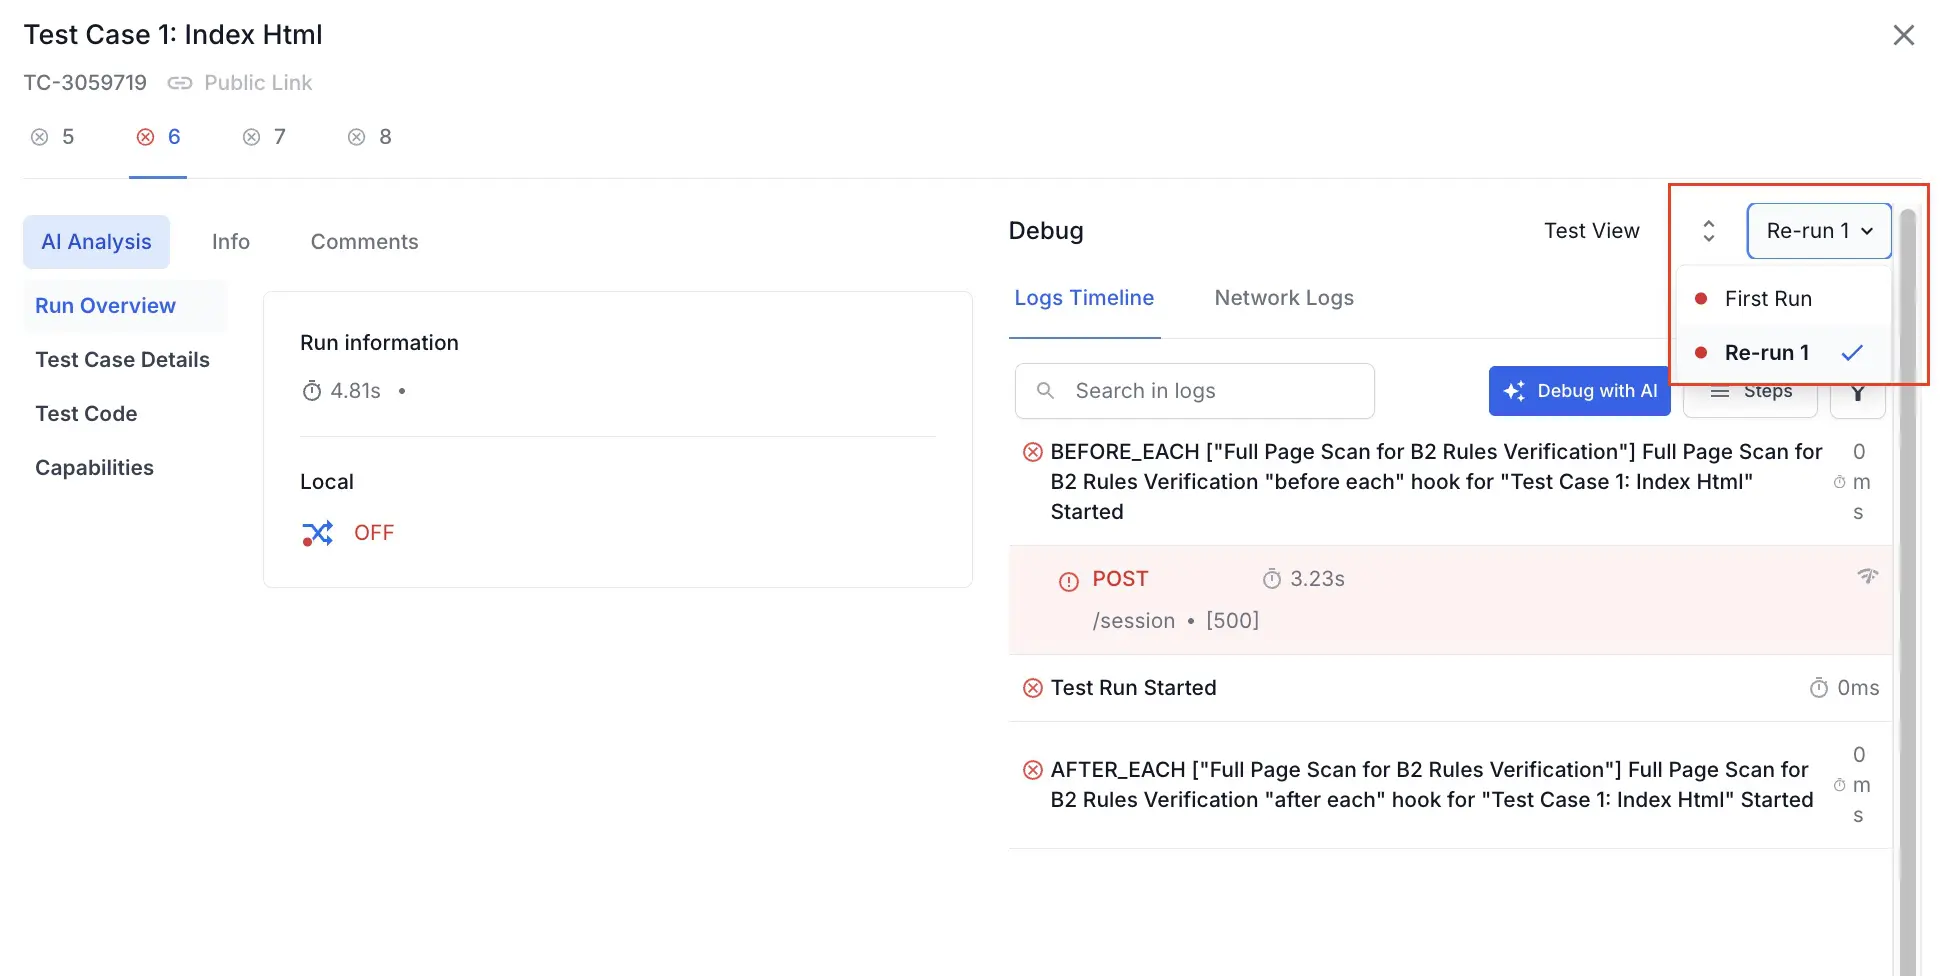
- The dashboard considers tests with the same name and platform as reruns. To view reruns, open the test, click the rerun dropdown, and click the rerun you want to open.
- To view unmerged runs, you can click the Sessions tab.
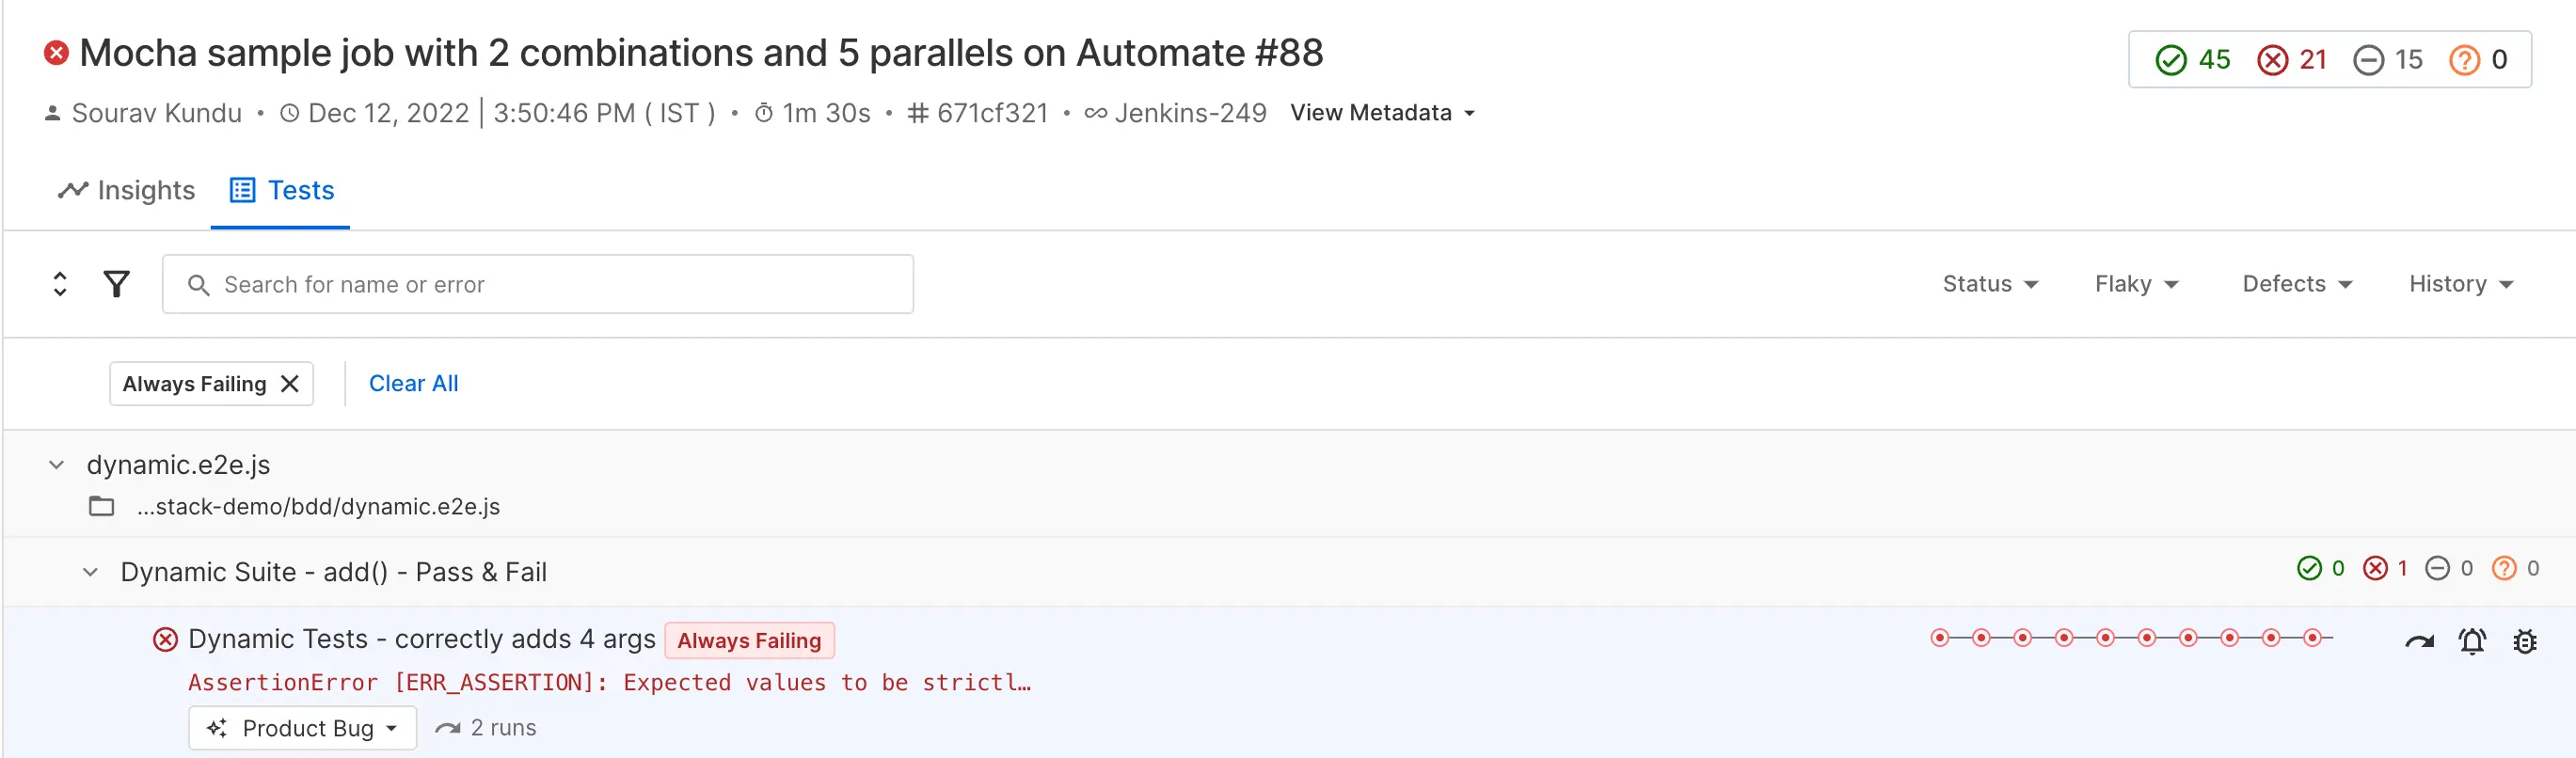
- Click Failed on the Build Runs page to filter only the failed tests. This is beneficial if you need to view only the failed tests.
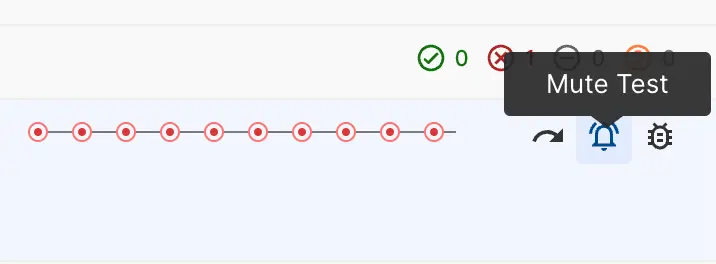
- To mute and exclude tests from build results (similar to deleting a session in the old dashboard):
- Navigate to the Test listing page within any build run.
- Hover your mouse pointer over the name of the test to see actions come up on the right-hand side (where duration shows up generally).
- Click the “mute” icon and confirm the action on the next screen.
- To set Tests as the default tab in Build Runs:
Optimize navigation
Follow these steps to optimize navigation across the new dashboard:
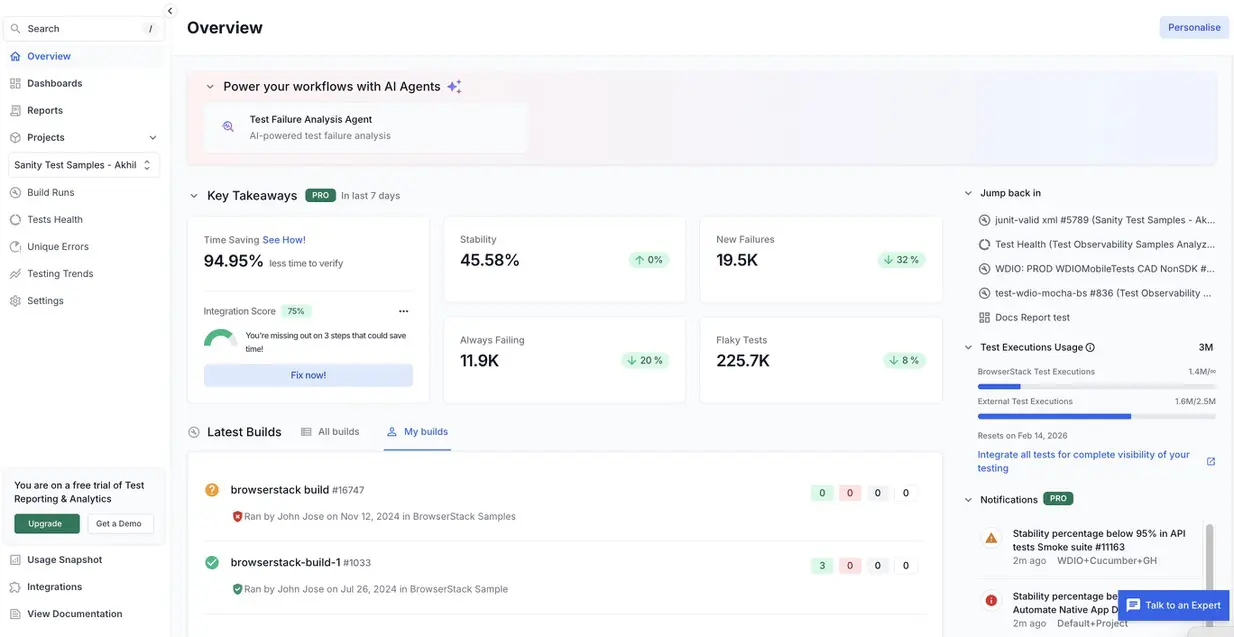
- Use Overview for recent builds across projects. The Overview page lists builds from all projects based on their date of creation with the most recent build first. You can click any build to open the Build Runs page. The Build Runs page displays all recent activity on one page, similar to the global “Recent builds” view in the old dashboard experience.
- When viewing a build, you can navigate to other builds faster using the build list sidebar.
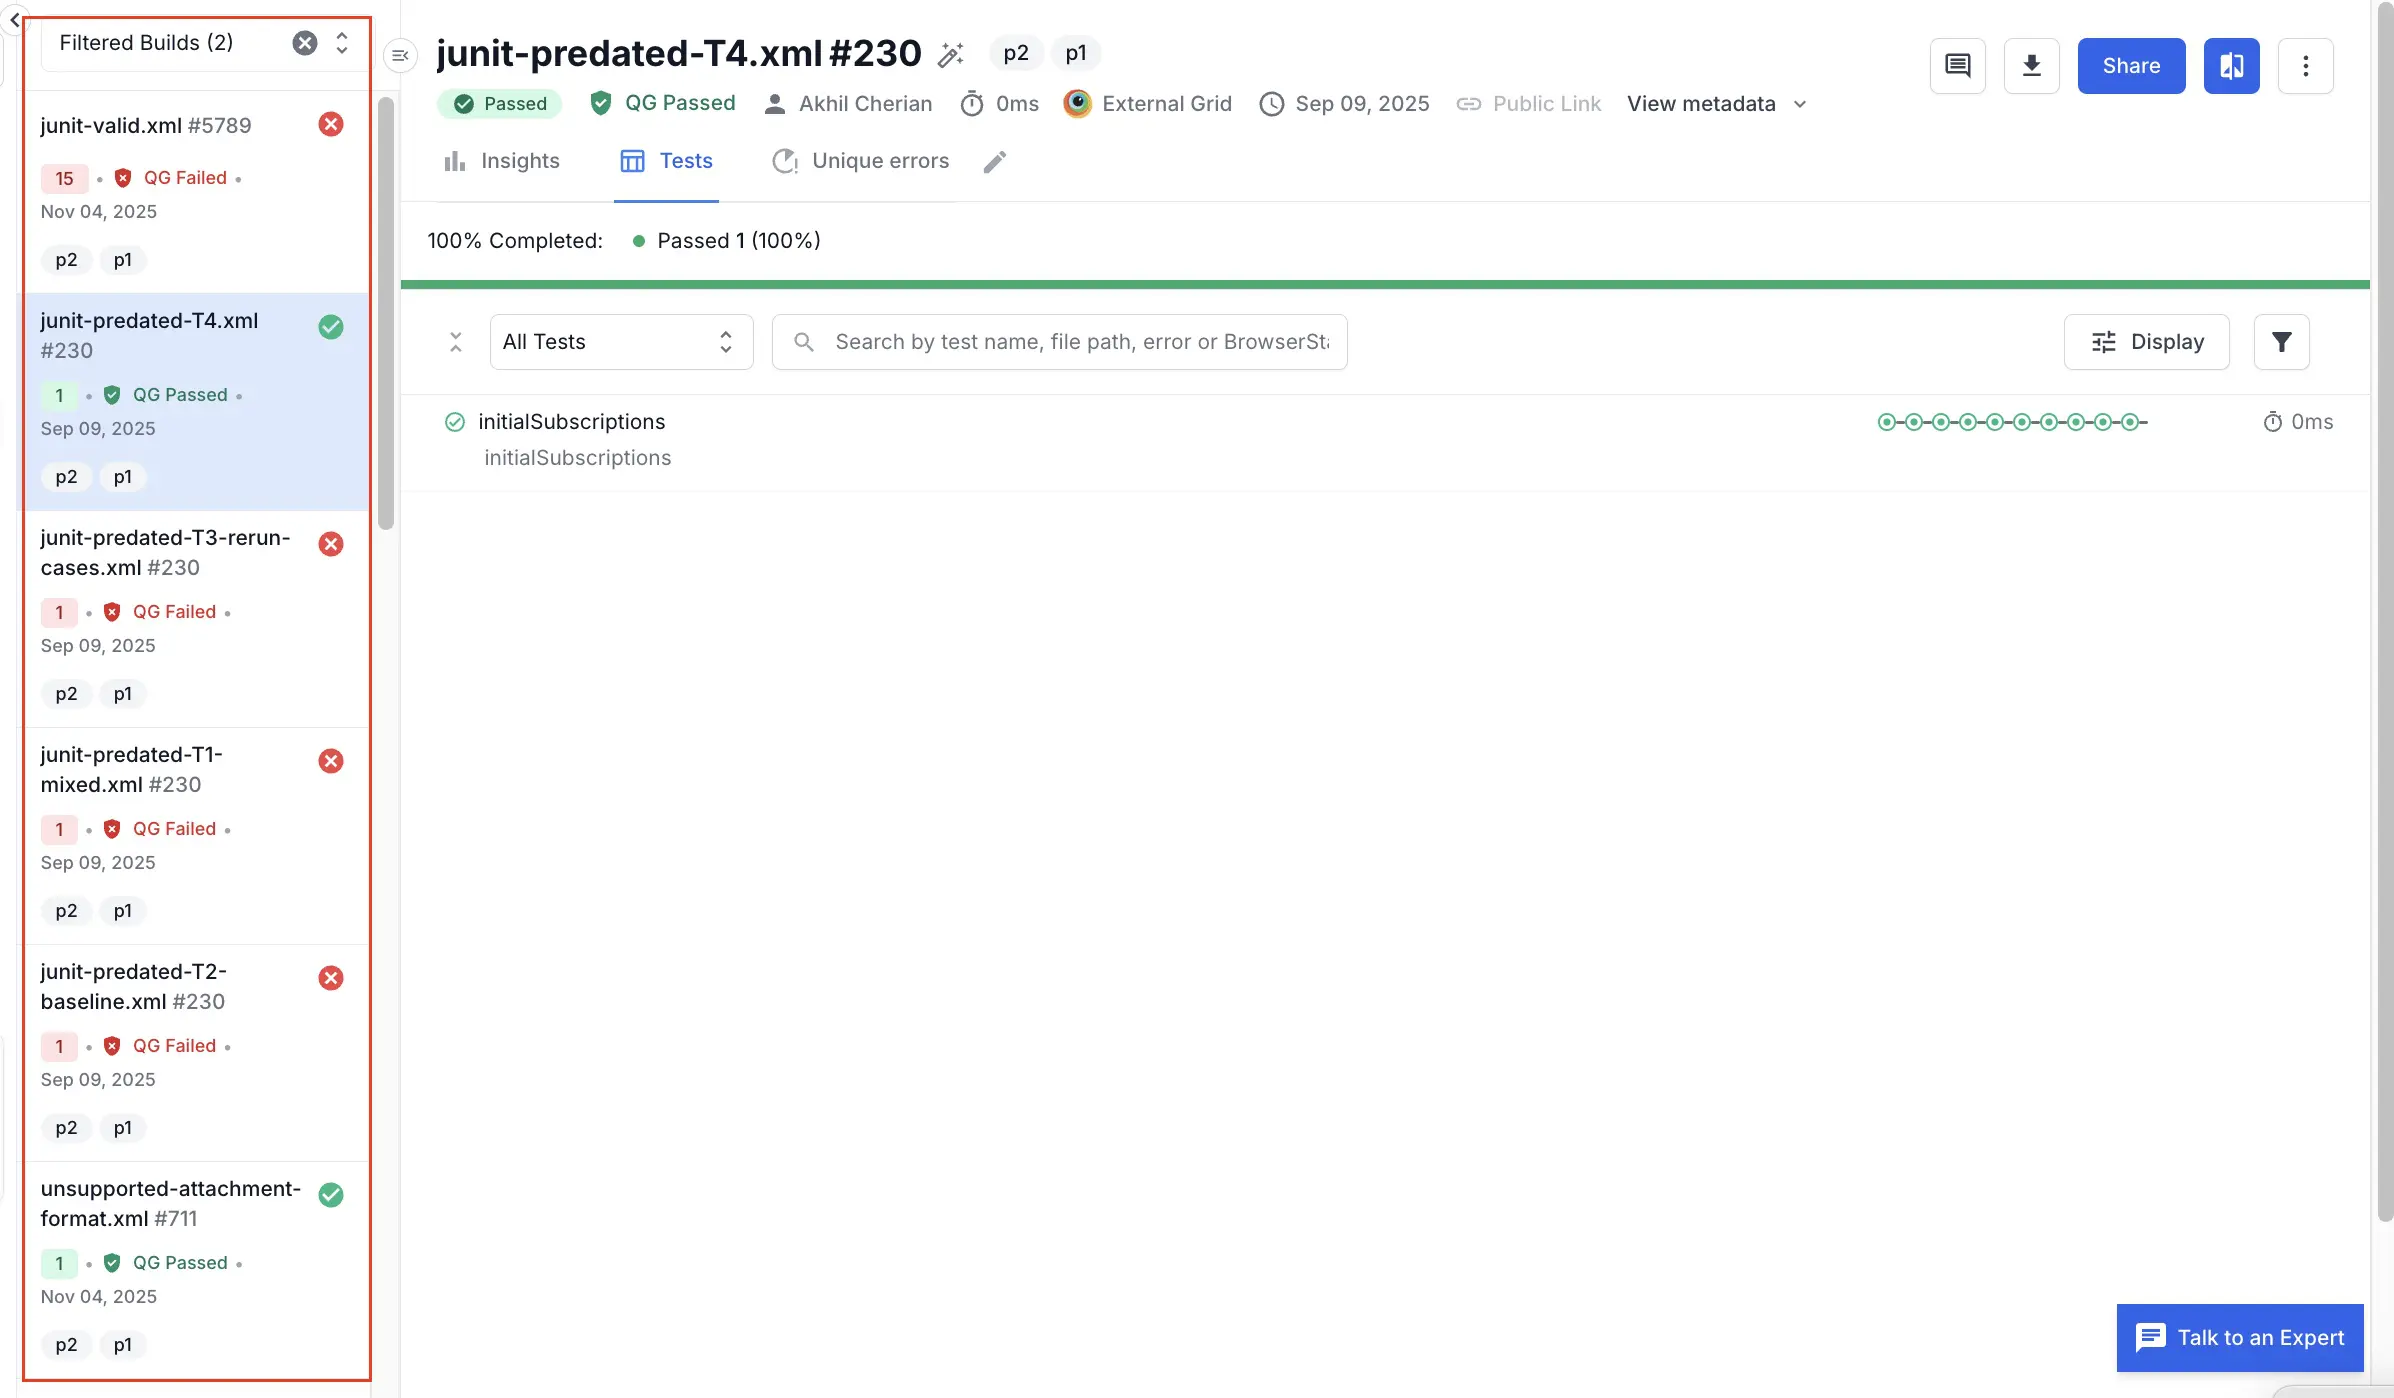
- Clear sidebar filters to view builds from multiple projects. This expands the sidebar to show builds across projects, enabling navigation between contexts without returning to a global view.
-
Personalize which builds you see on the Overview page using the following filters:
- Project
- Branch
- Status (e.g., Failed, Passed)
- Tags, environment, or other criteria (where available)
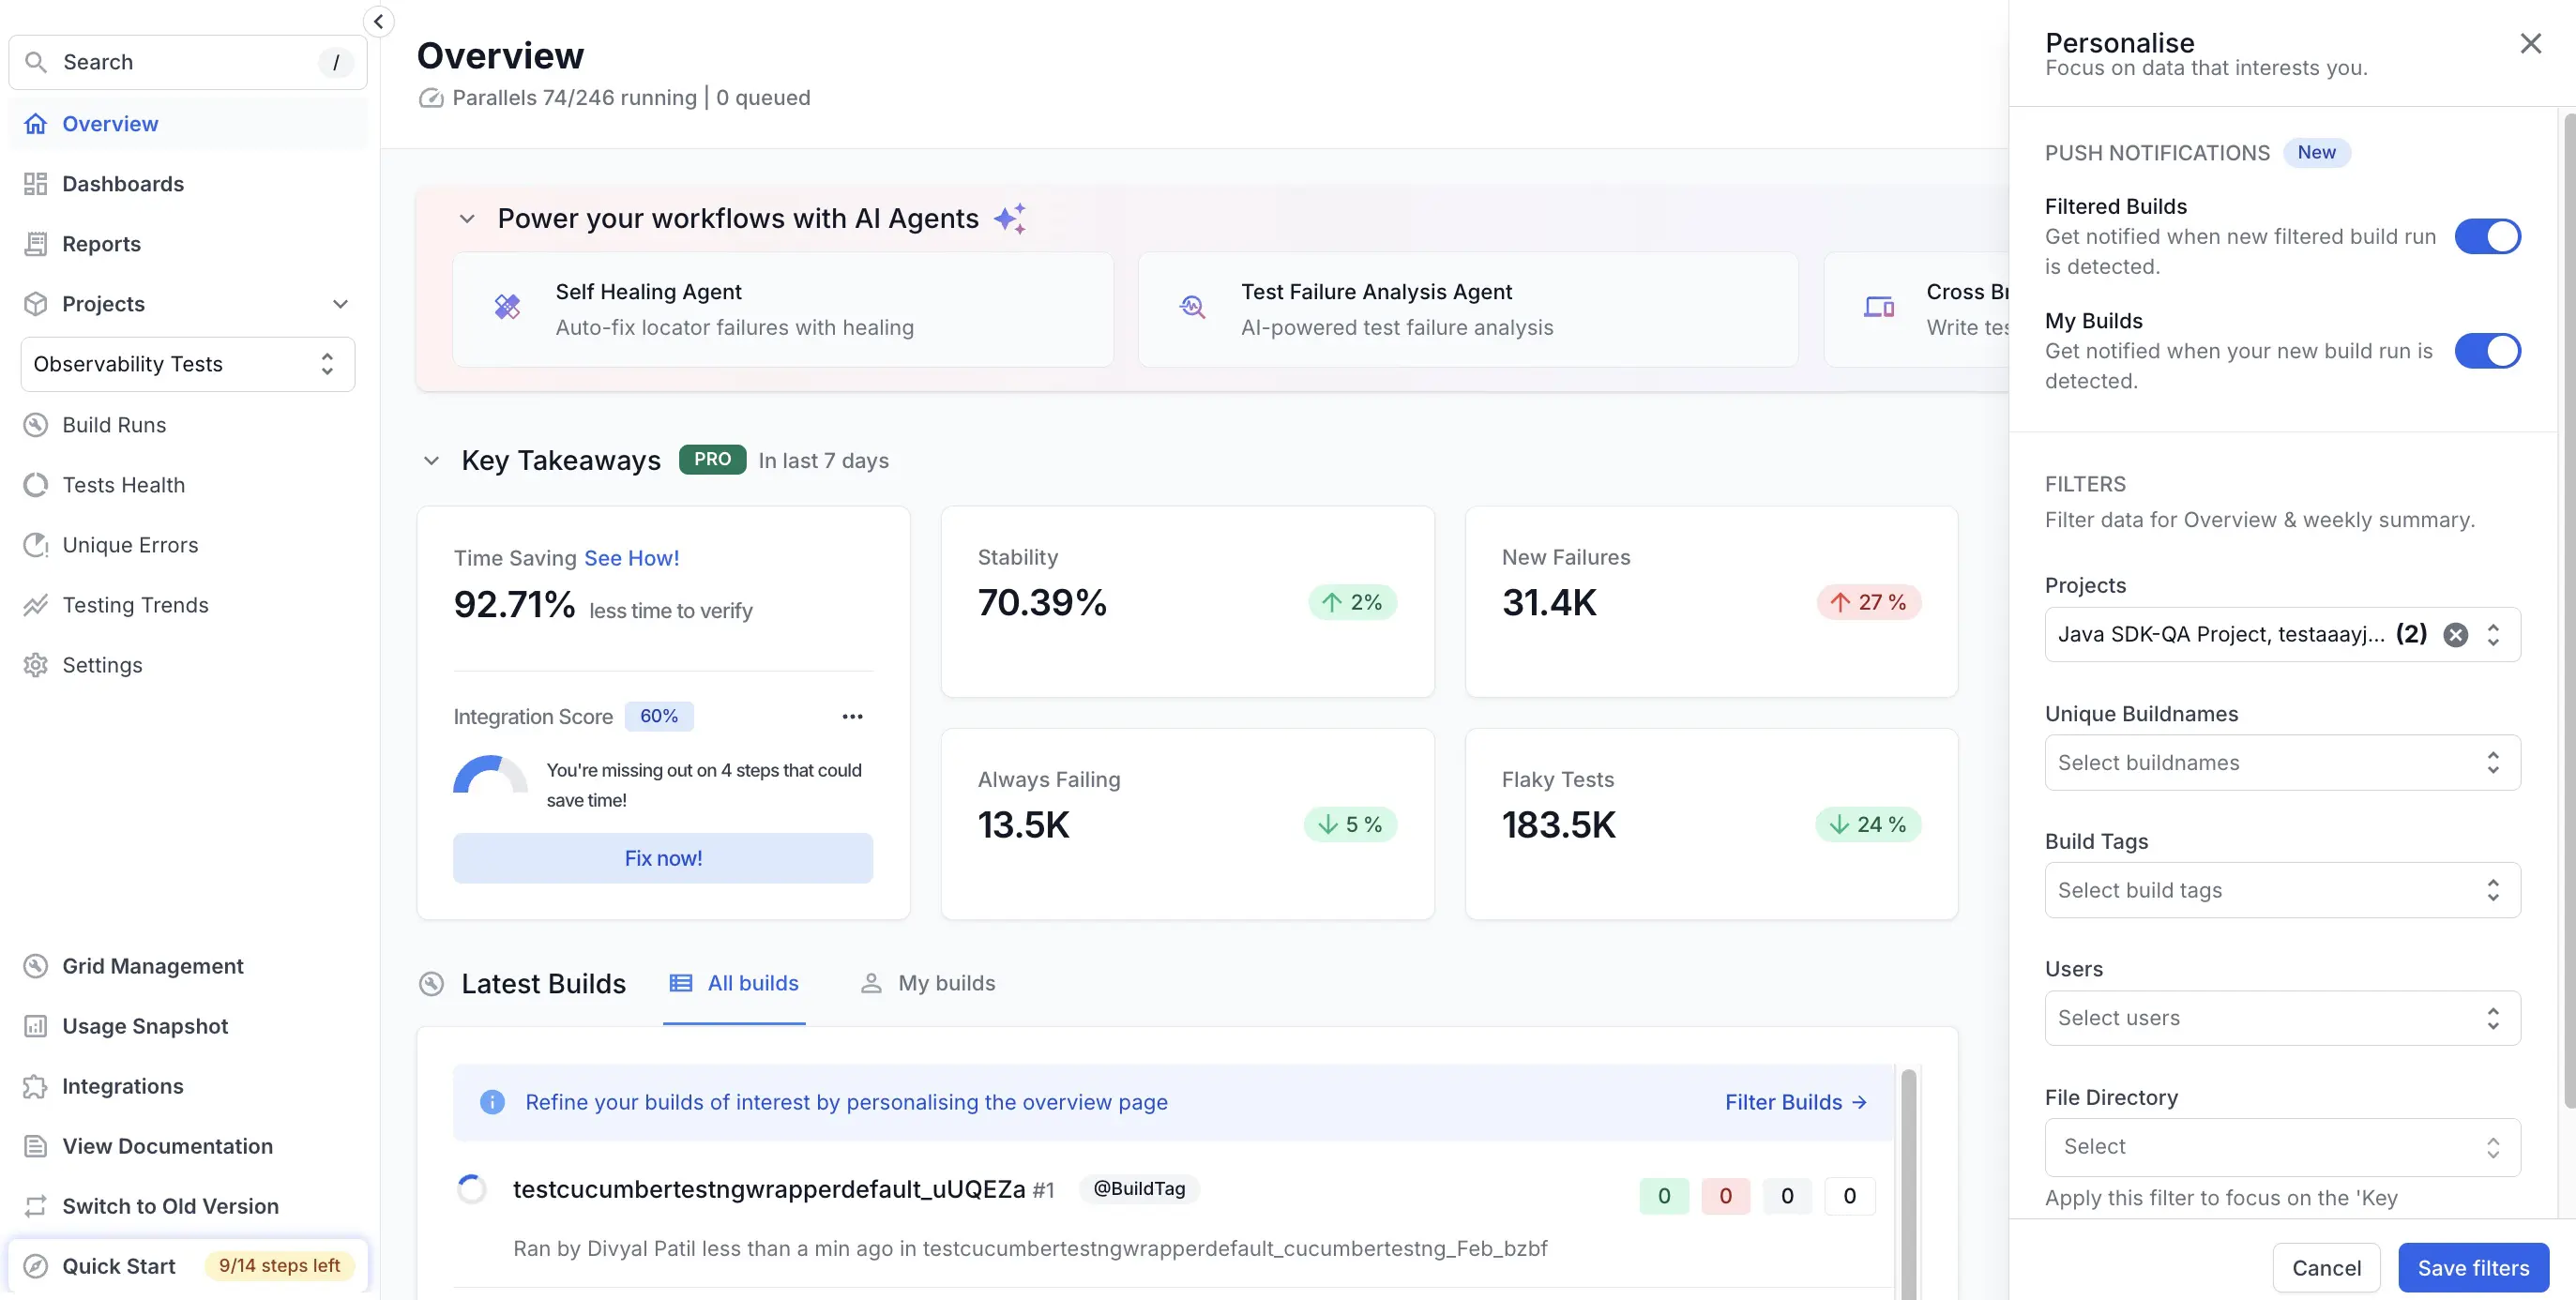
The following screenshot shows the Overview page with the personalized filters implemented: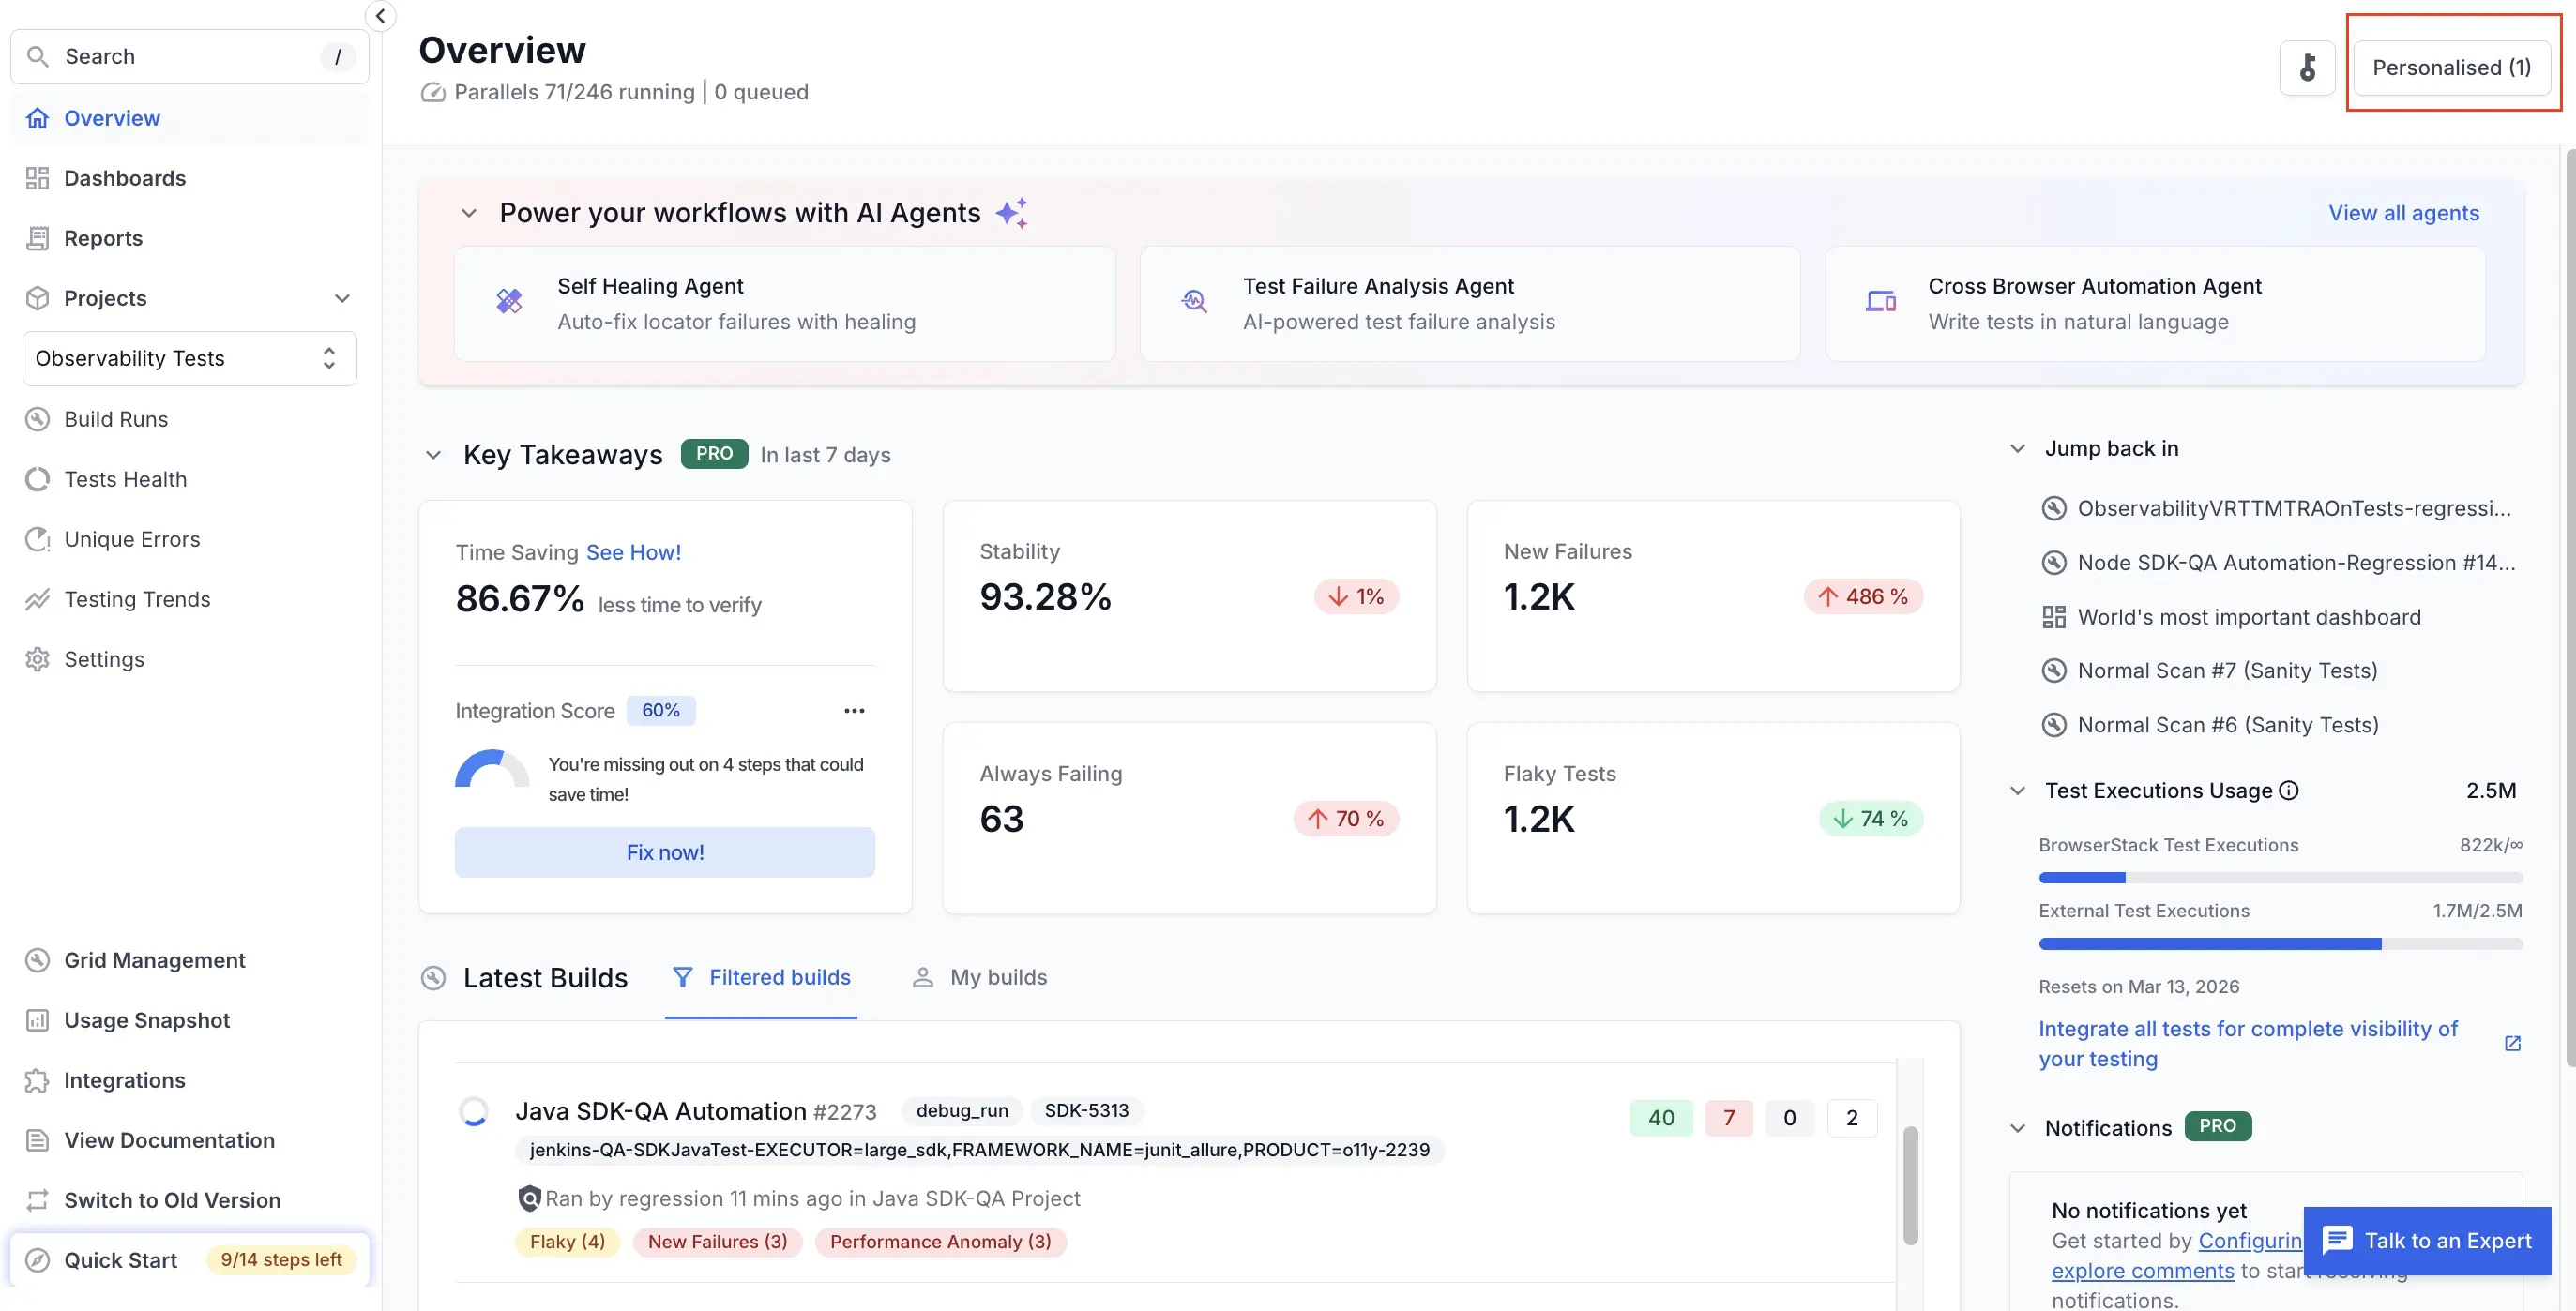
Apply advanced optimizations
Follow these steps to apply advanced optimization techniques in your new dashboard:
-
Save and reuse views: Views allow you to group and organize test-run information based on various factors such as the type of testing(regression, smoke, etc.), modules of your product, releases, date of test-run, test framework, platform used and many more. For example, if your team repeatedly checks the same information, such as “last 24 hours of failed builds on main”, you can apply filters (branch, project, status, tags, date range) on Overview or Tests. You can also save this view or bookmark the URL for future use. For more information, see Views in Test Reporting & Analytics.
- Use Smart Tags: Smart Tags help you identify issues in your test suite faster. You can customize Smart Tags with custom rules to adapt them to suit your needs.
-
Categorize tests according to failure types: Automatic Failure Analysis intelligently categorizes test failures, allowing you to quickly differentiate genuine failures from noise. For more information, see Automatic Failure Analysis.
To handle recurring failure patterns efficiently, you can: * Configure a small set of tags such as:infra,env,data-setup,flaky,known-issue. * Tag tests accordingly after investigating failures. * Use grouping by failure reason or filter by tags in: Overview, Build details, and Test listing. Such grouping helps you identify the most common failure themes in a build or timeframe and avoid re-investigating known or infrastructure-level issues. -
Compare build runs to see only the changes: You can compare build runs in detail to highlight key differences such as newly failed tests, passing tests, and changes in failure reasons. This saves time and improves accuracy. Instead of manually opening multiple builds side-by-side, you can:
- Compare the last green build vs the current red build.
- Compare previous release vs current release.
- Focus on tests that changed from Pass to Fail.
- Focus on new tests that started failing.
- Focus on tests that suddenly are taking more time than usual to complete.
- Use the new dashboard APIs
By performing these adjustments, you can configure the dashboard according to your specific needs.
View a detailed demo video
You can use the following demo as a visual guide on optimizing your dashboard experience:
We're sorry to hear that. Please share your feedback so we can do better
Contact our Support team for immediate help while we work on improving our docs.
We're continuously improving our docs. We'd love to know what you liked
We're sorry to hear that. Please share your feedback so we can do better
Contact our Support team for immediate help while we work on improving our docs.
We're continuously improving our docs. We'd love to know what you liked
Thank you for your valuable feedback!