Changes in the new App Automate dashboard view
Find out the new features and changes in the App Automate dashboard view
We’ve used your feedback to redesign one of App Automate’s key features: the new dashboard view. Read on for more about the new view’s key features, its differences from the old view, and information to make your transition to the new view easier.
What’s changed?
The new dashboard view groups key actions and information more logically, making it easier for you to debug your tests. It usually appears as a 2-column layout but is responsive to the size of your window.
Changes in the build view

1. Sidebar for builds and sessions: The sidebar has a refreshed view and enables quick real-time access to all your builds and sessions. The meta-information such as number of sessions, status of sessions, and project name gives useful information at a glance.
2. Build and session filters: You can now filter builds and session by user, project, status, team, and framework. As you apply filters, the dashboard URL also changes, enabling you to share filtered views with other team members easily.
3. Build name and actions: This bar shows the build name, project names and makes actions such as delete and contact support easily accessible.
4. Build overview: The build overview is now available in a two-column layout rather than the earlier one-column layout. The new layout gives expanded space for session details.
5. REST API Status: You would notice two different statuses for sessions: BrowserStack status and REST API status. The REST API status (passed, failed, or unmarked) denotes the session status you mark using the REST API. The BrowserStack status represents the session status (running, error, timed out, or completed) on the App Automate infrastructure. The two different statuses help you quickly identify the reason for test failures.
6. Build level search and filters: You can find sessions in a build using build-level search and filter options. You can search for a session by its name or ID, and you can filter sessions by OS version, device, and status.
7. Search across projects, builds, and sessions: This (the top-level) search bar is accessible from all the dashboard pages. You can search for projects, builds, and sessions by their name or IDs.
8. Parallel threads: The total number of running & queued sessions is available at the top.
Changes in the session view
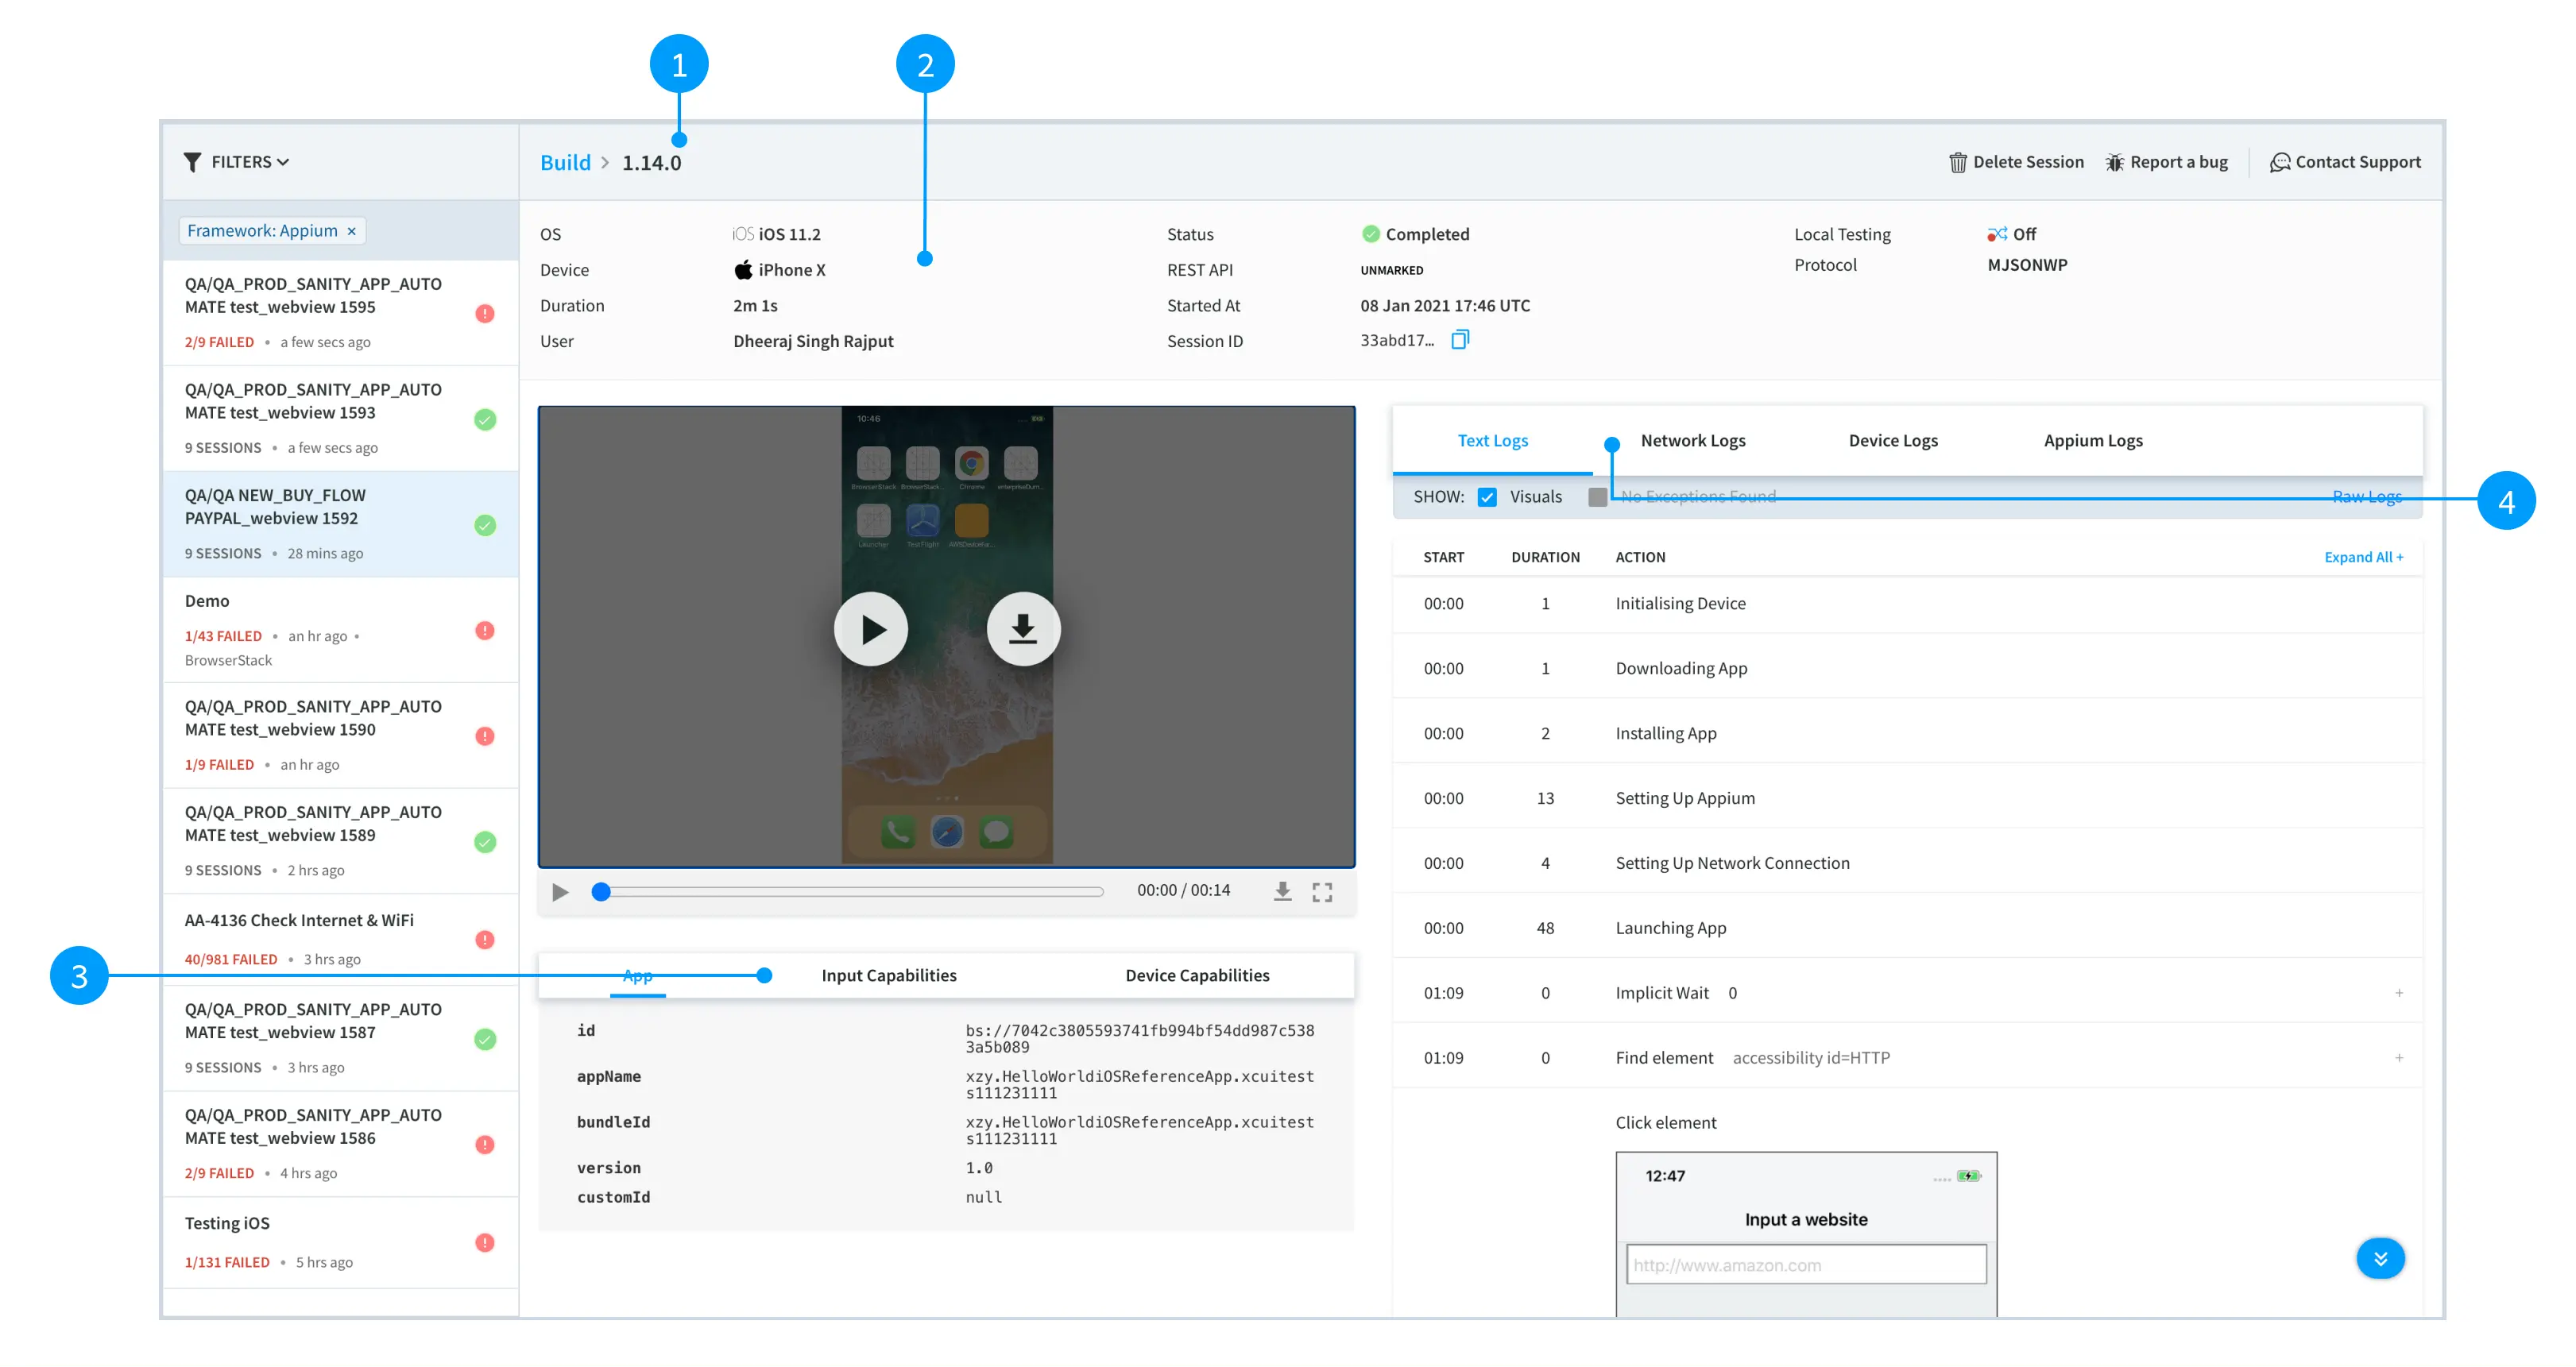
1. Session name and actions: This bar shows the session name and makes actions such as delete, contact support, and report a bug easily accessible.
2. Session meta: The session meta is now available in a two or three-column layout (based on your screen size) from the earlier one-column layout. The new layout gives more vertical space and enables side-by-side viewing of video and logs.
3. App, Input Capabilities and Device Capabilities: App details, Input capabilities and device capabilities are visible by default and formatted for better viewing. You can use browser find (CTRL+F or CMD+F) to search inside this section.
4. Session logs This section provides easy access to view and download test execution logs including text logs, screenshots, device logs, appium logs, network logs.
The new dashboard view groups key actions and information more logically, making it easier for you to debug your tests. It usually appears as a 2-column layout but is responsive to the size of your window. The view is enhanced for builds with large test-suites as well as builds using the test sharding feature.
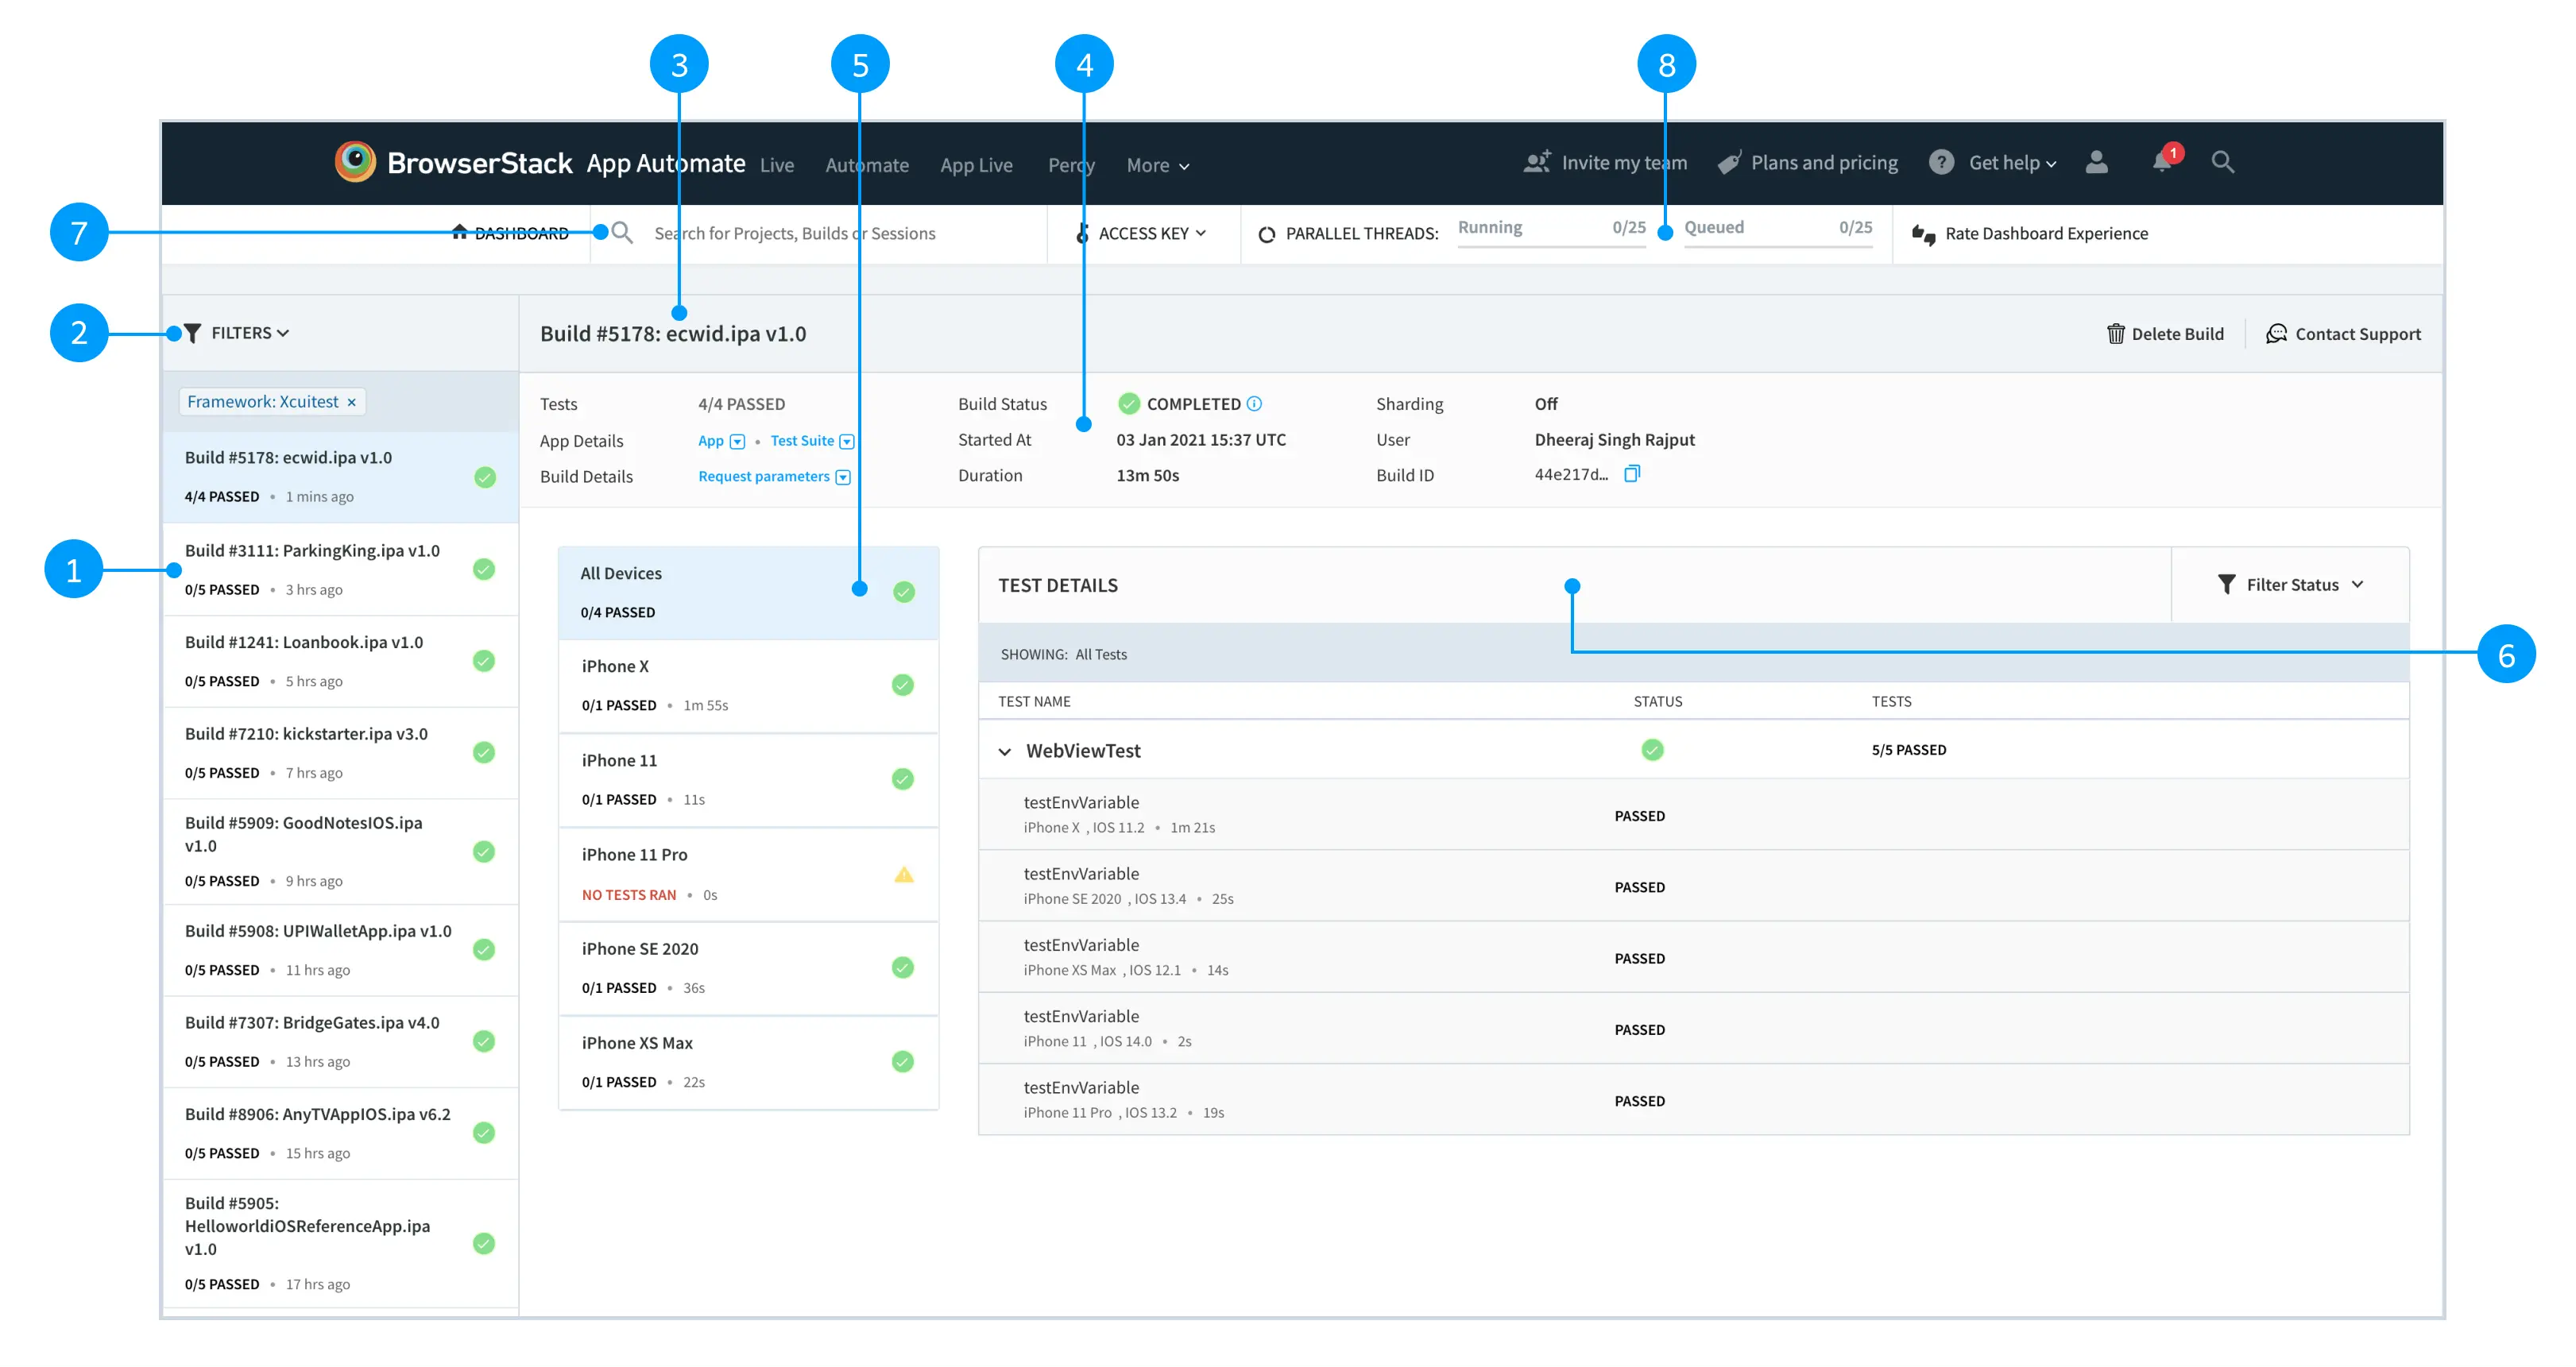
Changes in the build view

1. Sidebar for builds: The sidebar has a refreshed view and enables quick real-time access to all your builds. The meta-information such as number of tests, status of tests, and project name gives useful information at a glance.
2. Build filters: You can now filter builds by user, project, status, team, and framework. As you apply filters, the dashboard URL also changes, enabling you to share filtered views with other team members easily.
3. Build name and actions: This bar shows the build name, project names and makes actions such as delete and contact support easily accessible.
4. Build overview: The build overview is now available in a three-column layout rather than the earlier one-column layout. The new layout gives expanded space for test execution details.
5. Device sidebar: You can quickly glance results at a build level (default view) or device level. The build level view enables you to compare the execution of a given test across all devices. Switch to device level view to debug tests on the a given device. If test sharding is enabled, the device level view also gives you more visibility into the test results at a shard level.
6. Test results: You can access test results grouped by class names in a build and filter tests by its execution status. This is particularly useful for large test-suites.
7. Search across projects, builds, and tests: This (the top-level) search bar is accessible from all the dashboard pages. You can search for projects, builds, and tests by their name or IDs.
8. Parallel threads: The total number of running & queued devices for build execution is available at the top.
Changes in the session view
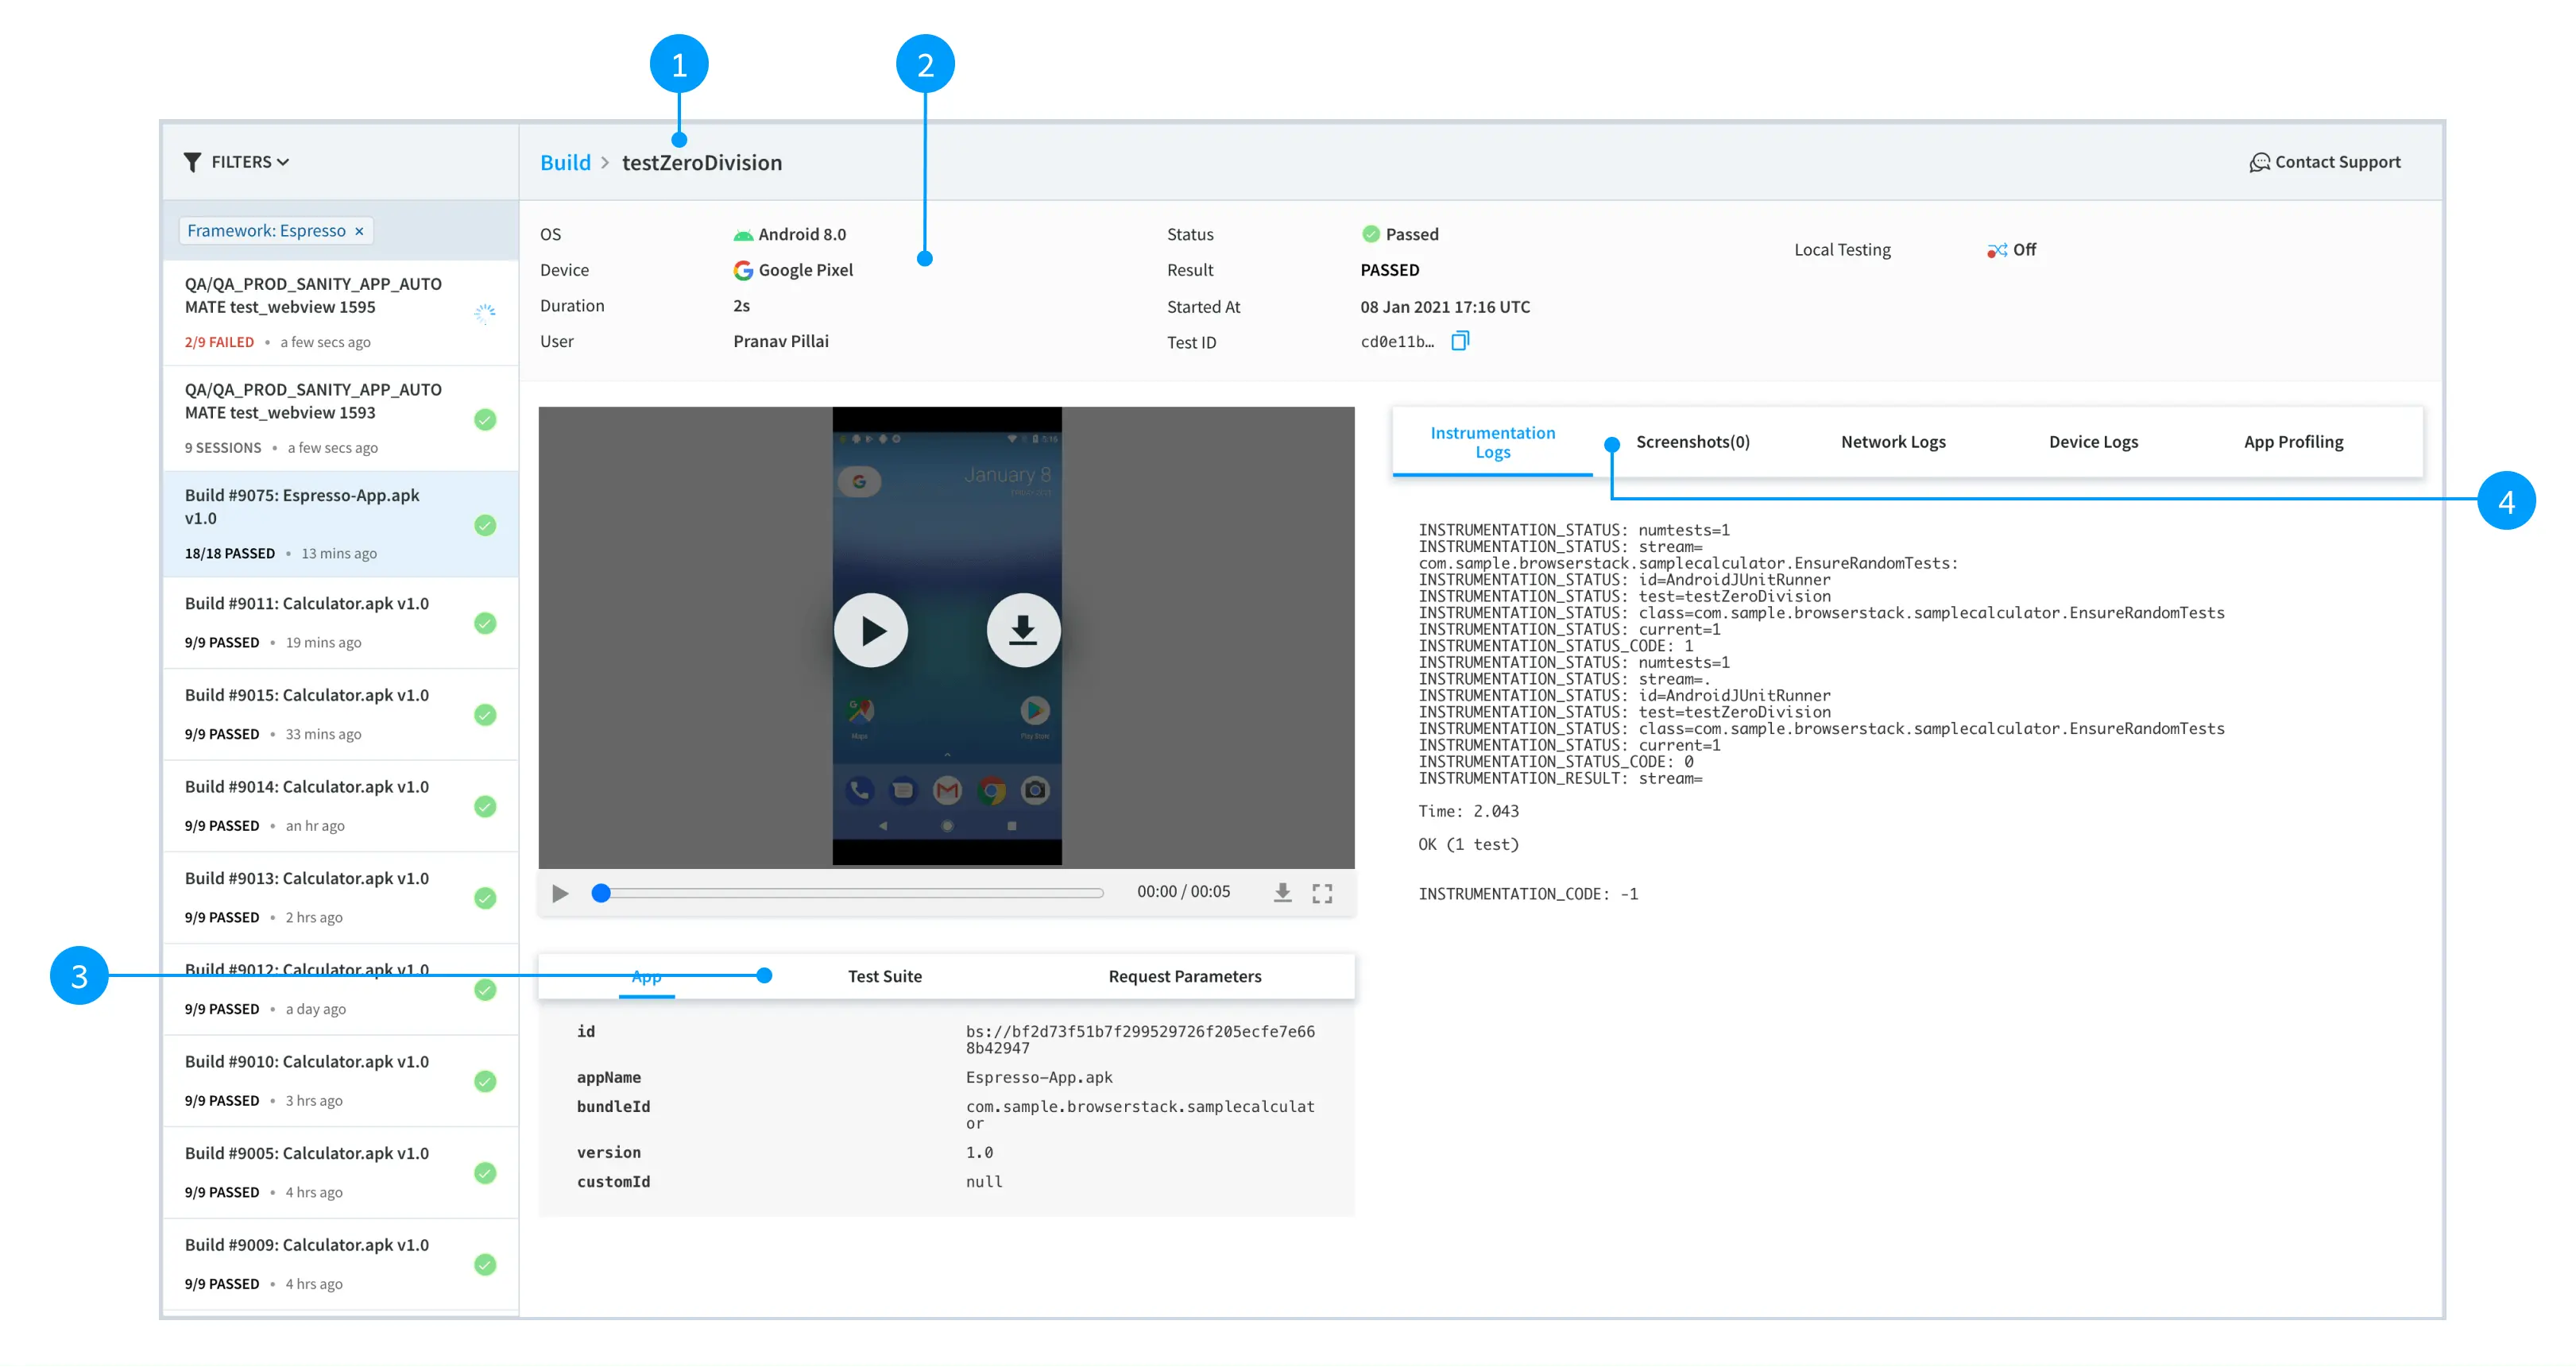
1. Test name and actions: This bar shows the test name and provides easy access to contact support for any technical issues.
2. Test meta: The test meta is now available in a two or three-column layout (based on your screen size) from the earlier one-column layout. The new layout gives more vertical space and enables side-by-side viewing of video and logs.
3. App, Test-suite and Build parameters: App details (Application under test), Test-suite details and Build request parameters are visible by default and formatted for better viewing. You can use browser find (CTRL+F or CMD+F) to search inside this section.
4. Test logs This section provides easy access to view and download test execution logs including instrumentation log, screenshots, device logs, network logs and so on.
The new dashboard view groups key actions and information more logically, making it easier for you to debug your tests. It usually appears as a 2-column layout but is responsive to the size of your window. The view is enhanced for builds with large test-suites as well as builds using the test sharding feature.
Changes in the build view
1. Sidebar for builds: The sidebar has a refreshed view and enables quick real-time access to all your builds. The meta-information such as number of tests, status of tests, and project name gives useful information at a glance.
2. Build filters: You can now filter builds by user, project, status, team, and framework. As you apply filters, the dashboard URL also changes, enabling you to share filtered views with other team members easily.
3. Build name and actions: This bar shows the build name, project names and makes actions such as delete and contact support easily accessible.
4. Build overview: The build overview is now available in a three-column layout rather than the earlier one-column layout. The new layout gives expanded space for test execution details.
5. Device sidebar: You can quickly glance results at a build level (default view) or device level. The build level view enables you to compare the execution of a given test across all devices. Switch to device level view to debug tests on the a given device. If test sharding is enabled, the device level view also gives you more visibility into the test results at a shard level.
6. Test results: You can access test results grouped by class names in a build and filter tests by its execution status. This is particularly useful for large test-suites.
7. Search across projects, builds, and tests: This (the top-level) search bar is accessible from all the dashboard pages. You can search for projects, builds, and tests by their name or IDs.
8. Parallel threads: The total number of running & queued devices for build execution is available at the top.
Changes in the session view
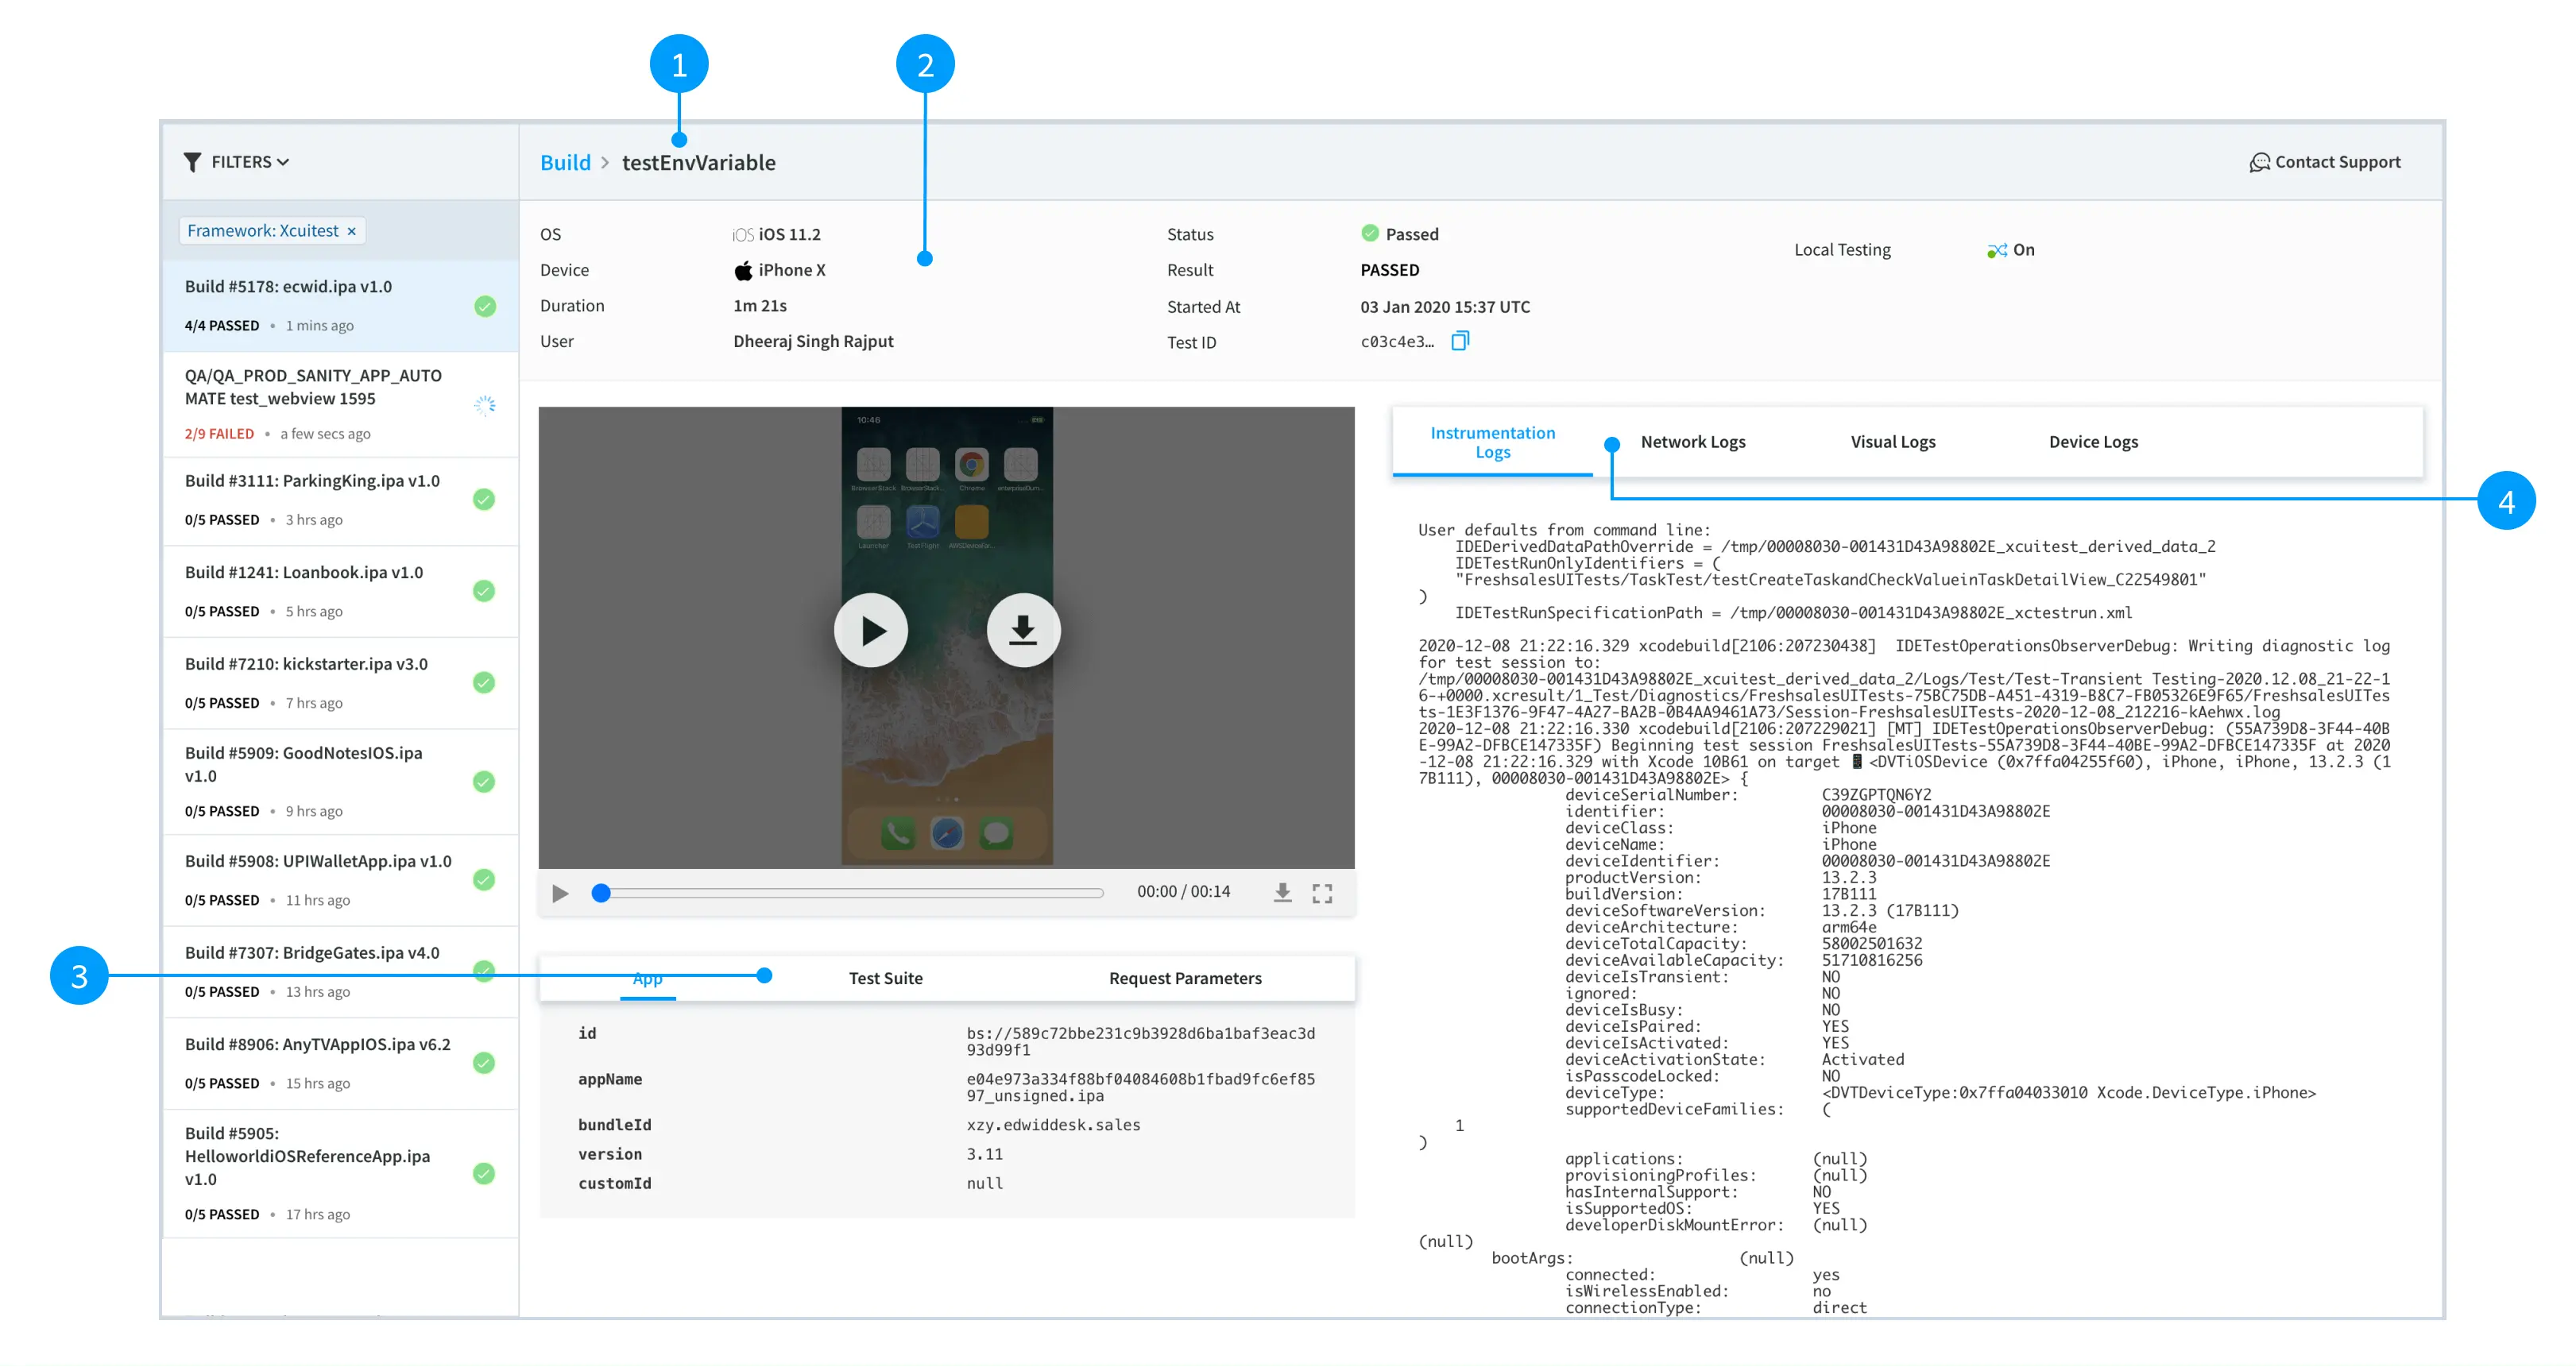
1. Test name and actions: This bar shows the test name and provides easy access to contact support for any technical issues.
2. Test meta: The test meta is now available in a two or three-column layout (based on your screen size) from the earlier one-column layout. The new layout gives more vertical space and enables side-by-side viewing of video and logs.
3. App, Test-suite and Build parameters: App details (Application under test), Test-suite details and Build request parameters are visible by default and formatted for better viewing. You can use browser find (CTRL+F or CMD+F) to search inside this section.
4. Test logs This section provides easy access to view and download test execution logs including instrumentation log, screenshots, device logs, network logs and so on.
Upcoming features
We are actively working towards improving your overall experience and have planned some exciting new features. Few of these are:
Customizable sidebar:
We understand that each developer has their own way of developing and debugging applications. Some devs like a more compact view of the dashboard, while others prefer a spaced-out version. You would soon be able to customize your sidebar experience on the dashboard.
Improved text logs (Appium):
Working with verbose text logs on the dashboard can be difficult. A large log file may take time to load and a few of the log lines may have a long Javascript snippet that makes reading and scrolling the logs difficult. Hence, we are working to improve the overall usability of text logs on the App Automate dashboard.
Frequently asked questions (FAQ)
How can I try out the new view?
You can try out the new dashboard. Trying out the new view will not revoke your access to the old view.
Where should I go if I have feedback, questions, or concerns?
To give us feedback, open the dashboard, and click on the Give Feedback button on the header. For any question or concern, you can anytime reach out to our Support team. We would make sure to get back to you as soon as possible.
We're sorry to hear that. Please share your feedback so we can do better
Contact our Support team for immediate help while we work on improving our docs.
We're continuously improving our docs. We'd love to know what you liked
We're sorry to hear that. Please share your feedback so we can do better
Contact our Support team for immediate help while we work on improving our docs.
We're continuously improving our docs. We'd love to know what you liked
Thank you for your valuable feedback!