Web performance testing using Lighthouse
Learn to measure and enhance the user experience of your web pages by seamlessly integrating Lighthouse into your Playwright tests.
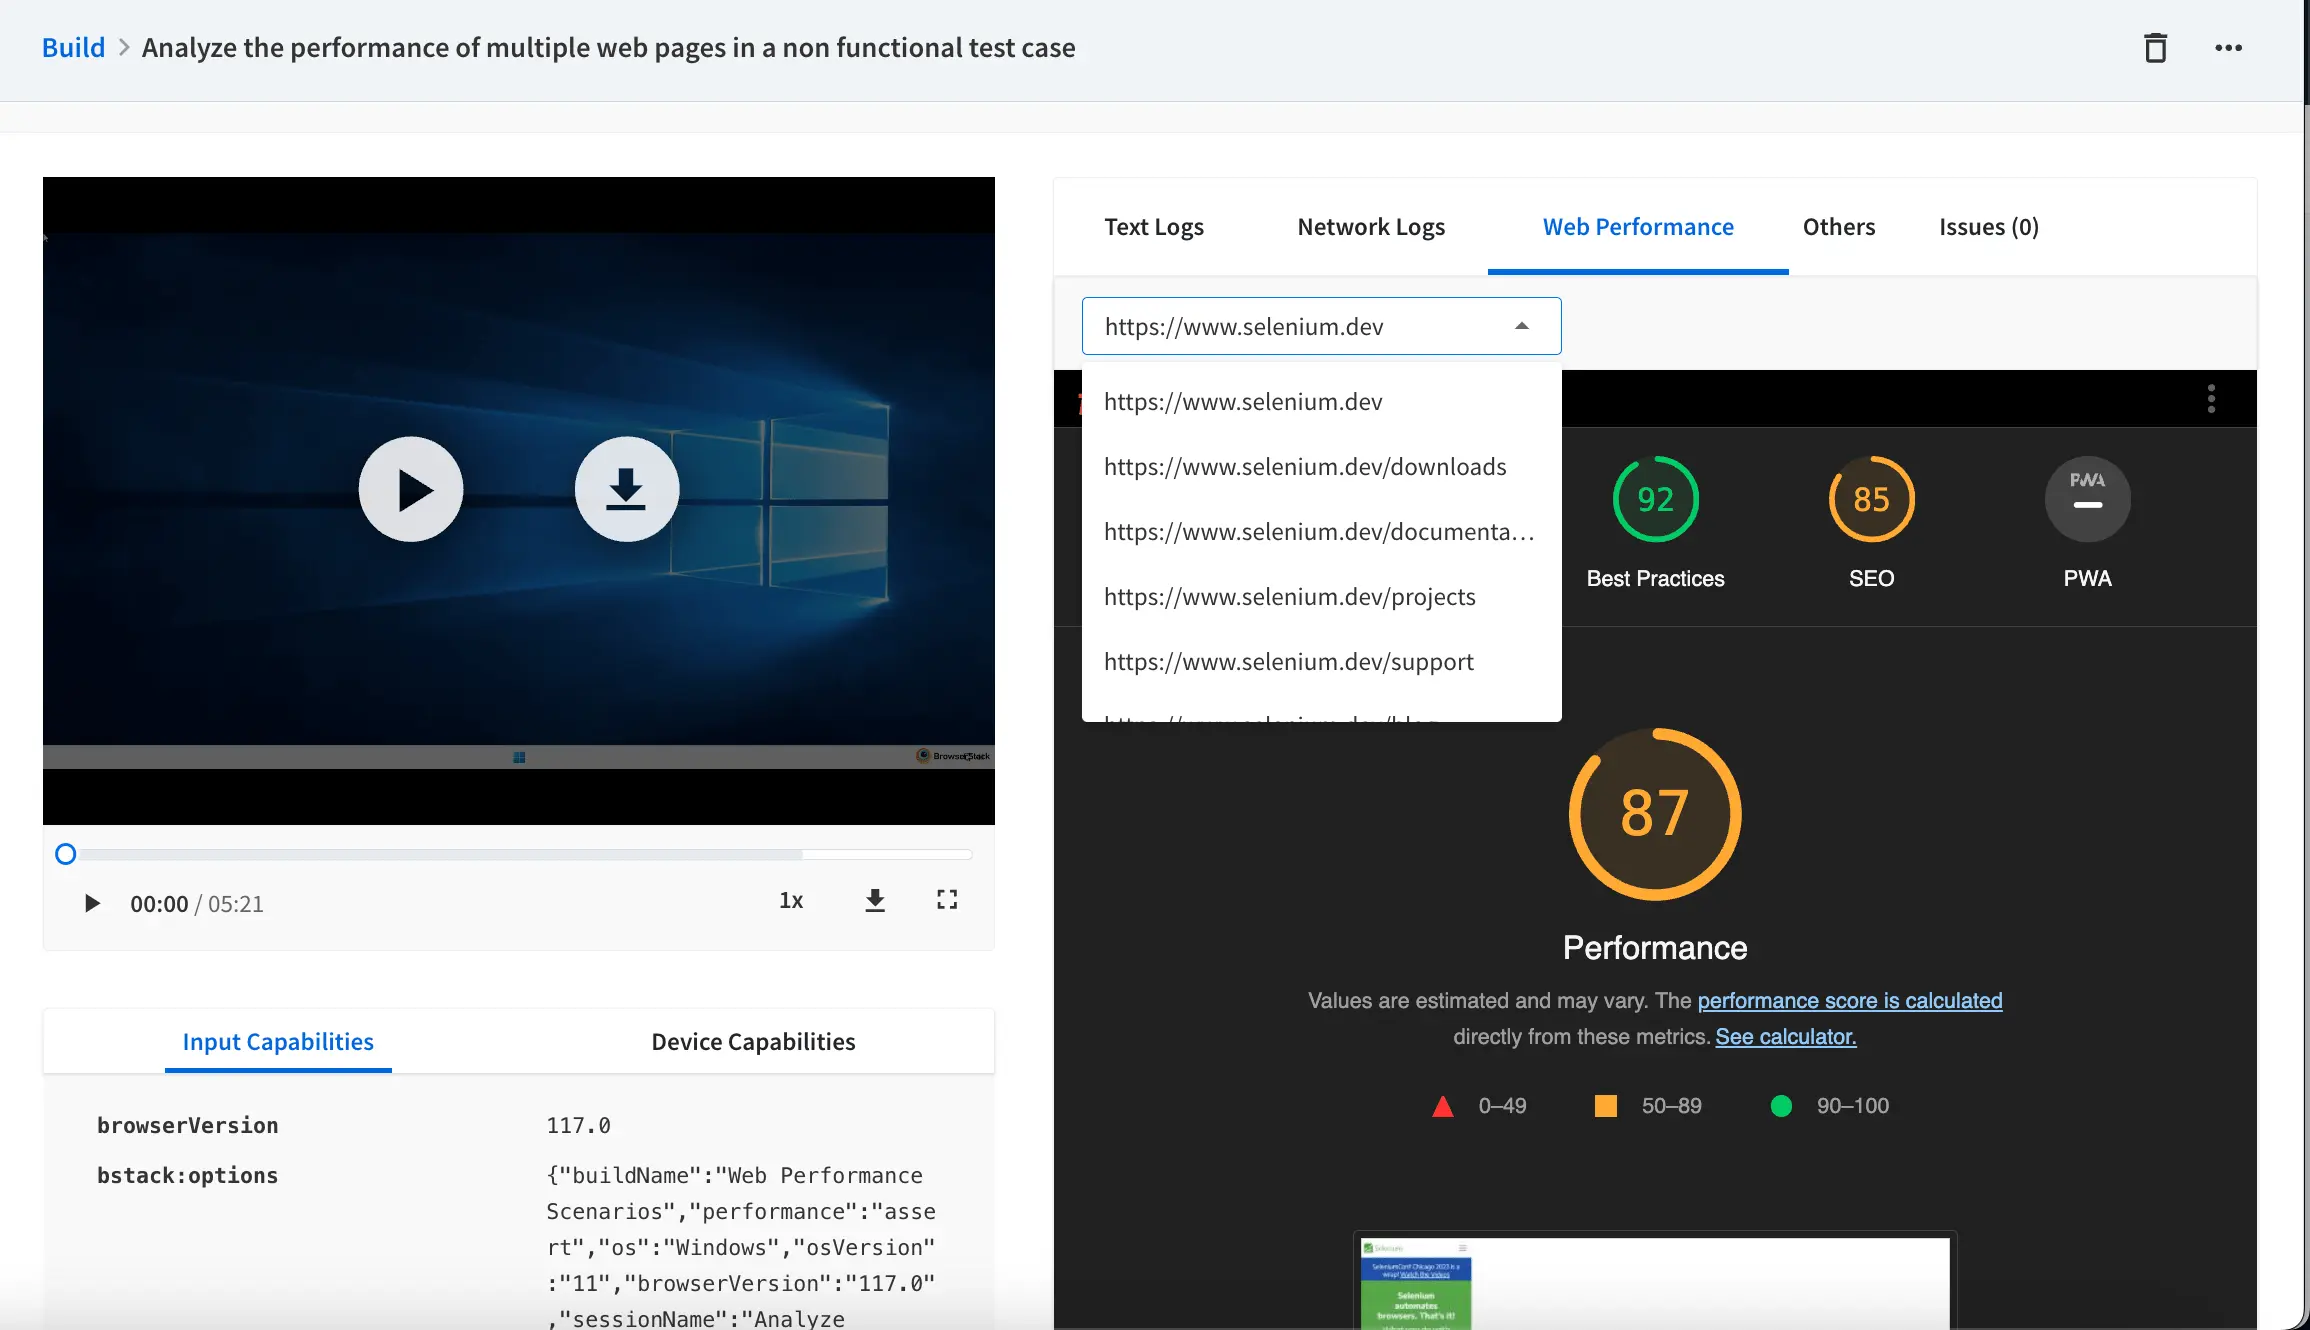
Google Lighthouse runs a series of audits on your web pages and provides the results across following categories: performance, accessibility, best practices, SEO, and progressive web app (PWA). The generated report helps you measure the Web Vitals and provides insights on optimizing the quality of user experience of your web pages.
- To get started with web performance testing using BrowserStack Automate, refer to our getting started page.
- This feature is exclusive to the Automate Desktop and Mobile Pro plan. Visit our pricing page for more details.
You have the following two ways of integrating Lighthouse with Playwright tests:
The Lighthouse report generation and assertion is done through JavascriptExecutor. To enable JavaScriptExecutor, set the following capability in your configuration file:
browserstack.performance: assert;
Setting this capability also generates the Lighthouse reports.
- The Lighthouse integration supports generating reports for up to the first 10 web pages (URLs) opened during a test session.
- Currently, Lighthouse report generation is supported on browsers Chrome and Edge 93 and above.
- Supported operating system versions include Windows 10 and later and macOS Mojave and later.
Assert Lighthouse configuration
You can assert on the Lighthouse categories & metrics using JavascriptExecutor. Post this, you can generate a Lighthouse report.
Let us look at some scenarios on asserting the Lighthouse configuration.
Generate Lighthouse report of URLs
To generate a Lighthouse report of a URL in the current test context through JavascriptExecutor, set the action parameter to lighthouseAudit. To pass a custom URL for the Lighthouse audit, mention the URL in the arguments object. Use the sample JavascriptExecutor request below:
In the below example, the current URL in the browser context is picked up.
page.evaluate("_ => {}", "browserstack_executor: {\"action\": \"lighthouseAudit\"}}");
await page.evaluate(_ => {}, `browserstack_executor: ${JSON.stringify({
    "action": "lighthouseAudit"
})}`);
In the below example, the specified URL is picked up.
page.evaluate("_ => {}", "browserstack_executor: {\"action\": \"lighthouseAudit\", \"arguments\": {\"url\": \"https://www.bstackdemo.com\"}}");
await page.evaluate(_ => {}, `browserstack_executor: ${JSON.stringify({
    "action": "lighthouseAudit",
    "arguments":{
      "url": "https://www.browserstack.com"
    }
})}`);
Assert Lighthouse results
To assert the Lighthouse audit scores against the specified value, mention your assertion parameters in the assertResult object. In the below example, if the Lighthouse performance score is below 40, the lighthouse assertion fails. Similarly, for the accessibility parameter, 50 is taken as the default threshold. In metrics, in the first-contentful-paint, the score (metricUnit) is more than 50. Use the sample JavascriptExecutor request below:
page.evaluate("_ => {}", "browserstack_executor: {\"action\":\"lighthouseAudit\",\"arguments\":{\"url\":\"https://bstackdemo.com/\",\"assertResult\":{\"categories\":{\"performance\":40,\"best-practices\":50},\"metrics\":{\"first-contentful-paint\":{\"moreThan\":50,\"metricUnit\":\"score\"},\"largest-contentful-paint\":{\"lessThan\":4000,\"metricUnit\":\"numeric\"},\"total-blocking-time\":{\"lessThan\":600,\"metricUnit\":\"numeric\"},\"cumulative-layout-shift\":{\"moreThan\":50,\"metricUnit\":\"score\"}}}}}");
await page.evaluate(_ => {}, `browserstack_executor: ${JSON.stringify({
    "action": "lighthouseAudit",
    "arguments":{
      "url": "https://bstackdemo.com/",
      "assertResult": {
        "categories": {
          "performance": 40,
          "best-practices": 50
        },
        "metrics": {
          "first-contentful-paint": {
              "moreThan": 50,
              "metricUnit": "score"
          },
          "largest-contentful-paint": {
              "lessThan": 4000,
              "metricUnit": "numeric"
          },
          "total-blocking-time": {
              "lessThan": 600,
              "metricUnit": "numeric"
          },
          "cumulative-layout-shift": {
              "moreThan": 50,
              "metricUnit": "score"
          }
        }
      }
    }
})}`);
Mark test session status as `failed`
Use the code below to mark test sessions as failed if any of the assertions in the assertResult object across any URLs fail:
page.evaluate("_ => {}", "browserstack_executor: {\"action\":\"lighthouseAudit\",\"arguments\":{\"url\":\"https://bstackdemo.com/\",\"assertResult\":{\"sessionFail\":true,\"categories\":{\"performance\":40},\"metrics\":{\"largest-contentful-paint\":{\"lessThan\":4000,\"metricUnit\":\"numeric\"}}}}}");
await page.evaluate(_ => {}, `browserstack_executor: ${JSON.stringify({
    "action": "lighthouseAudit",
    "arguments":{
      "url": "https://bstackdemo.com/",
      "assertResult": {
        "sessionFail": true,
        "categories": {
          "performance": 40
        },
        "metrics": {
          "largest-contentful-paint": {
              "lessThan": 4000,
              "metricUnit": "numeric"
          }
        }
      }
    }
})}`);
With SDK, use the following in your browserstack.yml file to prevent SDK from overriding the failed session status marked by ligthouse assertion:
testContextOptions:
skipSessionStatus: true
If the above configuration is not working, upgrade to the latest SDK version.
Access lighthouse JSON reports in the test script
page.evaluate("_ => {}", "browserstack_executor: {\"action\":\"lighthouseAudit\",\"arguments\":{\"url\":\"https://bstackdemo.com/\",\"executorOutput\":\"json\"}}");
await page.evaluate(_ => {}, `browserstack_executor: ${JSON.stringify({
  "action": "lighthouseAudit",
  "arguments":{
    "url": "https://www.bstackdemo.com",
    "executorOutput": "json"
    }
})}`);
If any of the above parameters are not passed, the default Lighthouse configuration will be effective. No validation is to be applied to your inputs.
The request returns the below assertion result in the response.
browserstack_executor_response: {
  "url": "https://www.browserstack.com",
    "categories": {
        "performance": "passed",
        "best-practices": "failed"
    }
    "metrics": {
        "first-contentful-paint": "passed",
        "largest-contentful-paint": "failed",
        "total-blocking-time": "passed",
        "cumulative-layout-shift": "failed"
    }
}
Description of the parameters in the JavascriptExecutor request
| Object | Mandatory/Optional | Description |
|---|---|---|
| categories | Optional | Allows you to add assertion on lighthouse categories’ score, available in the categories object in the result JSON - Lighthouse. Valid value(s) for the categories: performance, accessibility, best-practices, seo, pwa. Valid values for the categories’ score: null, integer from 0 to 100, 50 (default). |
| metrics | Optional | Allows you to add assertions on lighthouse metrics result present in the audits objects in the result JSON - Lighthouse. Valid value(s) for the metrics are the parameters in the audits object in the lighthouse result.metrics Child: a. Either moreThan or lessThan - allows you to provide the threshold value for assertion. Both parameters are of float type.b. metricUnit - allows user to specify the threshold value type. Valid values are: score, numeric. score compares with the score parameter and numeric compares with numericValue in the audits child object in the Lighthouse result JSON. |
Set Lighthouse-specific configurations
You can emulate the device for lighthouse audit by passing various configurations that are specific to Lighthouse.
To configure Lighthouse, pass your configurations in the lhConfig object.
You can assert on the Lighthouse settings along with setting the configurations in the lhconfig object.
Here are some sample scenarios for using the Lighthouse-specific configurations:
Emulate the device for Lighthouse audit
The lhConfig object allows you to pass Lighthouse-specific configurations. By default the view is mobile view.
Lighthouse runs on Slow 4G network and MOTOG4 mobile screens.
Use the code below to emulate the desktop devices for the Lighthouse audit:
page.evaluate("_ => {}", "browserstack_executor: {\"action\":\"lighthouseAudit\",\"arguments\":{\"url\":\"https://bstackdemo.com/\",\"lhConfig\":{\"extends\":\"lighthouse:default\",\"settings\":{\"formFactor\":\"desktop\",\"screenEmulation\":{\"mobile\":false,\"width\":1350,\"height\":940,\"deviceScaleFactor\":1,\"disabled\":false}}},\"assertResult\":{\"categories\":{\"performance\":40},\"metrics\":{\"largest-contentful-paint\":{\"lessThan\":4000,\"metricUnit\":\"numeric\"}}}}}");
await page.evaluate(_ => {}, `browserstack_executor: ${JSON.stringify({
    "action": "lighthouseAudit",
    "arguments":{
      "url": "https://bstackdemo.com/",
      "lhConfig": {
        "extends": "lighthouse:default",
        "settings": {
          "formFactor": "desktop",
          "screenEmulation": {
            "mobile": false,
            "width": 1350,
            "height": 940,
            "deviceScaleFactor": 1,
            "disabled": false
          },
        },
      },
      "assertResult": {
        "categories": {
          "performance": 40
        },
        "metrics": {
          "largest-contentful-paint": {
              "lessThan": 4000,
              "metricUnit": "numeric"
          }
        }
      }
    }
})}`);
Use the code below to emulate the mobile devices for the Lighthouse audit:
page.evaluate("_ => {}", "browserstack_executor: {\"action\":\"lighthouseAudit\",\"arguments\":{\"url\":\"https://bstackdemo.com/\",\"lhConfig\":{\"extends\":\"lighthouse:default\",\"settings\":{\"formFactor\":\"mobile\",\"screenEmulation\":{\"mobile\":true,\"width\":412,\"height\":843,\"deviceScaleFactor\":1.75,\"disabled\":false}}},\"assertResult\":{\"categories\":{\"performance\":40},\"metrics\":{\"largest-contentful-paint\":{\"lessThan\":4000,\"metricUnit\":\"numeric\"}}}}}");
await page.evaluate(_ => {}, `browserstack_executor: ${JSON.stringify({
    "action": "lighthouseAudit",
    "arguments":{
      "url": "https://bstackdemo.com/",
      "lhConfig": {
        "extends": "lighthouse:default",
        "settings": {
          "formFactor": "mobile",
          "screenEmulation":{
            "mobile": true,
            "width": 412,
            "height": 843,
            "deviceScaleFactor": 1.75,
            "disabled": false
          }
        }
      },
      "assertResult": {
        "categories": {
          "performance": 40
        },
        "metrics": {
          "largest-contentful-paint": {
              "lessThan": 4000,
              "metricUnit": "numeric"
          }
        }
      }
    }
})}`);
Simulate the network connection for Lighthouse audit
Use the code below to simulate the network connection for predefined settings, using the mobileRegular3G, desktopDense4G, and mobileSlow4G settings.
{
    "action": "lighthouseAudit",
    "arguments":{
      "throttling": "mobileRegular3G"
    }
}
Use the code below to simulate the network connection by adding customised settings for the Lighthouse audit or disable the default network simulation by Lighthouse:
page.evaluate("_ => {}", ""browserstack_executor: {\"action\":\"lighthouseAudit\",\"arguments\":{\"url\":\"https://bstackdemo.com/\",\"lhConfig\":{\"extends\":\"lighthouse:default\",\"settings\":{\"throttling\":{\"rttMs\":150,\"throughputKbps\":1638.4,\"cpuSlowdownMultiplier\":4,\"requestLatencyMs\":562.5,\"downloadThroughputKbps\":1474.56,\"uploadThroughputKbps\":675}}},\"assertResult\":{\"categories\":{\"performance\":40},\"metrics\":{\"largest-contentful-paint\":{\"lessThan\":4000,\"metricUnit\":\"numeric\"}}}}}");
await page.evaluate(_ => {}, `browserstack_executor: ${JSON.stringify({
    "action": "lighthouseAudit",
    "arguments":{
      "url": "https://bstackdemo.com/",
      "lhConfig": {
        "extends": "lighthouse:default",
        "settings": {
          "throttling": {
            "rttMs": 150,
            "throughputKbps": 1638.4,
            "cpuSlowdownMultiplier": 4,
            "requestLatencyMs": 562.5,
            "downloadThroughputKbps": 1474.56,
            "uploadThroughputKbps": 675
          }
        }
      },
      "assertResult": {
        "categories": {
          "performance": 40
        },
        "metrics": {
          "largest-contentful-paint": {
              "lessThan": 4000,
              "metricUnit": "numeric"
          }
        }
      }
    }
})}`);
Click here for the description of the Lighthouse parameters.
View reports on the Automate dashboard
On your Automate dashboard, select the Web Performance tab to view the report generated by Lighthouse.
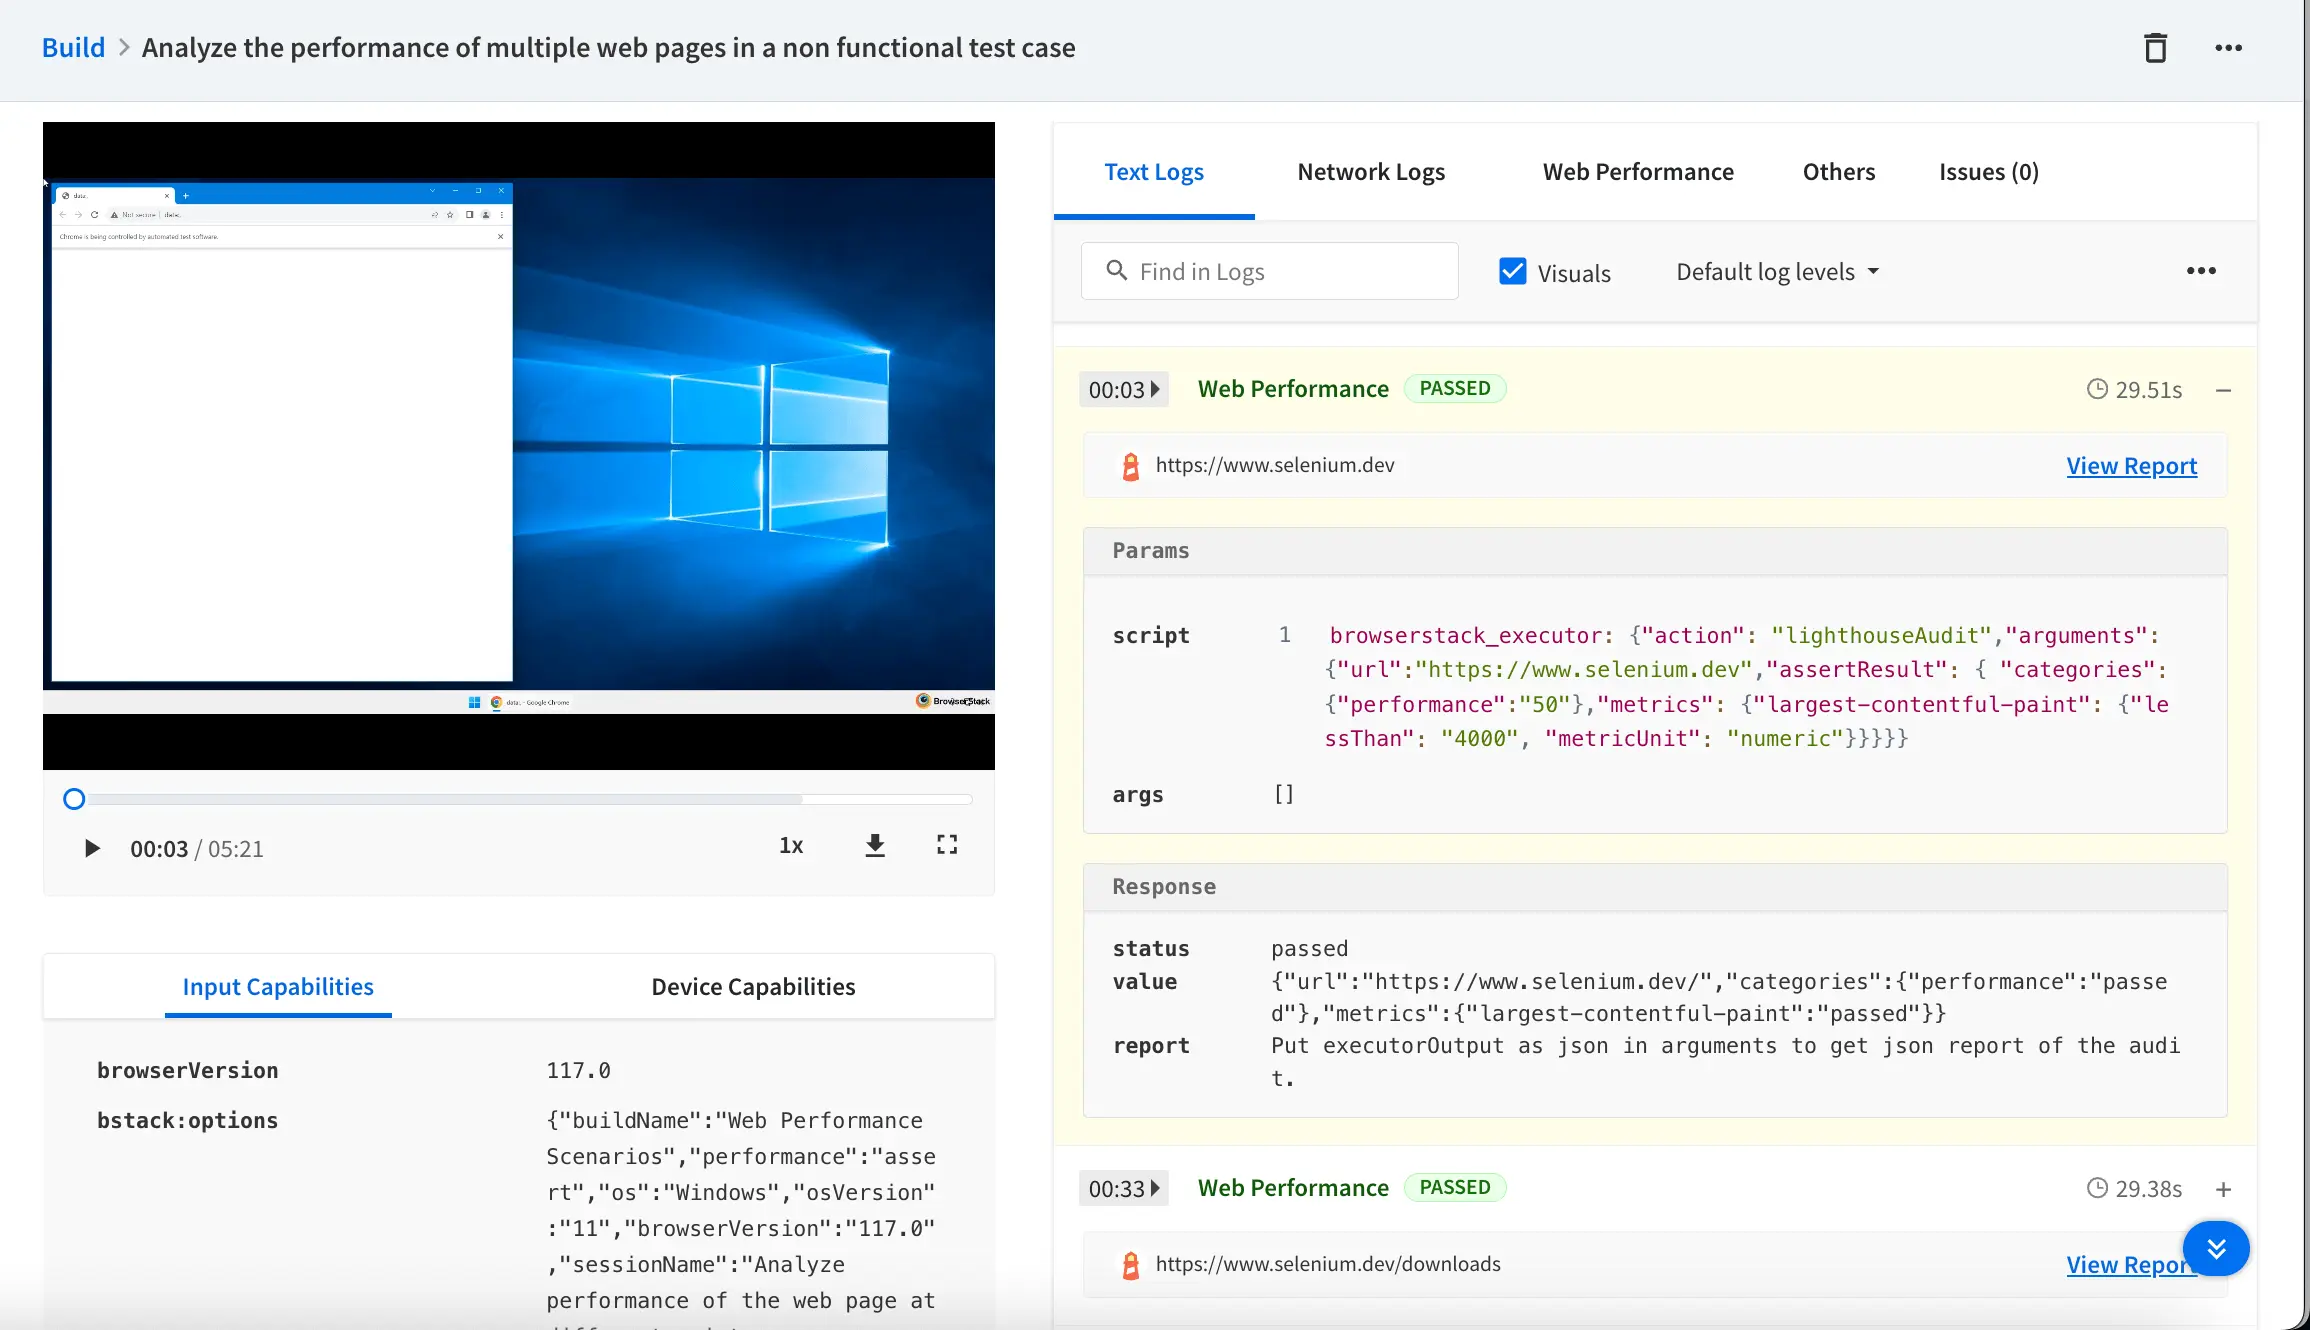
You can view the assertion results and the config parameters passed under the Text Logs tab. You can view the report by clicking the View Report link.
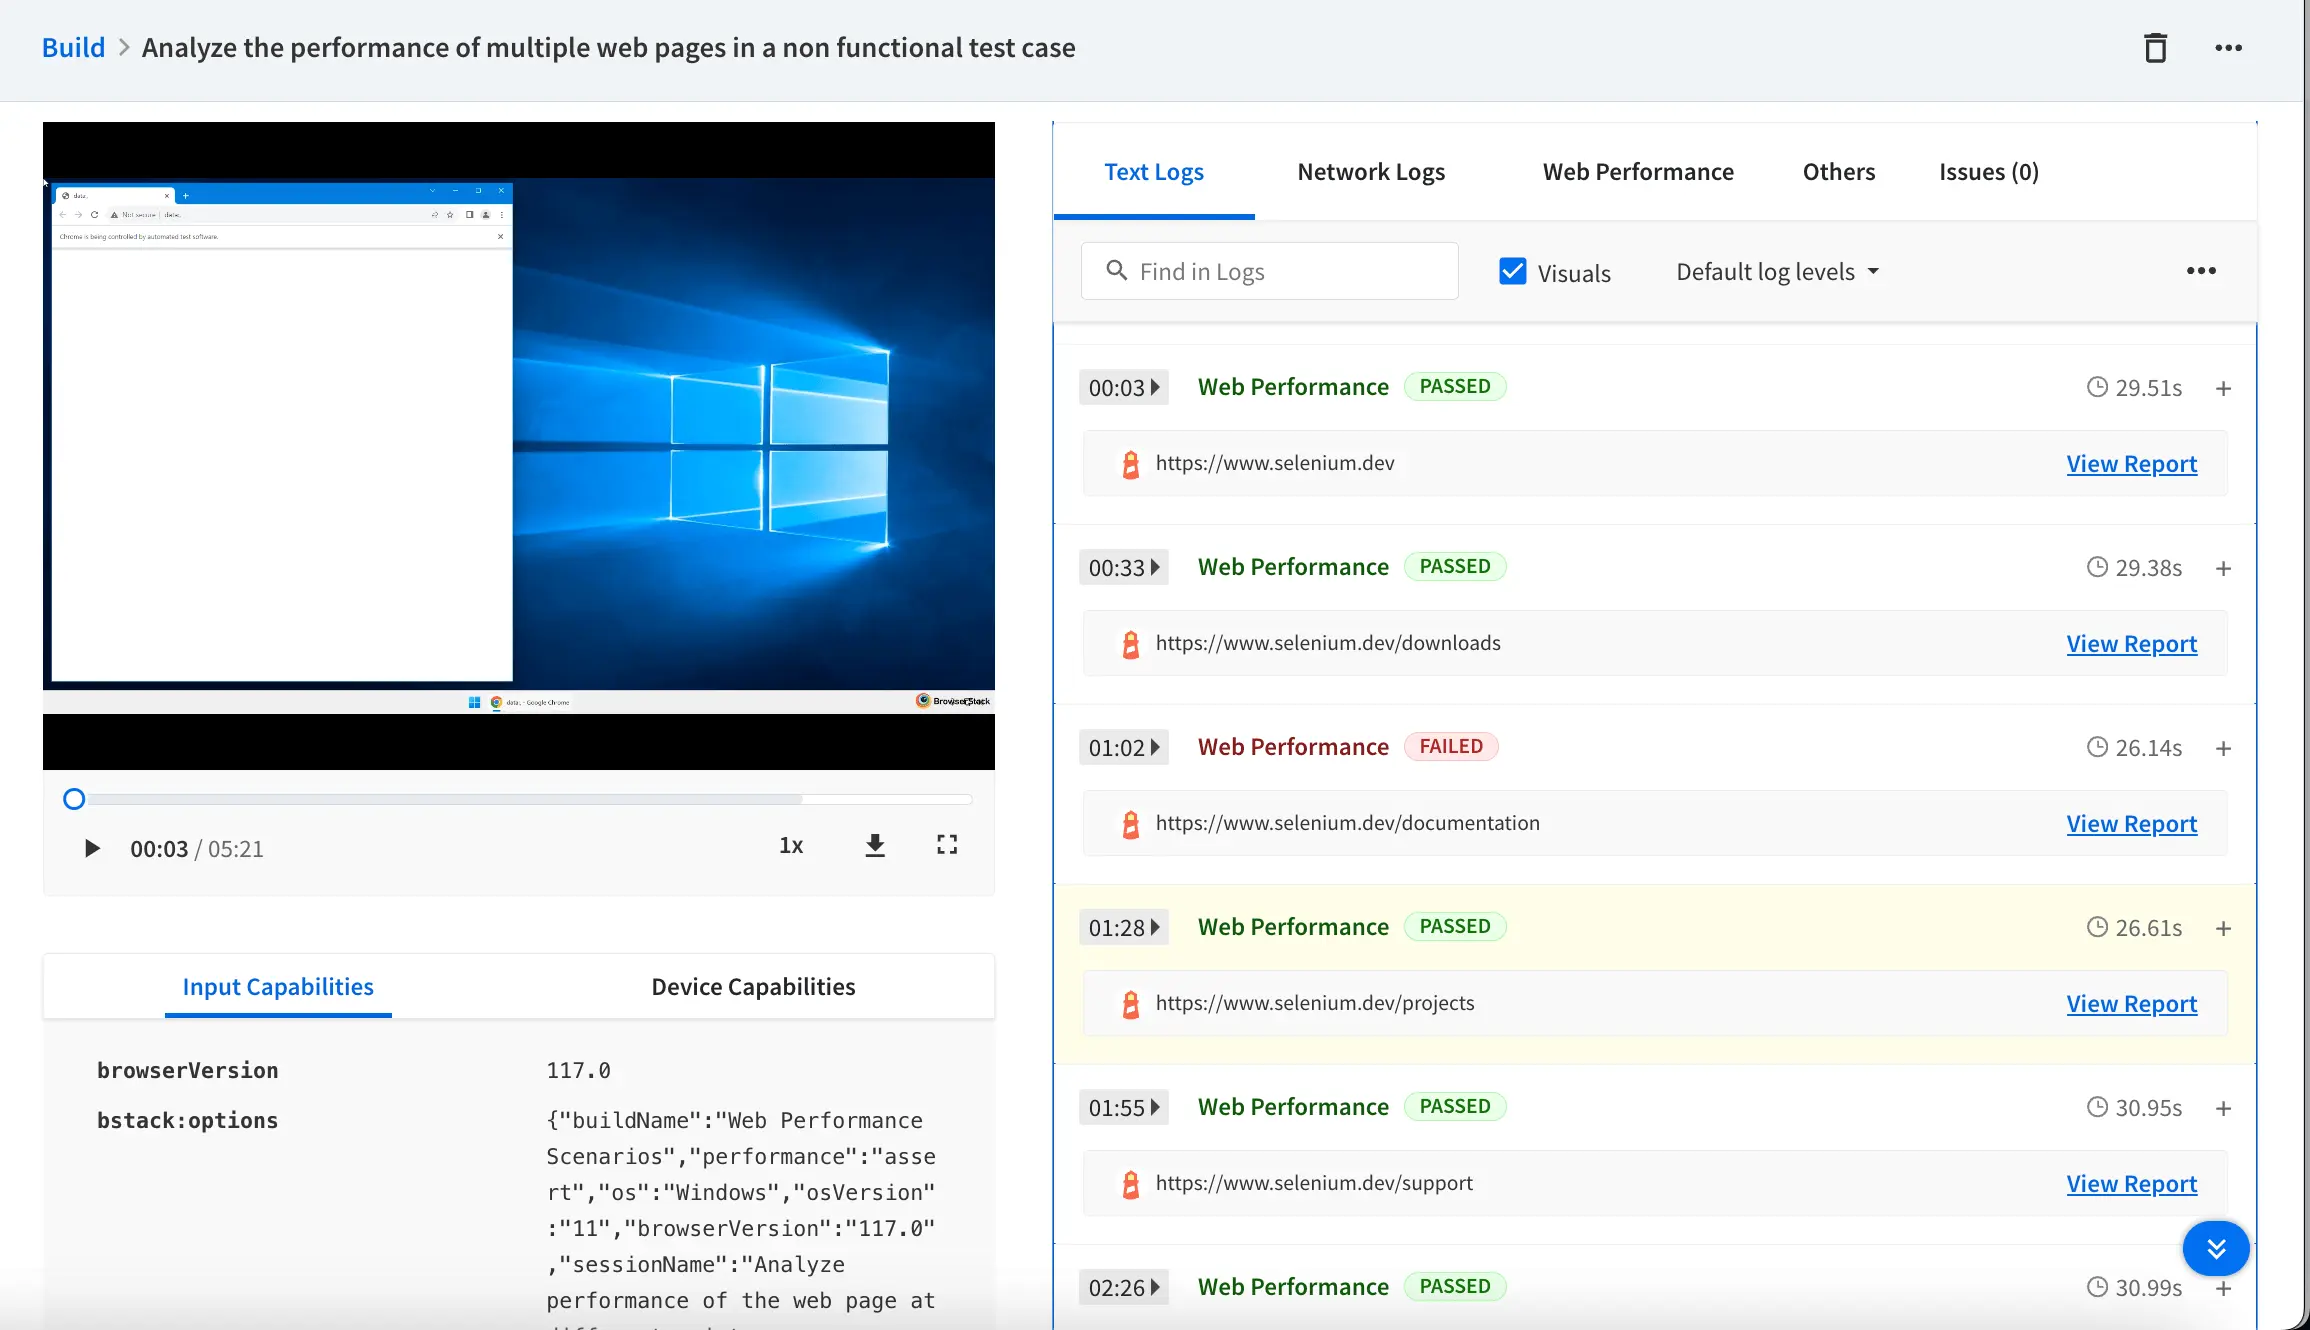
To view all the reports of the web performance in one place, select the Web Performance tab.
Generate Lighthouse reports
To generate a lighthouse report for the open URLs in a session, set the following capabilities in your test script:
- For a Lighthouse report to generate, a test session must be at least 30-60 seconds long. If your test is likely to take less time, consider introducing the required amount of artificial delay.
- To successfully generate lighthouse report for more than one URL, ensure 30 to 60 seconds processing time after each opened URL.
browserstack.performance: report;
- The Lighthouse integration supports generating reports for up to the first 10 web pages (URLs) opened during a test session.
- Currently, Lighthouse reports are supported on Chrome 85 and above.
- Supported operating system versions include Windows 10 and later, macOS Mojave and later.
Important points to remember:
- The setting is
falseby default. You can see the Web Performance tab on the Automate dashboard only when you set the capability totrue. - If a pop-up appears on the web page of your website under test when Lighthouse launches, the report does not get generated.
- If you incorporate two consecutive open URLs in your code, the system generates a report solely for the first open URL session. To acquire a report for subsequent open URLs, ensure you utilize the wait command for 30 seconds after each open URL.
- The web performance feature is currently available for desktop browsers only.
View reports on the Automate dashboard
On your Automate dashboard, select the Web Performance tab to view the report generated by Lighthouse.
We're sorry to hear that. Please share your feedback so we can do better
Contact our Support team for immediate help while we work on improving our docs.
We're continuously improving our docs. We'd love to know what you liked
We're sorry to hear that. Please share your feedback so we can do better
Contact our Support team for immediate help while we work on improving our docs.
We're continuously improving our docs. We'd love to know what you liked
Thank you for your valuable feedback!