View server metrics in BrowserStack
Pull host metrics from Datadog, New Relic, or Dynatrace into BrowserStack and view them on a metric timeline alongside your load test results.
When you run a load test, BrowserStack shows you client-side results such as response time, throughput, and error rate. The root cause of a slowdown often sits on the server, in conditions such as high CPU usage, memory pressure, or rising application latency. With pull mode, you bring those server-side metrics from your APM tool into BrowserStack and view them on the same timeline as your load test. This way, you can tell at a glance whether a client-side spike came from server-side strain, without switching tabs or aligning timestamps by hand.
For an overview of all APM options, see Application Performance Monitoring integration.
Supported tools
You can pull host metrics from any one of the following APM tools:
The configuration flow and the report timeline are the same for all three tools. Only the connection details differ, and those are covered in each tool’s integration guide.
Integration modes
Each connected APM tool supports three integration modes. In the labels below, [tool] is the APM tool you select, such as Datadog:
| Integration mode | What it does? | CLI mode value |
|---|---|---|
| Show Load Test metrics in [tool] | Sends your load test metrics and events to your APM tool, where you build dashboards and alerts. | push |
| Show [tool] metrics in Load Test Dashboard | Brings selected host metrics from your APM tool into the Load Test Dashboard and plots them on the run report. | pull |
| Both ways | Sends load test metrics to your APM tool and brings host metrics into the dashboard at the same time. | both |
You can show APM metrics in the Load Test Dashboard for one APM tool at a time. You can still send your load test metrics to your other connected tools.
Prerequisites
Before you configure pull mode, make sure you have:
- A connected APM tool. To connect one, follow the Datadog, New Relic, or Dynatrace integration guide.
- A host that reports metrics to that tool during your test window.
- Access to BrowserStack Load Testing with permission to configure integrations.
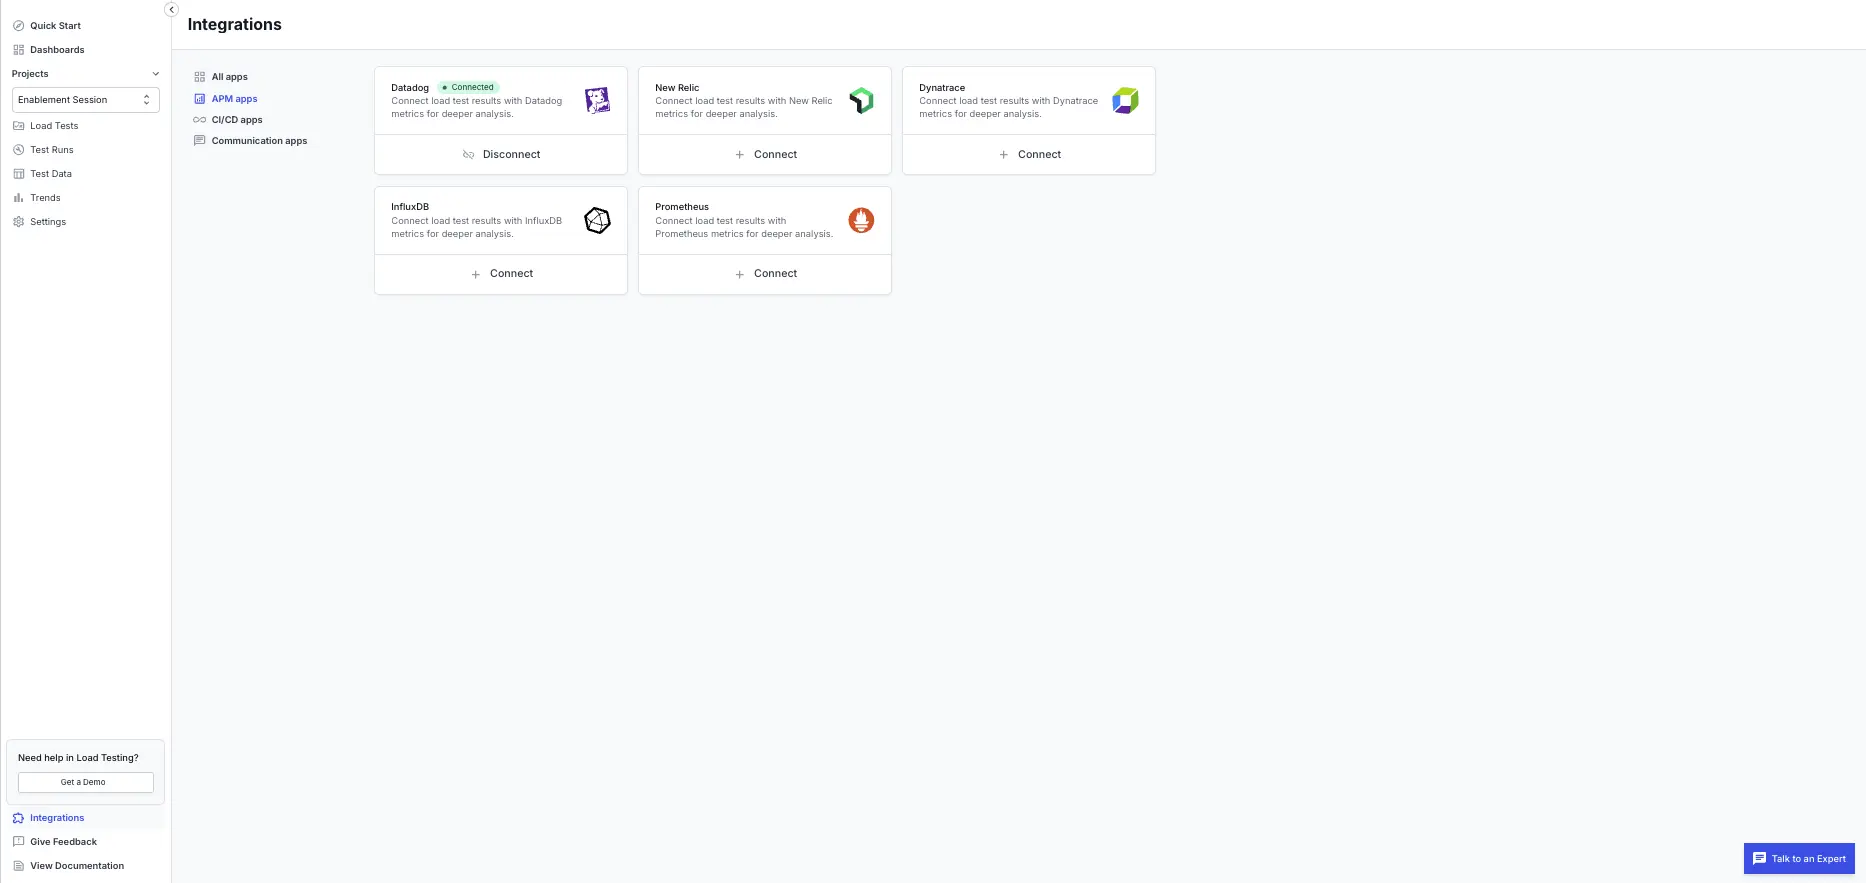
You connect and manage APM tools from the APM apps tab on the Integrations page.
Configure pull mode
You can configure pull mode from the BrowserStack dashboard or from the CLI. Both methods write to the same test configuration, so use whichever fits your workflow.
Configure pull mode from the test configuration before you run your test:
Open the APM integration settings
In your load test configuration, open the APM integration settings and find your connected APM tool: Datadog, New Relic, or Dynatrace.
Choose an integration mode
Under Choose a [tool] integration mode, where [tool] is the APM tool you selected, select Show [tool] metrics in Load Test Dashboard to display your server metrics in BrowserStack, or Both ways to also send your load test metrics to the APM tool.
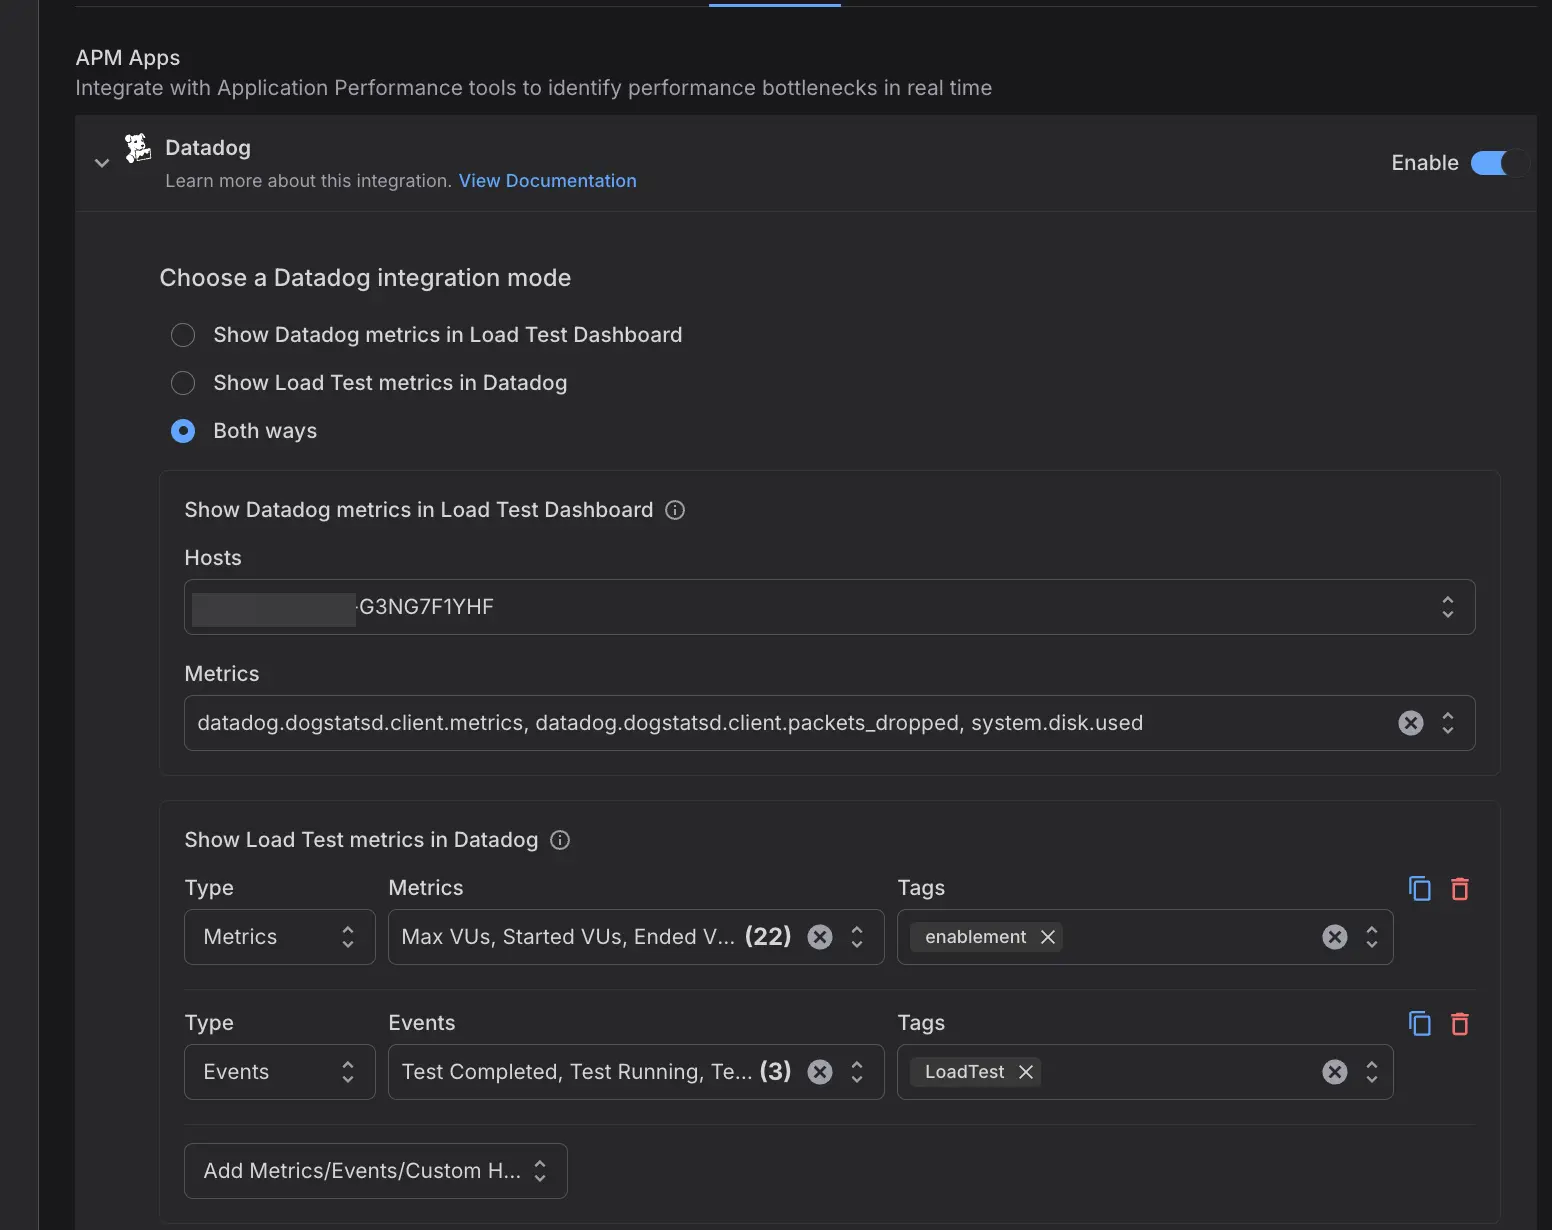
Select a host
From the Hosts dropdown, select the server whose metrics you want to view. You select one host per test.
Select metrics and save
In the Metrics field, select the metrics you want to plot, such as CPU usage and memory used. You can select up to 10 metrics. Save your configuration, then run your load test.
Configure pull mode in the browserstack-load.yml file. Set the mode and add a pull block under your APM tool. The following example pulls two host metrics from Datadog:
New Relic uses the same shape under the newrelic block:
Dynatrace identifies hosts by entity ID rather than name, so the pull block requires an entityId value in the form HOST-.... You can find the entity ID in the host picker in the dashboard or in your Dynatrace environment.
For the full connection reference and push options, see each tool’s integration guide.
View the metric timeline
After your test runs, open the report and go to the Summary tab. Your selected server metrics appear in a dedicated metric timeline chart below the load chart, sharing the same time axis as your load test results. The chart is titled after your APM tool, for example Datadog metric timeline, and the legend lists each metric you selected.
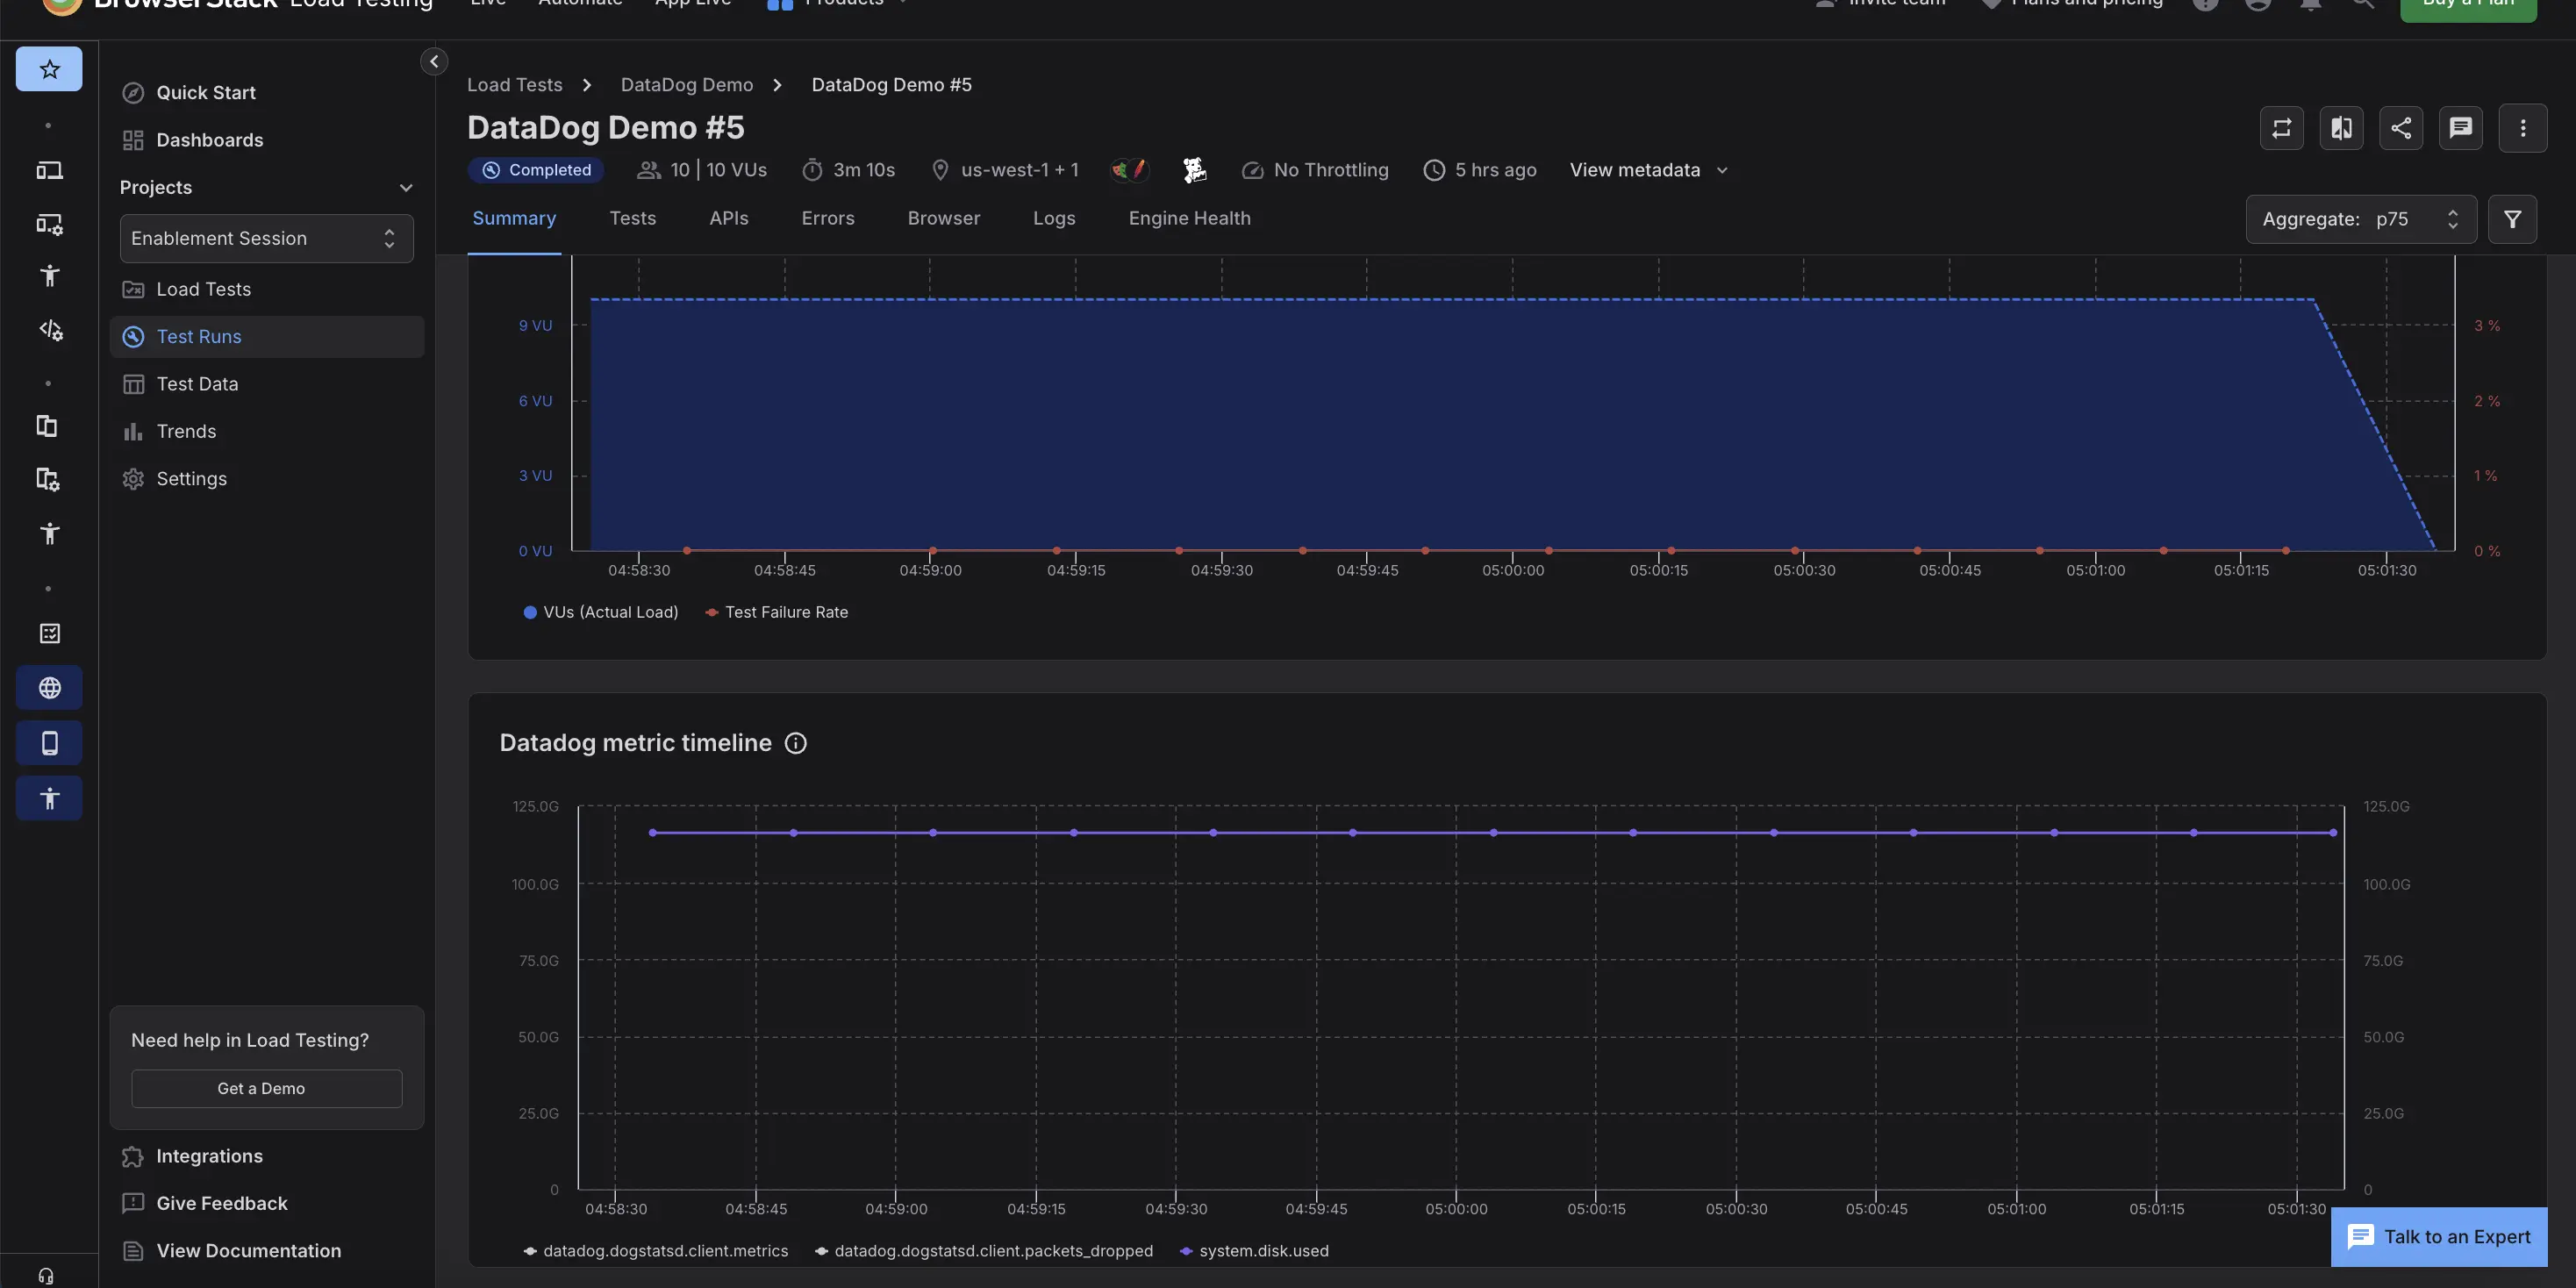
When you read the timeline, note the following:
- While the test runs, the timeline updates as data arrives, and server metrics can lag the load by about 30 to 90 seconds because of ingestion delay in your APM tool.
- To change the view, use the Aggregate control at the top of the report to switch how each series is summarized, for example from the default p75 to average, p90, p95, or maximum.
- If some metrics are unavailable, the timeline shows a banner with how many of your selected metrics could not load. The metrics that are available still render.
- In shared reports, anyone with access sees the timeline while your APM integration stays connected. The data stops showing if you disconnect the integration or rotate its credentials.
- In the PDF export, the timeline is included as a static image.
BrowserStack fetches your server metrics live each time you open the report. It does not store them. After your APM tool rolls up or ages out the data, which can happen a few hours after the test for high-resolution metrics, the timeline shows No metric data.
Points to remember
Pull mode has the following limits and behaviors:
- You can use pull or both ways for one APM tool at a time. Push remains available on your other connected tools.
- You select one host and up to 10 metrics per test.
- BrowserStack fetches metrics live when you open the report and does not store them, so older reports can show No metric data after your APM tool ages out the data.
- For Dynatrace, the CLI configuration requires an
entityId. A host name on its own is rejected when you create the test.
Next steps
After your test completes, open the Summary tab to correlate your load test results with server metrics. To send load test metrics back to your APM tool as well, set the mode to Both ways. For tool-specific setup and push options, see the Datadog, New Relic, and Dynatrace integration guides.
We're sorry to hear that. Please share your feedback so we can do better
Contact our Support team for immediate help while we work on improving our docs.
We're continuously improving our docs. We'd love to know what you liked
We're sorry to hear that. Please share your feedback so we can do better
Contact our Support team for immediate help while we work on improving our docs.
We're continuously improving our docs. We'd love to know what you liked
Thank you for your valuable feedback!