
 Join our Discord
Capture API calls by recording a journey
Use the Requestly browser extension to record a journey, capture your app’s API calls, filter and correlate them, and run them as a load test.
When you record a journey from Load Testing, the Requestly browser extension intercepts your browser’s network traffic and captures the API calls behind each action, such as POST /api/cart/add or GET /api/products. You navigate through your app once, and Load Testing turns those captured calls into a Requestly collection that you can run as an API or hybrid load test. Load Testing also links the dynamic values it finds along the way, such as session tokens and IDs, so replays send fresh values instead of the ones you recorded. You don’t add or import endpoints, or correlate values, by hand.
Prerequisites
Before you start, make sure you have:
- A BrowserStack login linked to a Requestly account. If you don’t have one, sign up on the Requestly website. Your account links to your BrowserStack login on first use.
- A Load Testing project to report results to.
Capturing API calls by recording is available for API and hybrid load tests.
Record API calls
Follow these steps:
Create a load test
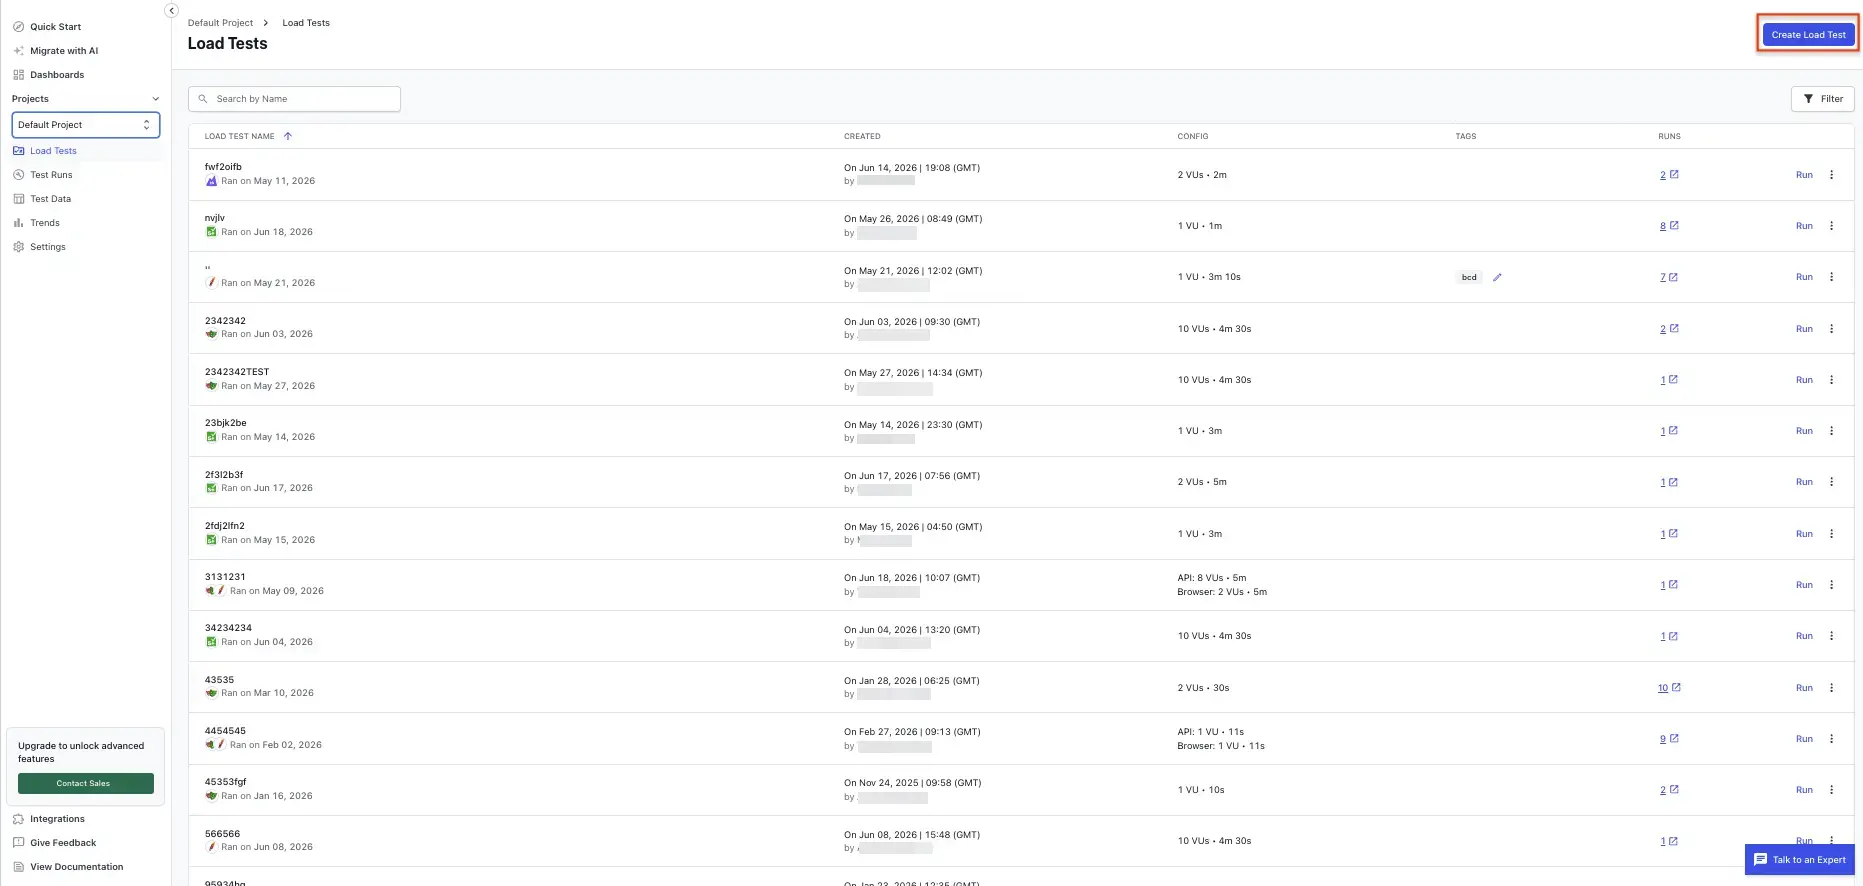
Open your Load Testing project on the Load Testing dashboard and click Create Load Test.
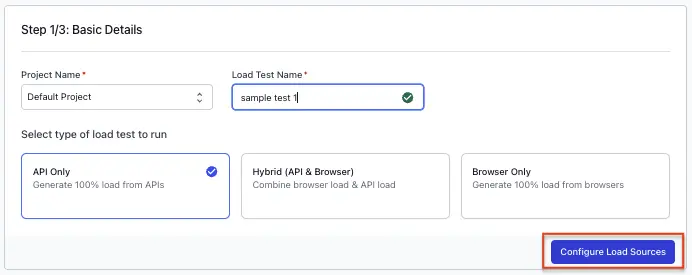
On Step 1/3: Basic Details, enter a project and load test name. Under Select type of load test to run, choose API Only. To also generate browser load, choose Hybrid (API & Browser). Click Configure Load Sources.
Choose to record a user journey
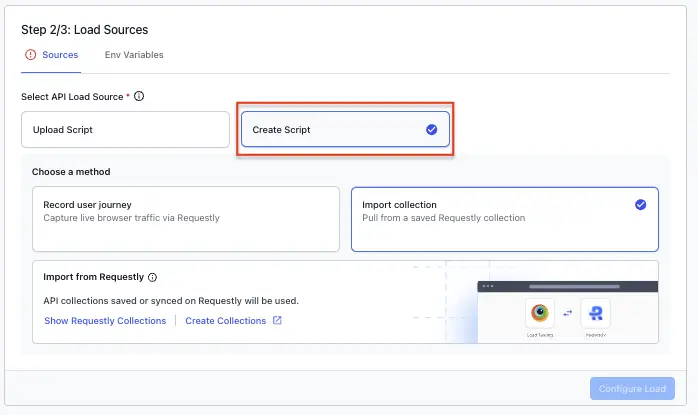
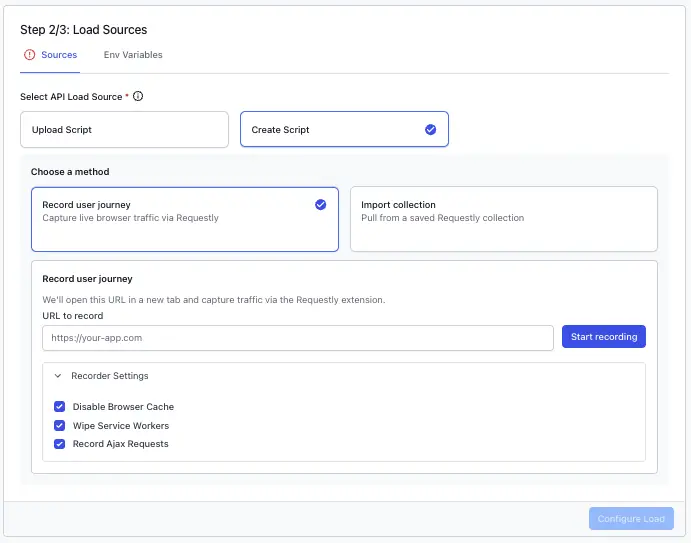
On Step 2/3: Load Sources, under Select API Load Source, select Create Script. Under Choose a method, select Record user journey to capture live browser traffic through Requestly.
Install the Requestly extension
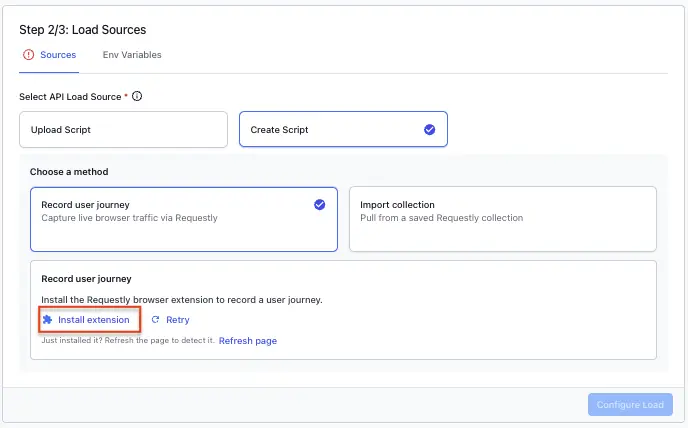
The first time you record, the panel asks you to install the Requestly browser extension. Click Install extension, add it to your browser, then click Refresh page so Load Testing detects it.
Start the recording
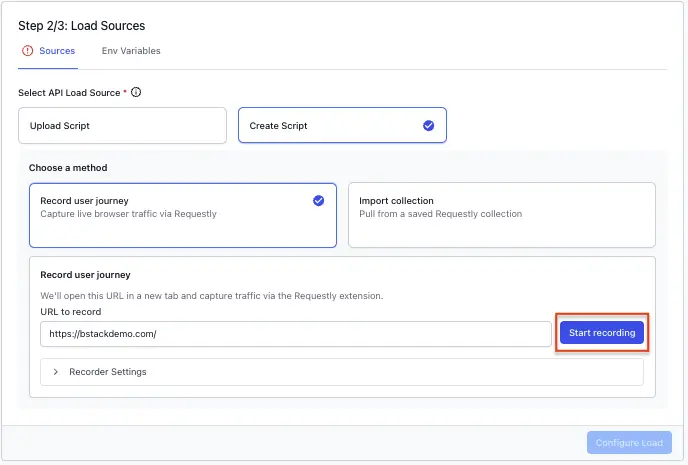
In the URL to record field, enter the page where your journey starts, such as https://bstackdemo.com/. To change how traffic is captured, expand Recorder Settings. For what each option does, see Recorder settings. Click Start recording.
Record your journey
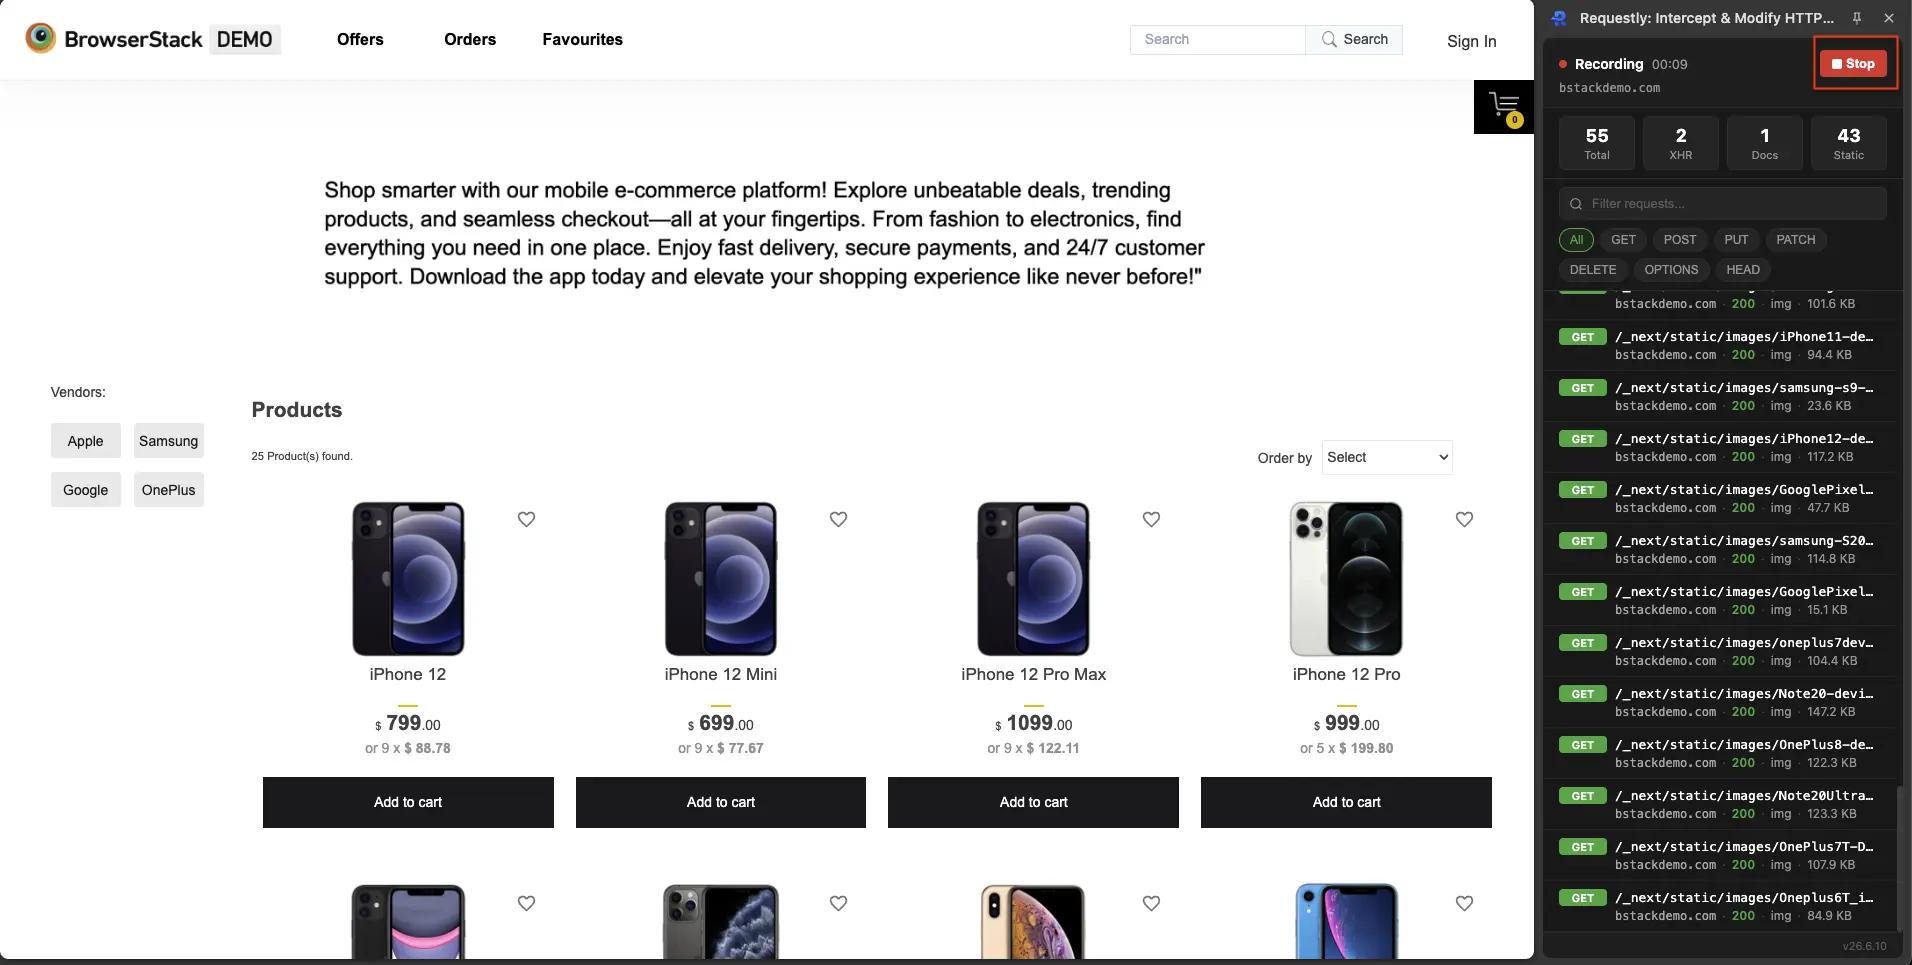
Load Testing opens the URL in a new tab with the Requestly extension recording. Navigate through your app as a real user would: sign in, browse, and check out. The extension captures the API calls behind each action. When you finish, click Stop.
Filter the captured requests
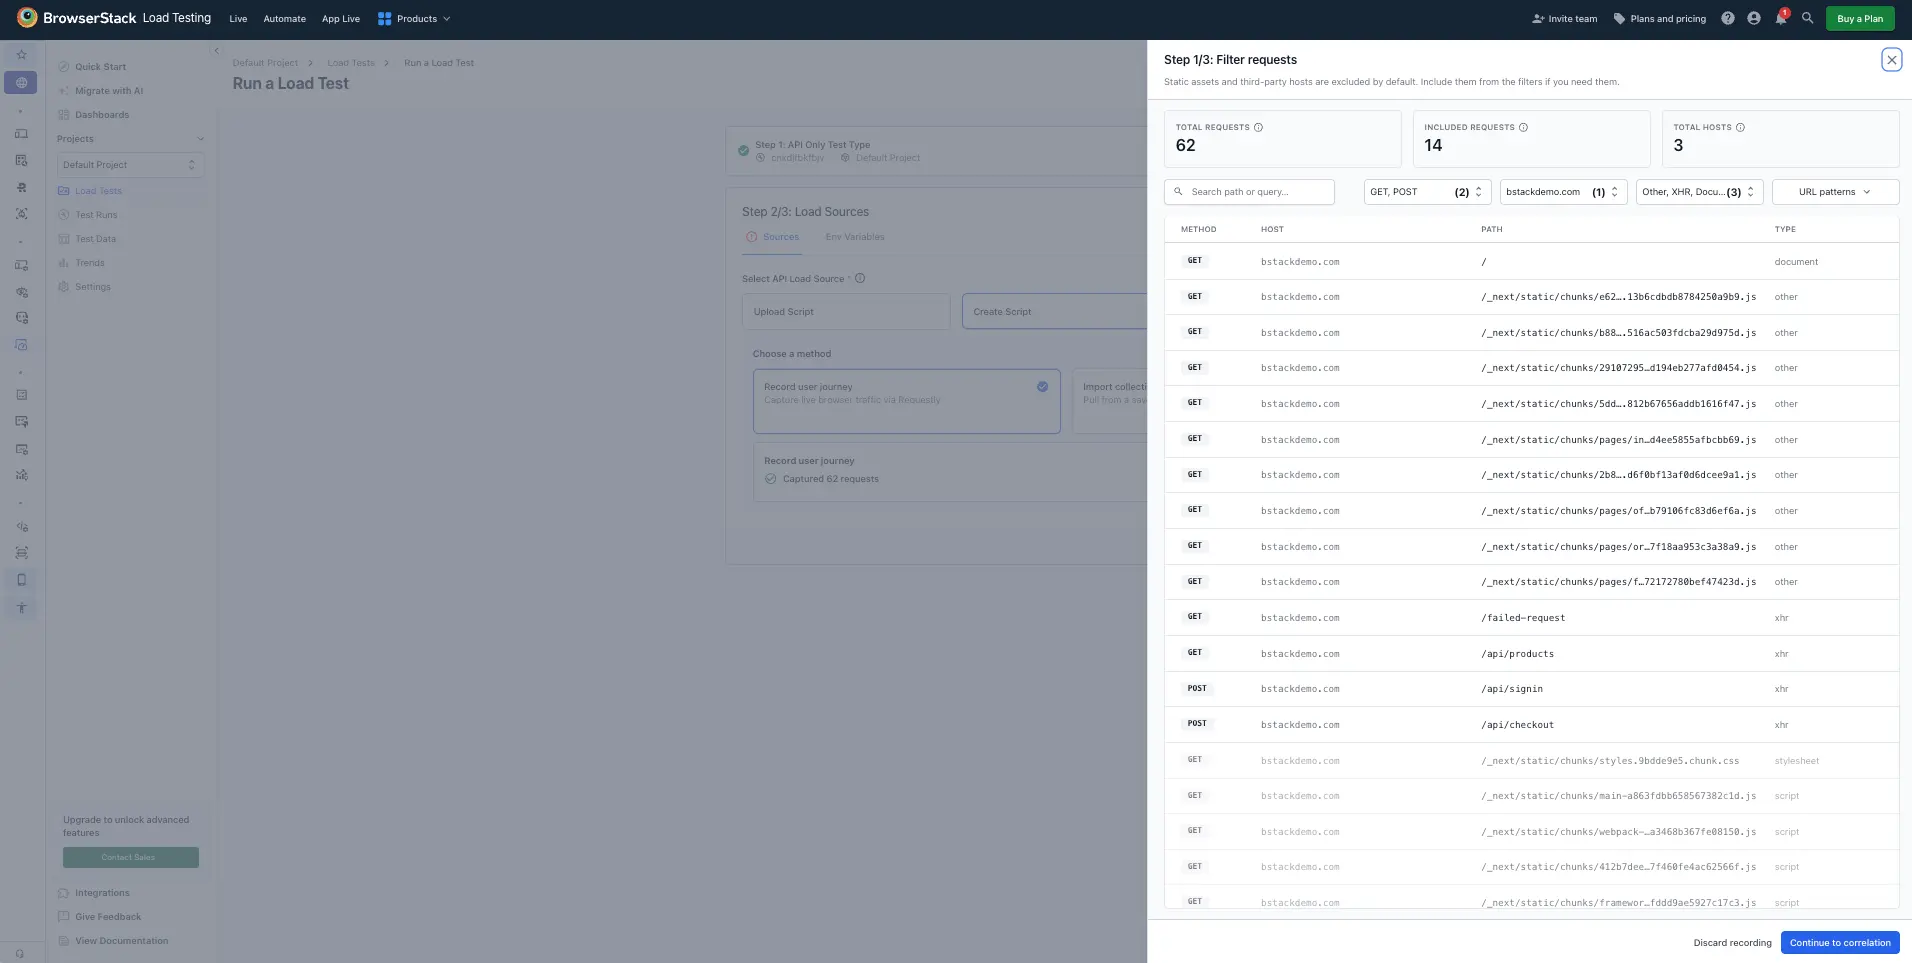
On the Filter requests screen, choose which captured API calls to include in your load test. Excluded rows are dimmed, not hidden, so you can still see the full capture. The header count updates as you adjust filters. See Filter captured requests for details on each option. Click Continue to correlation once the list looks right.
Review correlations
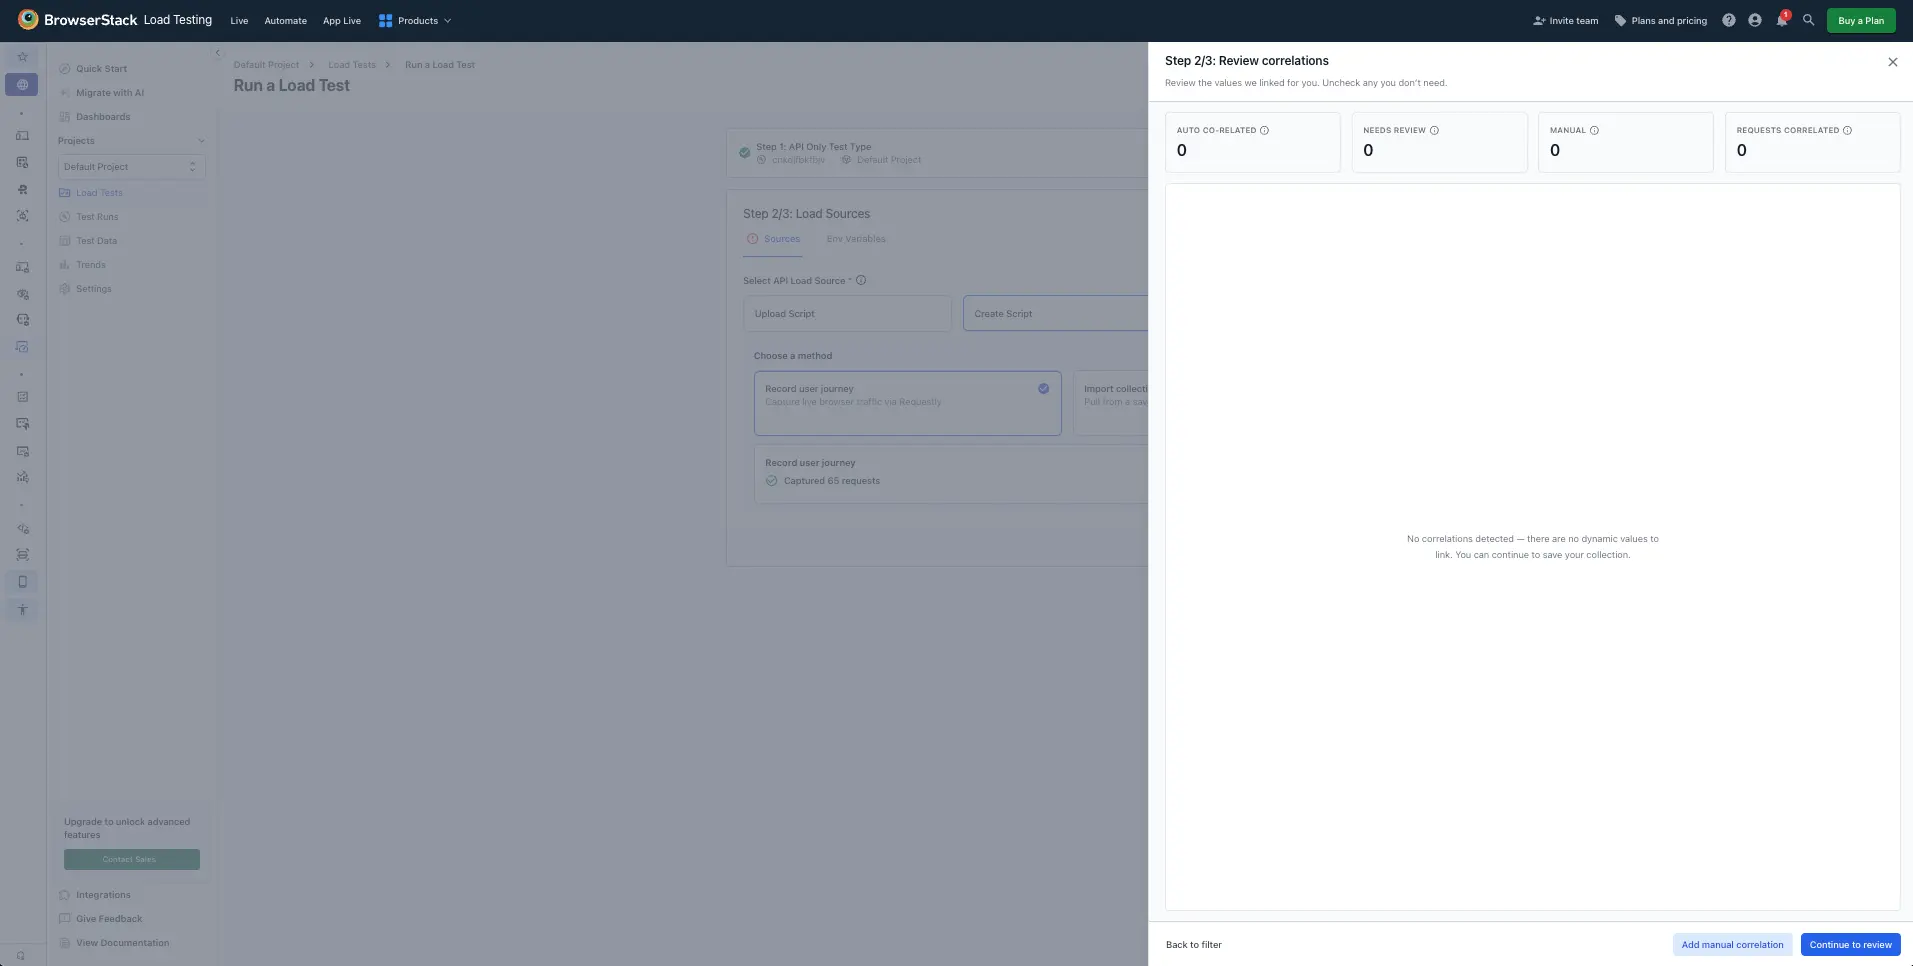
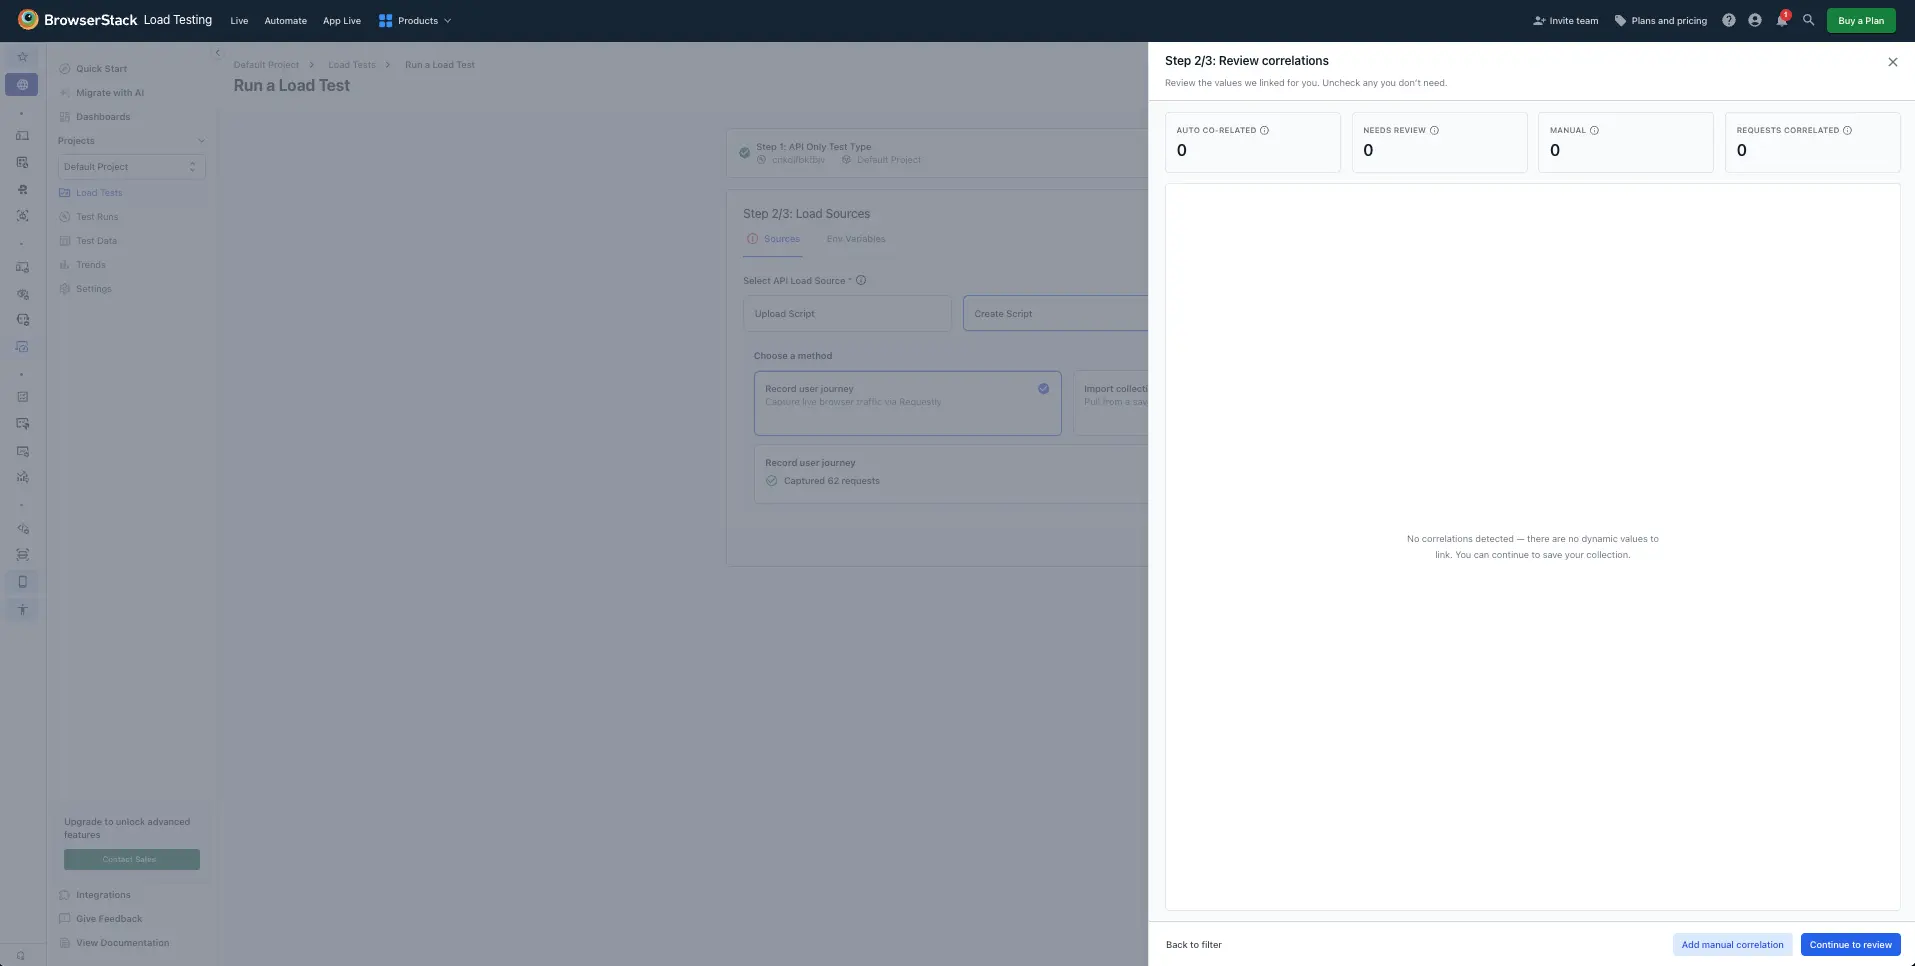
On the Review correlations screen, check the dynamic values, such as session tokens and IDs, that Load Testing linked automatically so replays send fresh values instead of the recorded ones. For details on each one, see Review correlations. Click Continue when the correlations look right.
Save the collection
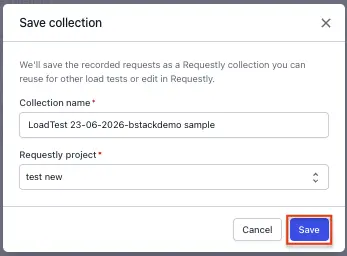
Name the collection and select the Requestly project to save it in. Expand Review collection contents to check the exact requests and correlated values before saving, then click Save collection. Load Testing saves the captured requests as a Requestly collection you can reuse for other load tests or edit in Requestly.
Configure load and run
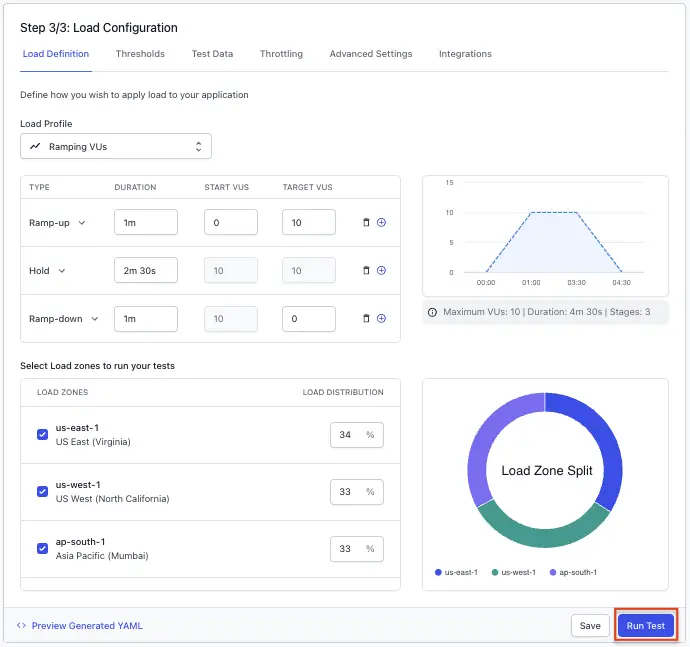
On Step 3/3: Load Configuration, set how to apply load to your application, such as the load profile, virtual users, and load zones. Click Run Test. For details on each option, see Configure load parameters.
Recorder settings
Before recording starts, you can expand Settings to change how the Requestly extension captures traffic. These settings apply to the current recording only and don’t change your saved Requestly preferences. The defaults suit most API load tests.
| Setting | What it does | When to turn it off | Default |
|---|---|---|---|
| Record Ajax Requests | Captures the XHR and fetch() calls your app makes after the page loads. These are the API calls an API load test relies on. |
Only when you record for page-load performance, not backend load. | On |
| Disable Browser Cache | Forces every request to hit the network instead of being served from the browser cache, so the recording reflects a first-time visitor. | When you want to test a returning user whose browser already has assets cached. | On |
| Wipe Service Workers | Clears any service worker for the site before recording, so requests it would otherwise serve from cache stay visible to the Requestly extension. | When you want to test how returning users behave with an installed service worker. | On |
| Include Iframe Requests | Captures traffic from embedded frames, like ads or payment widgets. | When you don’t want to include requests from third-party embedded content. | On |
| Recorder Opens In - New Window | Opens the recorder in a new browser window. Keeps your existing tabs out of the capture. | N/A | Selected |
| Recorder Opens In - New Incognito Window | Opens the recorder in an incognito window. Cleanest capture. Starts with no cookies or logins. | N/A | Not selected |
| Randomize Think Times | Shifts each recorded pause by ±20% so virtual users don’t hit your servers in lockstep. | When you want to replay exact pauses from the recording. | On |
Recorder settings apply to the current recording only. They don’t change your saved Requestly preferences or affect other recordings.
Filter captured requests
A single journey can capture hundreds of requests, including static assets, analytics, and third-party calls you don’t want to load test. On the Filter requests screen, narrow the capture down to the API calls that matter using the Method, Host, and Type dropdowns. A request is kept only if its method, host, and type are all selected, and rows that aren’t included are dimmed rather than hidden, so you always see the full captured set.
| Control | What it does | Default |
|---|---|---|
| Method | Selects which HTTP methods to include, such as GET, POST, PUT, PATCH, and DELETE. | All methods kept |
| Host | Selects which captured hosts to include. The host you recorded on is preselected. Third-party hosts, such as analytics or payment providers, stay off until you add them. | Recording host kept |
| Type | Selects which request types to include. API-style types, such as XHR, Fetch, and WebSocket, are on. Static asset types, such as Stylesheet, Script, Image, and Font, are off. | API-style types kept |
| URL patterns | Rule-based include or exclude that runs over every captured request, using a Glob or Regex pattern. Takes precedence over Method, Host, and Type. | No patterns |
URL patterns
For rule-based filtering, expand URL patterns and add an Include or Exclude rule using a Glob or Regex pattern. URL patterns run over every captured request and take precedence over the Method, Host, and Type dropdowns. A live count shows the result, such as “7 included, 93 excluded.”
| Goal | Mode | Matcher | Pattern |
|---|---|---|---|
| Drop analytics or telemetry calls | Exclude | Glob | */analytics/* |
| Keep only your API | Include | Glob | */api/* |
| Drop static assets by extension | Exclude | Regex | \.(png\|jpg\|css\|js)$ |
| Keep only versioned API paths | Include | Regex | /api/v[0-9]+/ |
A URL pattern matches against the whole URL, and Glob and Regex behave differently.
Glob is anchored, so booking.com matches nothing against https://www.booking.com/api/.... Wrap it as *booking.com*. Only * is special in a Glob pattern.
Regex matches a substring, so booking\.com matches without wrapping.
Review correlations
After you filter the captured requests, Load Testing shows the dynamic values, such as session tokens, IDs, and CSRF tokens, that it linked automatically so replays send fresh values instead of the recorded ones. Each correlation shows the variable as {{variableName}}, where its value comes from, such as Session cookie, Response header, or JSON body field, and how many requests reuse it.
| Tile | What it means |
|---|---|
| Auto co-related | Dynamic values, such as session tokens and IDs, that Load Testing linked automatically. |
| Needs review | Auto co-related values with a low-confidence link. Confirm these before you enable them. Deselected by default. |
| Manual | Correlations you added yourself with Add manual correlation. |
| Requests correlated | The total number of requests that receive at least one correlated value. |
A value fetched by several requests collapses into one variable reused across all of them, so you don’t get duplicate variables for the same value. Correlations only apply to requests you kept in the previous step. If a value’s source or target was filtered out, it doesn’t appear here.
Add a manual correlation
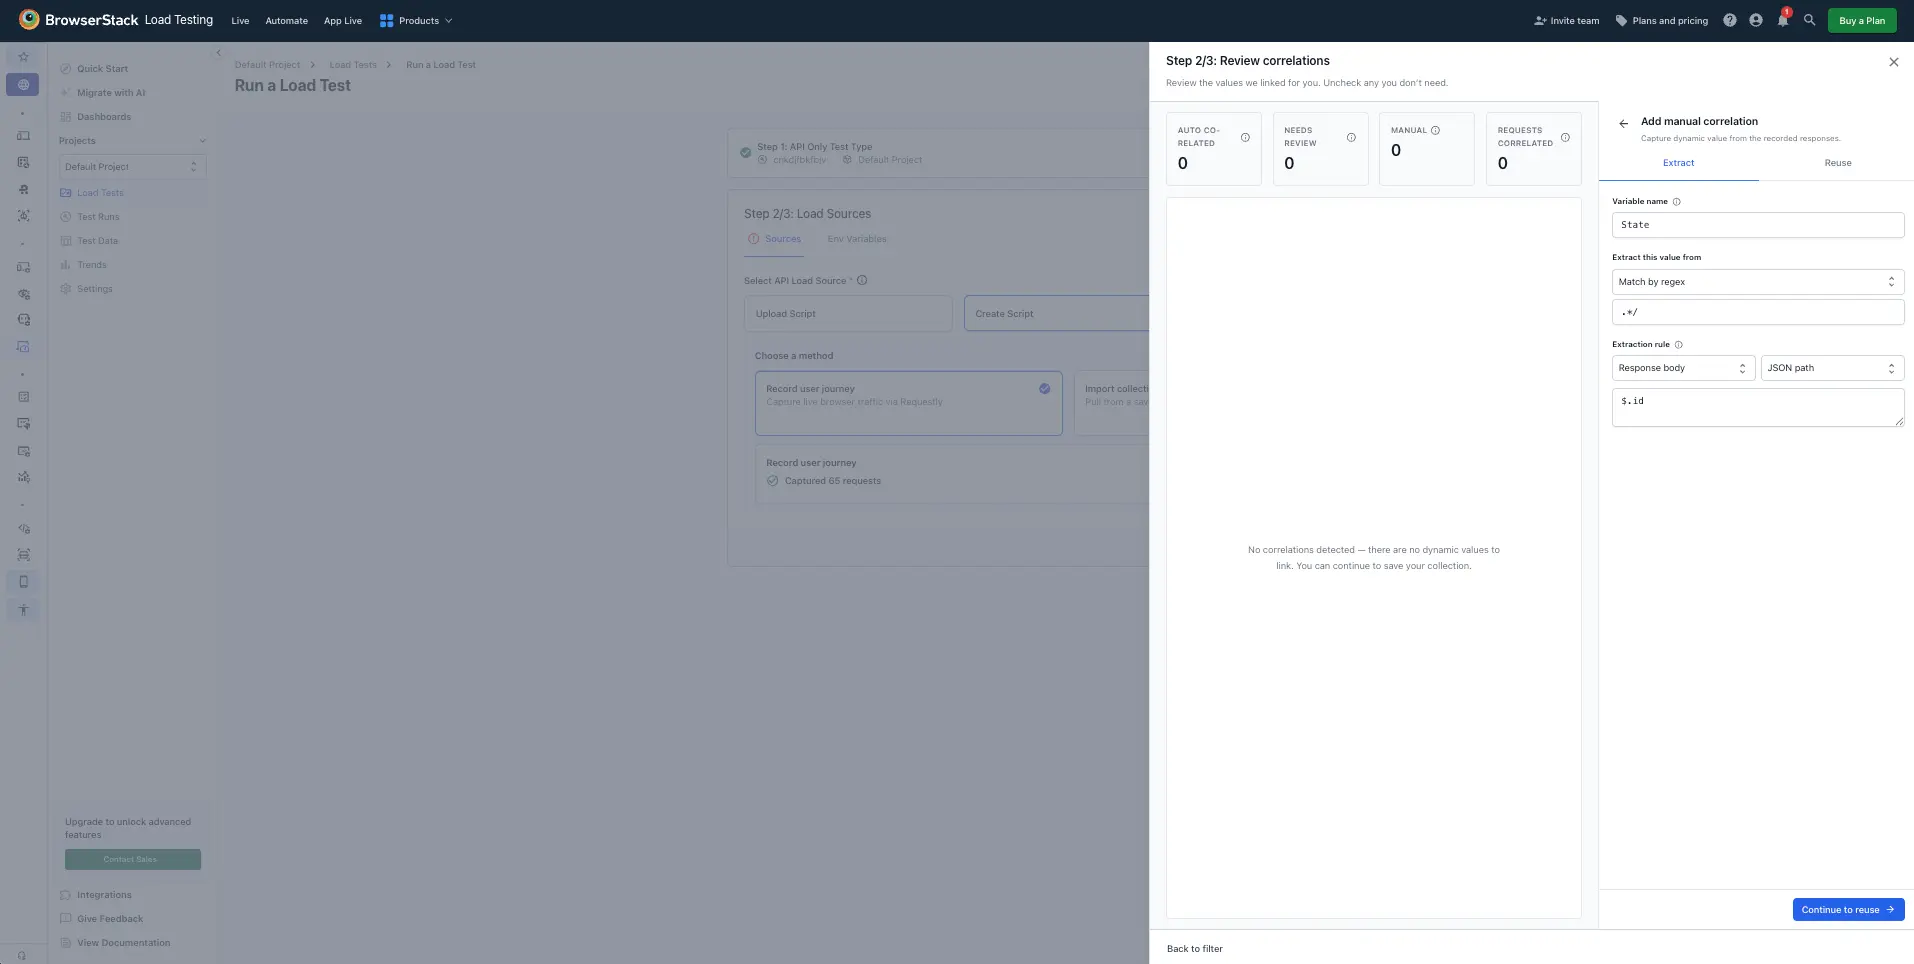
If a dynamic value wasn’t caught automatically, click Add manual correlation to open the Extract to Reuse wizard. You need at least 2 requests kept in the previous step to correlate a value between them.
On the Extract tab, name the variable, set Extract this value from to identify the source request, for example by matching a URL pattern, and set the extraction rule: where the value lives, such as Response body, Response header, or Cookie, and how to read it, such as a JSON path like $.id, a Regex, or a Substring.
On the Reuse tab, pick the requests to inject the value into and set the injection rule: where to place it, such as Request body, Request header, Cookie, URL path, or Query parameter, and the location key, such as X-Booking-Id. The preview table shows where the value lands:
| Status | What it means |
|---|---|
| Match | Captured and re-injected on every replay. This target correlates as expected. |
| Partial | Gets injected, but may not correlate cleanly. Hover the badge for the reason, such as the request running before the value is captured, the location already being correlated by another variable, a static asset, or a third-party host. |
| Skipped | Can’t receive the value, so it’s left out of the correlation. Hover the badge for the reason, such as the request having no body, no extraction rule set yet, the value not appearing in the URL path, or a JSON path that doesn’t resolve. |
Only Match and Partial rows appear in the preview, with Match listed first. Click Add correlation when the preview looks right.
Edit the collection in Requestly
You edit a saved collection in Requestly. Open the collection from your Requestly project to change request payloads, headers, variables, and the order of requests. Your changes sync back automatically, and the next time you run the test, Load Testing pulls the latest version of the collection.
Troubleshooting
| What you see | What to do |
|---|---|
| The install prompt keeps showing after you install the Requestly extension. | A freshly installed or updated extension isn’t always detected on a page that’s already open. Click Refresh page, not just Retry. |
| The New incognito window option is greyed out. | Requestly needs the Allow in Incognito permission. Open chrome://extensions, turn it on for Requestly, then click Retry. If your browser policy blocks incognito entirely, use New window instead. |
| “No requests were captured during this recording.” | Nothing was recorded, usually because the journey didn’t trigger API calls or you stopped too early. Record again and navigate through the actions you want to load test. |
| A Glob URL pattern matches nothing. | Glob matches the whole URL. Wrap your term in *, for example *booking.com* instead of booking.com. Or switch to Regex, which matches substrings. |
| “Header- and cookie-based correlations detected. Upgrade the Requestly extension…” | Your recording captured only header and cookie data, not request or response bodies. Update the Requestly extension so it also detects body-field correlations, then record again. |
Related topics
- Run a Requestly collection as a load test from the CLI: Run an existing Requestly collection from the command line.
- Use Requestly environment variables: Parameterize a Requestly collection with environment variables.
- Get started with API load testing: Other ways to create and run an API load test.
- Configure load parameters: Set virtual users, load zones, ramp profiles, and thresholds.
We're sorry to hear that. Please share your feedback so we can do better
Contact our Support team for immediate help while we work on improving our docs.
We're continuously improving our docs. We'd love to know what you liked
We're sorry to hear that. Please share your feedback so we can do better
Contact our Support team for immediate help while we work on improving our docs.
We're continuously improving our docs. We'd love to know what you liked
Thank you for your valuable feedback!