Capture test steps in Playwright load tests
View aggregated execution times for each test.step() in your Playwright load test, including min, avg, and percentile metrics across all virtual users.
Understand how each step in your Playwright test performs under load. When your test script uses test.step() blocks, BrowserStack records execution times for every block and shows aggregated timing data in the Tests tab of your load test report. Use this data to pinpoint which steps slow down or fail as load increases.
Test step capture is available only for Playwright browser load tests. It’s an opt-in setting that you turn on for each load test. Tests for other frameworks and test types don’t capture step data.
Prerequisites
Before you start, ensure you have the following:
- A BrowserStack account with access to a Load Testing project.
- A Playwright test script that uses test.step() blocks.
- The BrowserStack CLI installed and configured.
If your test script doesn’t use test.step() blocks, there’s nothing to capture. The feature only tracks steps that you’ve explicitly defined in your code.
How test steps work
When your test runs, the BrowserStack Playwright reporter hooks into your test.step() calls during execution. For each step, it captures:
-
Step name: the label you passed to
test.step(). - Duration: how long the step took, in milliseconds.
- Parent step: the step that this step is nested under, if any.
This data is collected from every virtual user (VU) running your test. After the test completes, BrowserStack aggregates the durations across all VU executions and computes percentile metrics so that you can see how each step performs under load, not just in a single run.
Enable test step capture
Test step capture is turned off by default. Turn it on for your load test using either the UI Builder or your CLI configuration. BrowserStack honors the setting for every run of that load test.
Depending on your preferred method, select any one of the following:
Turn on Capture Test Steps in the UI Builder
Enable test step capture from the load test details page:
Open the load test details page.
Open your Playwright load test and go to the load test details page.
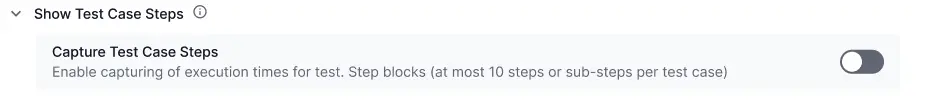
Turn on the Capture Test Steps setting.
Find the Capture Test Steps setting and turn it on. BrowserStack captures execution times for your test.step() blocks, up to 10 steps per test case.
Save your changes.
Save the load test. The setting stays on for every future run of this load test until you turn it off.
Set captureTestSteps in your configuration
In your browserstack-load.yml file, set the captureTestSteps flag to true:
When the flag is true, BrowserStack captures execution times for your test.step() blocks on every run you start from the CLI. Leave it out or set it to false to skip capture.
BrowserStack honors captureTestSteps only for Playwright browser load tests.
Capture and view test steps
After you turn on test step capture, follow these steps to record test.step() data and view it in your load test report:
Add test.step() blocks to your script.
Wrap each logical section of your test in a test.step() block. Each step should represent a meaningful user action, such as Log in, Add item to cart, or Complete checkout.
import { test, expect } from '@playwright/test';

test('checkout flow', async ({ page }) => {
  await test.step('Navigate to store', async () => {
    await page.goto('https://demo-store.example.com');
    await expect(page.locator('.hero-banner')).toBeVisible();
  });

  await test.step('Log in', async () => {
    await page.click('[data-testid="login-btn"]');
    await page.fill('#email', 'user@example.com');
    await page.fill('#password', 'securePassword123');
    await page.click('[data-testid="submit"]');
    await expect(page.locator('.user-greeting')).toBeVisible();
  });

  await test.step('Add item to cart', async () => {
    await page.click('[data-testid="product-1"]');
    await page.click('[data-testid="add-to-cart"]');
    await expect(page.locator('.cart-count')).toHaveText('1');
  });

  await test.step('Complete checkout', async () => {
    await page.click('[data-testid="checkout"]');
    await page.fill('#card-number', '4111111111111111');
    await page.click('[data-testid="pay-now"]');
    await expect(page.locator('.order-confirmation')).toBeVisible();
  });
});
You can nest steps up to two levels deep to group related sub-actions under a parent step:
await test.step('Log in', async () => {
  await test.step('Enter credentials', async () => {
    await page.fill('#email', 'user@example.com');
    await page.fill('#password', 'securePassword123');
  });
  await test.step('Submit form', async () => {
    await page.click('[data-testid="submit"]');
  });
});
Run your load test.
Run the test the way you normally do. With test step capture turned on, BrowserStack records step data during execution. No extra run-time flags are required.
browserstack-load run --config browserstack-load.yml
View step data in the report.
After your test completes, open the report and inspect the captured steps:
- Open the test report from Test Runs in the left navigation, and select the completed run.
- Go to the Tests tab.
- Select a test case row to expand it.
- The Steps sub-table appears below the test case, with one row for each captured step.
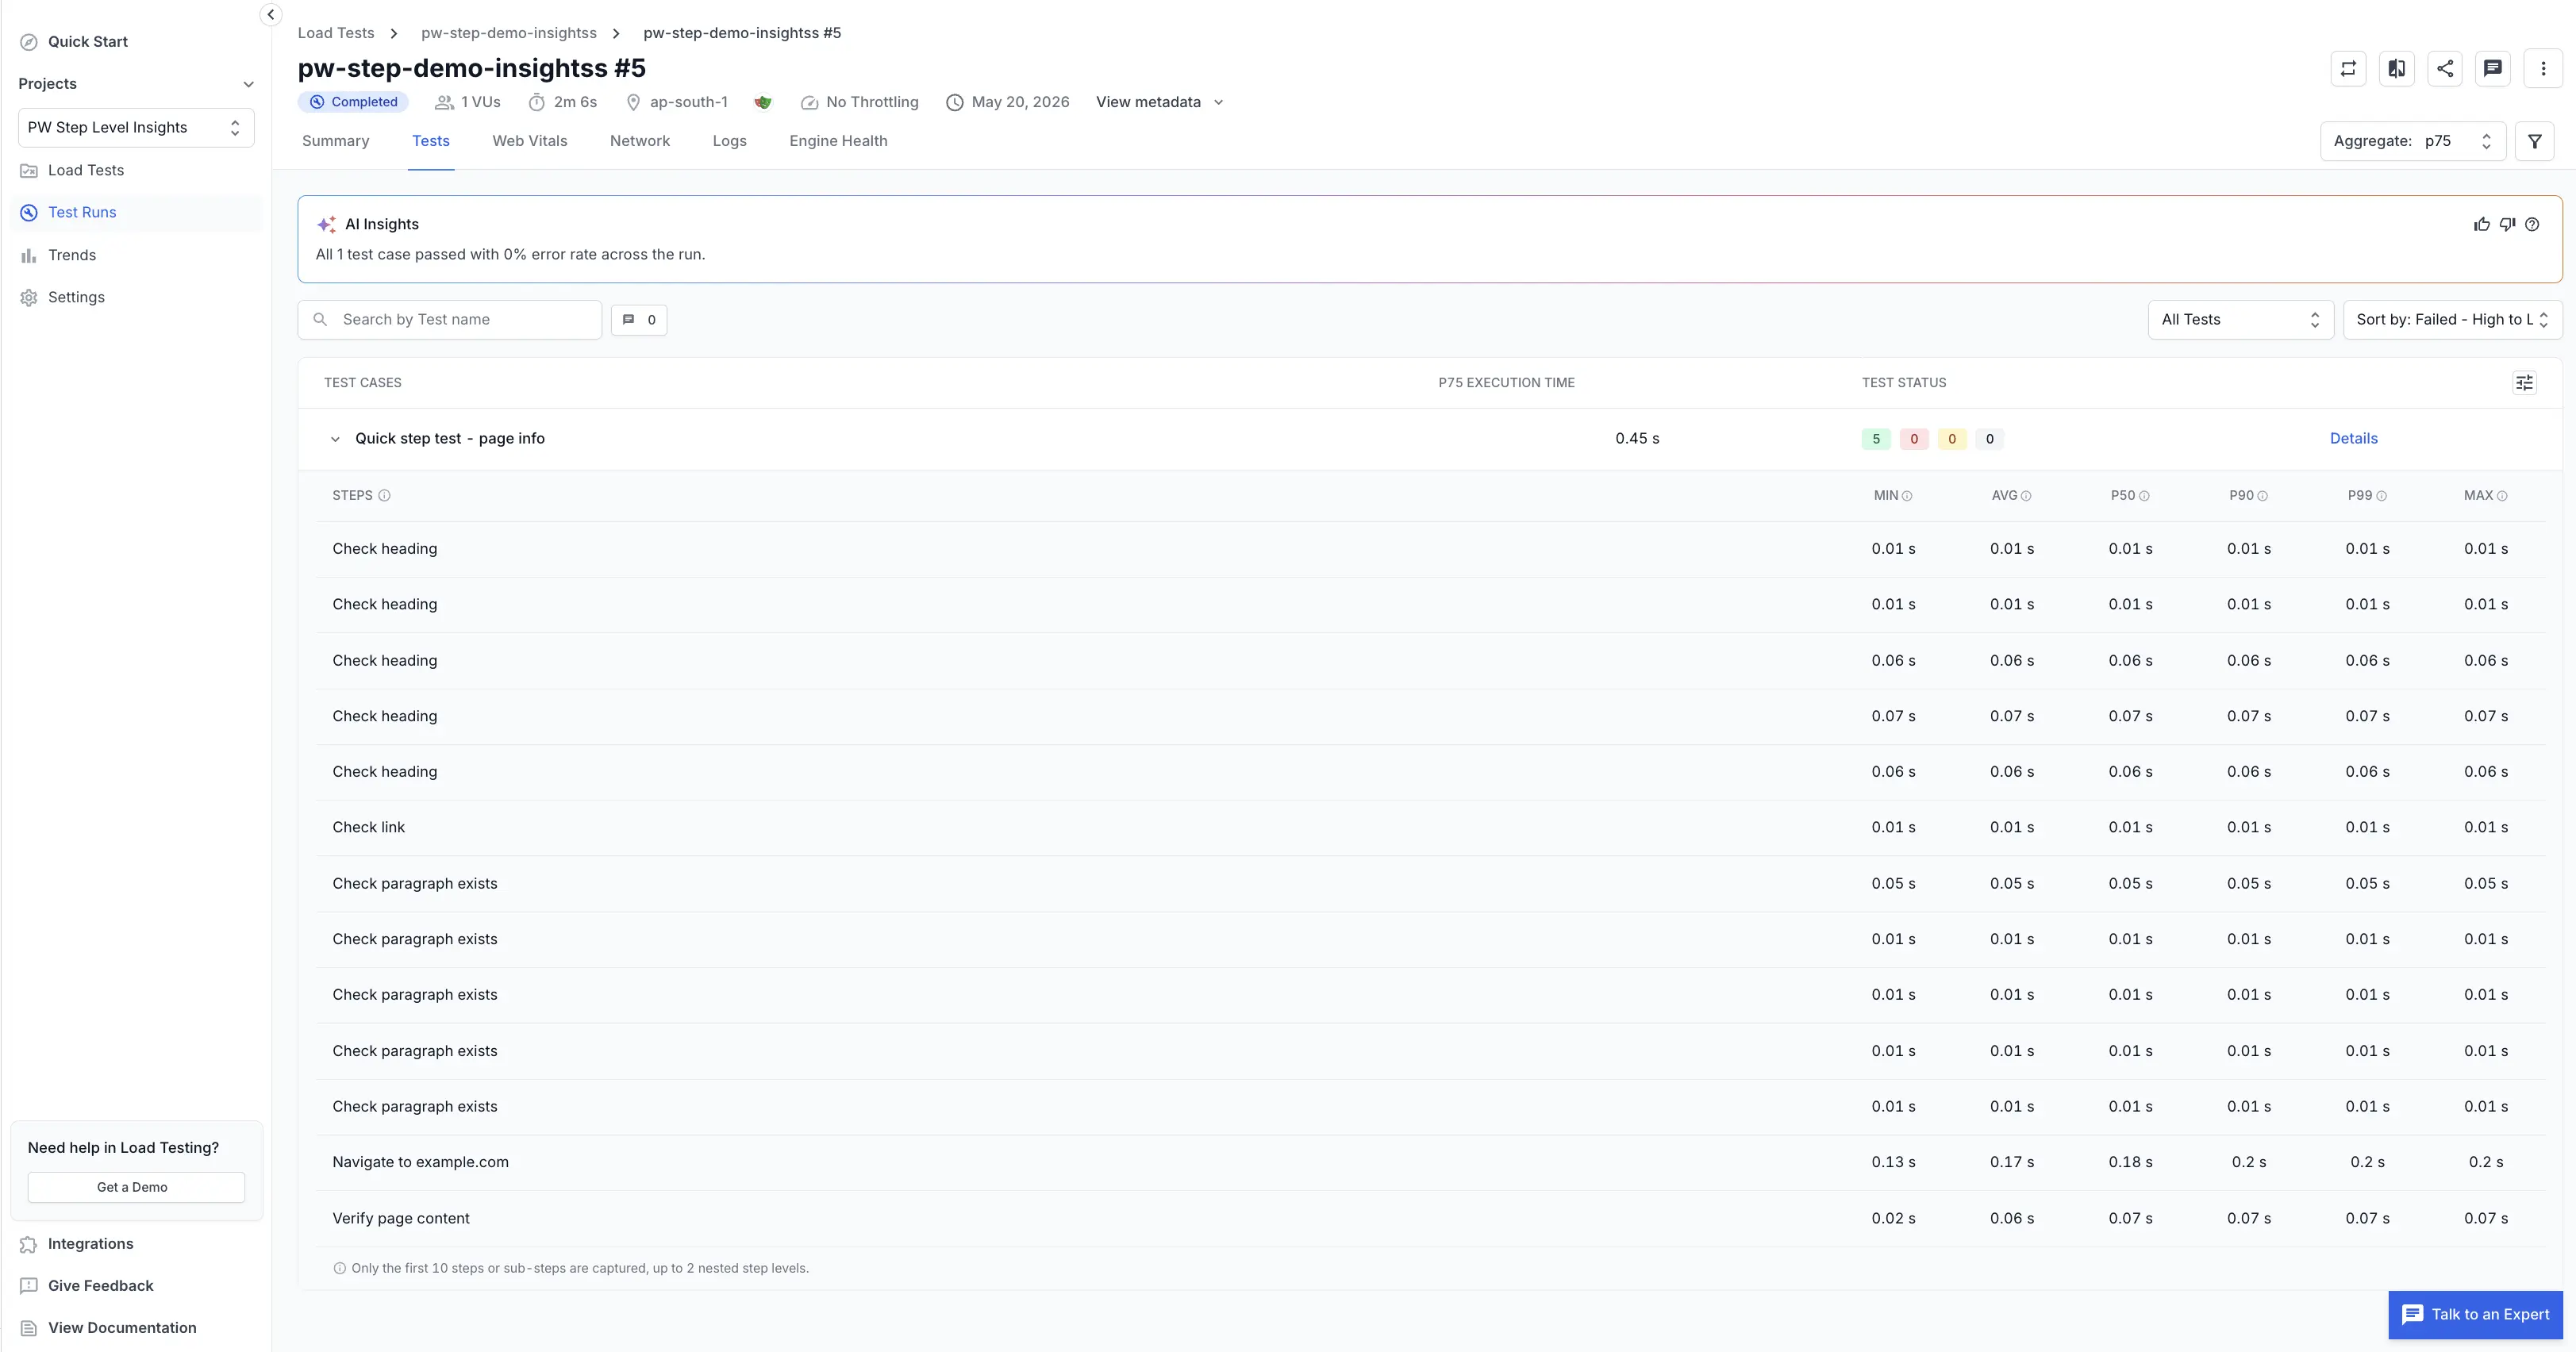
Steps sub-table columns
Each row in the Steps sub-table shows the following columns:
| Column | Description |
|---|---|
| Step | The step name from your test.step() call. Nested steps are shown as indentation under their parent. |
| Min | Fastest execution time observed across all virtual users. |
| Avg | Average execution time across all virtual users. |
| p50 | Median execution time (50th percentile). |
| p90 | 90th percentile. 90% of VU executions of this step were faster than this value. |
| p99 | 99th percentile. Surfaces tail latency that average and median values hide. |
| Max | Slowest execution time observed across all virtual users. |
All durations are in milliseconds. Nested steps appear indented under their parent. Expand or collapse a parent step to drill into sub-step timing.
Interpret the data
Use the following patterns to read step timings under load:
- Large gap between p50 and p90 or p99: some VUs are hitting a slow path. Investigate whether the step depends on external dependencies that degrade under load, such as APIs, databases, or CDNs.
- High max with low p50: occasional outliers. Likely caused by cold starts, network jitter, or contention on shared resources.
- Step duration increases across runs: compare runs to spot regressions. For example, if “Complete checkout” goes from p90 = 2s to p90 = 8s, your payment backend may not be scaling.
- Nested step dominates parent: if “Enter credentials” takes 90% of the “Log in” step’s duration, the bottleneck is in the form interaction, not the authentication API.
Limits
The following limits apply when BrowserStack captures test.step() data:
| Limit | Value |
|---|---|
| Maximum steps per test case | 10 |
| Maximum nesting depth | 2 levels |
| Supported framework | Playwright |
| Supported test type | Browser load testing |
BrowserStack captures a maximum of 10 steps per test case and supports up to 2 levels of nesting. If your test has more than 10 top-level steps, only the first 10 are recorded. Keep steps focused on key user actions rather than granular operations.
Steps beyond the 10-step limit or deeper than 2 nesting levels are silently dropped and don’t appear in the report.
Troubleshooting
If step data is missing or doesn’t match what you expect, use the following sections to identify and resolve common issues.
No step data appears in the Tests tab
-
Check that your script uses
test.step(). Only explicitly defined steps are captured. Regular Playwright actions, such as clicks, fills, and navigations outside oftest.step()blocks, are not tracked. - Check that you’re running a Playwright browser load test. Test steps are not supported for Selenium, WebdriverIO, Nightwatch, hybrid tests, or API load tests.
Step durations differ from a local Playwright run
This is expected. In a local run, you see a single execution. In a load test with hundreds of VUs, the step durations are aggregated across all VU executions. The p50 reflects the median across hundreds of runs, not a single pass. Network latency, server-side contention, and VU warm-up all affect timing under load.
Only the first 10 steps appear in a test case with more steps
BrowserStack captures a maximum of 10 steps per test case. Restructure your test to group related actions into fewer, broader steps, or use nesting to organize sub-actions under parent steps.
Related topics
- View browser test results: full overview of every tab in the browser load test report.
- Tests tab: inspect per-test status, errors, and load-vs-failure progression.
- Run a load test with Playwright: getting started guide for Playwright load tests.
- Playwright test.step() API: Playwright’s official documentation for defining steps.
We're sorry to hear that. Please share your feedback so we can do better
Contact our Support team for immediate help while we work on improving our docs.
We're continuously improving our docs. We'd love to know what you liked
We're sorry to hear that. Please share your feedback so we can do better
Contact our Support team for immediate help while we work on improving our docs.
We're continuously improving our docs. We'd love to know what you liked
Thank you for your valuable feedback!