Use the Requests tab to analyze API endpoint performance during hybrid load testing. This breaks down response times, throughput, and error rates for each API endpoint called by your tests.
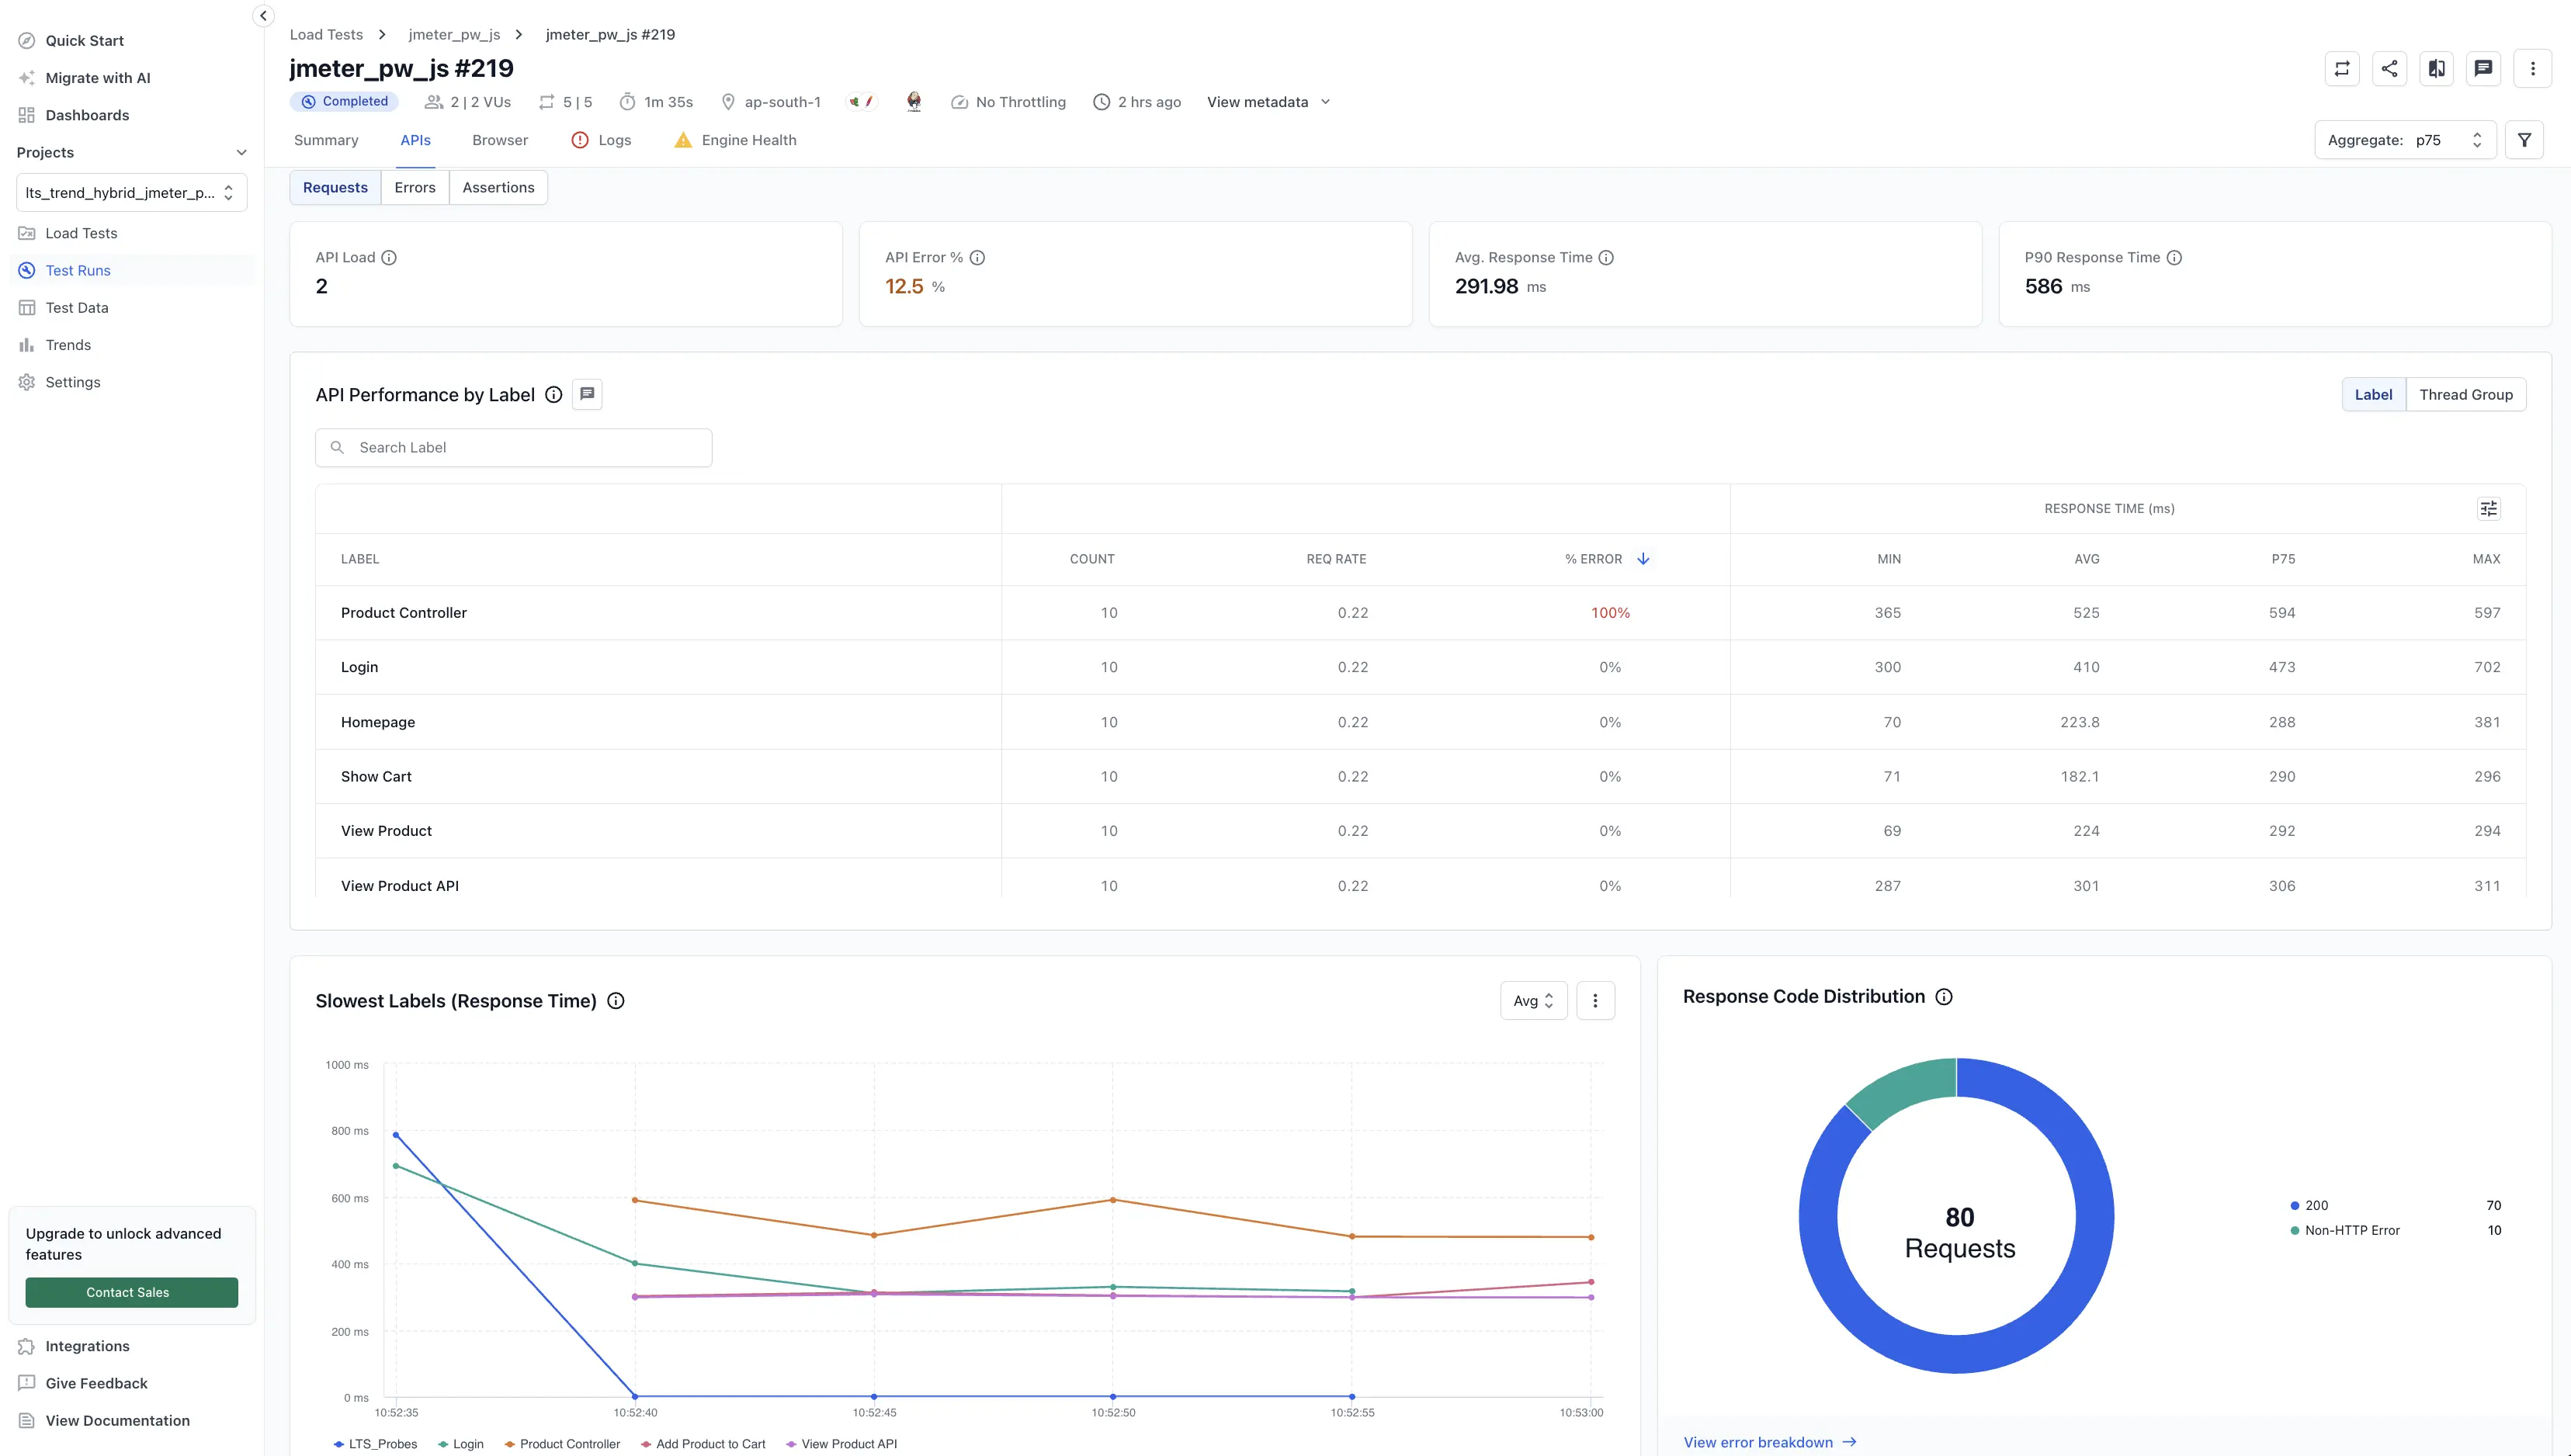
Slowest labels (response time)
The Slowest Labels time-series chart compares latency trends across your API endpoints:
- Each line represents one endpoint (or thread group in JMeter).
- X-axis: Test duration.
- Y-axis: Response time (milliseconds).
- Aggregation dropdown: Switch between Avg, P90, P95, P99, and Max to expose tail latency.
Watch for these patterns in the chart:
- Lines that climb as load increases (degradation under load)
- Lines that spike at specific times (correlate with load ramp or backend events)
- High Max values with stable Avg, which indicates single pathological requests. Investigate logs.
Response code distribution
The Response Code Distribution donut chart aggregates all responses by code:
-
200 (or 2xx): Successful responses.
-
4xx: Client errors, such as bad request or not found, usually caused by scripting issues.
-
5xx: Server errors, from backend capacity limits or failures.
-
Timeouts: Requests that timed out before receiving a response.
A large 4xx segment usually indicates test data issues or wrong endpoints. A rising 5xx segment as load increases indicates backend saturation.
The API Performance table shows per-endpoint metrics:
-
Label: API endpoint name or thread group.
-
Count: Total requests to this endpoint.
-
Req rate: Requests per second (throughput).
-
% error: Percentage of requests that failed.
-
Min, Avg, P90, P95, P99, and Max: Response time percentiles.
Sort by % error to fix completely broken flows first. Compare Avg vs P99 to identify high variance (intermittent bottlenecks). A large gap between Avg and P99 suggests some requests hit different code paths or resource constraints.
Drill into any endpoint row to see response code distribution and response body examples for that specific endpoint.
Use the Errors tab to analyze API failures during hybrid load testing and identify which endpoints fail first under load.
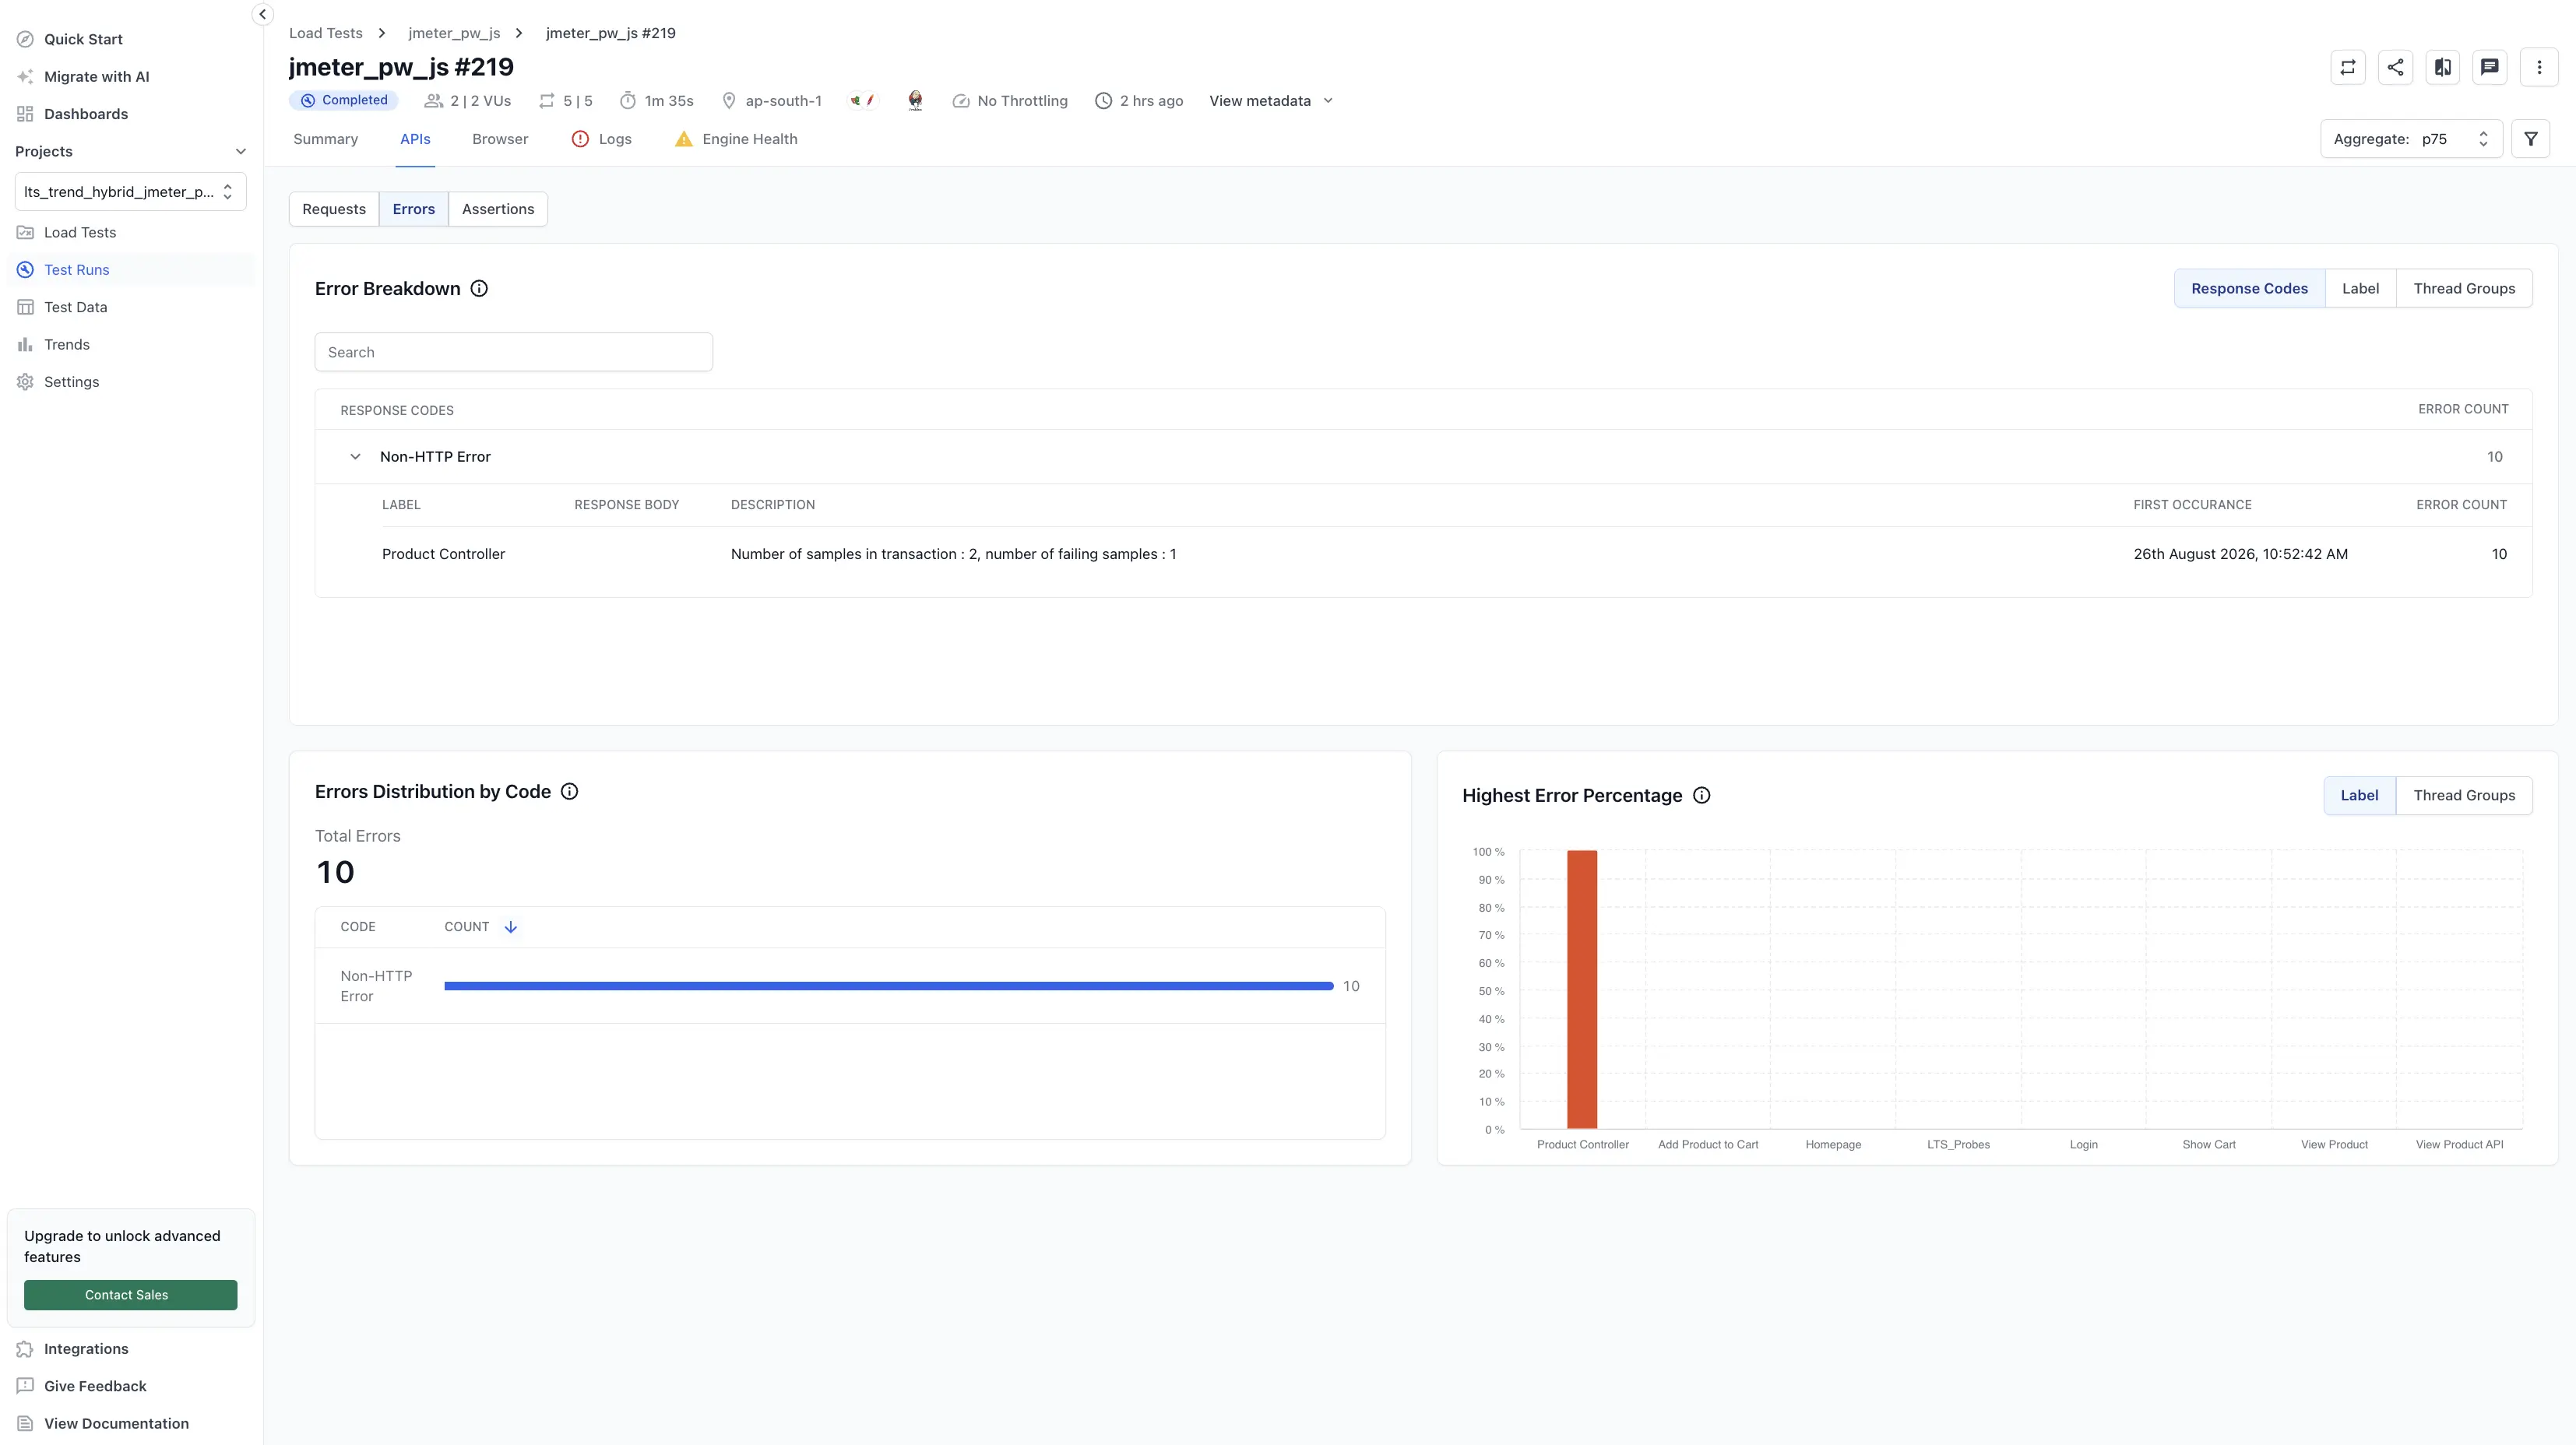
Error distribution by code
This section aggregates every failed request by HTTP response code:
-
Total errors: Sum of all failed requests (helps gauge overall test health)
-
Bar chart by code: Each bar shows a status code, such as 404, 500, 503, or timeout, with its count.
Use these readings to interpret the distribution:
-
Large 404 count: Endpoints don’t exist or paths are wrong. Check test data and script.
-
Mixed 5xx codes: Backend service is crashing or hitting limits under the load.
-
Timeout count: Backend too slow or overwhelmed. Increase backend capacity or reduce load.
Highest error percentage
The Highest Error Percentage chart ranks endpoints by the percentage of their requests that failed:
- A 100% bar means all requests to that endpoint failed (critical issue)
- A 20% bar on a checkout flow is more urgent than 5% on a search
Look for endpoints with high percentage to fix first. Then look for endpoints with high count to fix next.
Error breakdown table
The Error Breakdown table lists each endpoint with error counts and first occurrence time:
-
Label: API endpoint name
-
Error count: Total requests to this endpoint that failed
-
First occurrence: When the first failure happened (correlate with load ramp)
-
Response code: Predominant error code for failures in this endpoint (click to expand for breakdown)
A first occurrence that matches a specific load level, for example the 5 minute mark when load hit 100 VUs, indicates that endpoint starts failing at that load.
Debugging strategy
Follow these steps to move from symptom to root cause:
-
Identify scope: Determine whether all endpoints fail or only specific ones.
-
Identify trigger: Determine the load at which failures start.
-
Check backend logs: Look for a service crash, rate limiting, or exhausted DB connections.
-
Check script data: Confirm your test fixtures are sufficient, for example, enough user accounts.
-
Re-run smaller: Test the same endpoint with half the load to confirm the breaking point.
Next steps
After prioritizing and fixing high-volume errors, re-run the test focusing on previously failing flows. Target an error rate approaching zero for critical transactional paths (checkout, authentication) before scaling user counts.
If you continue to see unexplained errors, contact BrowserStack Support with the test run link and timestamps for deeper investigation.
The Assertions tab lists every script-defined assertion evaluated during your run. Assertions verify that your API behaved as expected, for example, that a response code was 200, a JSON field existed, or response time stayed under a threshold, and let you spot regressions without combing through raw logs.
Assertions are auto-detected from your script, so no project setting changes are required.
Where to find assertions
Assertions appear in different places depending on the test type:
-
API-only (protocol) tests: open a completed test run and look for the Assertions sub-tab under the APIs tab.
-
Hybrid tests: open the run and go to the APIs tab. The Assertions sub-tab lists API assertions.
Assertion fields
Each row on the Assertions sub-tab includes the following fields:
| Field |
Description |
| Name |
The assertion label from your script. |
| Pass Count / Fail Count |
Execution counts across all virtual users. |
| Failed % |
Percentage of executions that failed. |
| Failure Message |
Summary of the failure. |
| First Occurrence |
Timestamp of the first failure. |
Use assertions to debug a run
The Assertions tab is the fastest way to identify which assertion failed and at what load level:
-
Quick failure overview: scan the Failed % column to identify which assertions had the highest failure rates.
-
Failure context: read the Failure Message to see why the assertion failed (for example, “expected status 200, got 404”).
-
Correlation with load: compare the First Occurrence timestamp across assertions to see if failures clustered at a specific point in the test, correlating with load spikes.
-
Failure drill-down: click View details on a failed assertion to inspect the Response Code Distribution and Response Body to understand what the API returned.
Drill into an assertion
Select any row or click View details to open the per-assertion drill-in view. This view shows:
-
Response Code Distribution: a breakdown of HTTP response codes received for this assertion, including the code, count, description, and first occurrence timestamp.
-
Response Body (when enabled): the captured response body for requests, when Capture response details is enabled on the test. This helps you understand what the API returned and why the assertion failed.
Use assertions to set test thresholds
You can use assertion outcomes as a pass or fail gate for the overall test. For example, you can set a threshold that fails the run if total assertion failures exceed a limit. To configure this, see Set thresholds.

 Join our Discord