
 Join our Discord
WebSocket load test results
Load test WebSocket endpoints and view their sessions, connection times, errors, and assertions in k6 or JMeter test reports.
When a k6 or JMeter script opens a WebSocket connection, the test report includes WebSocket metrics. This guide helps you understand where these metrics appear, what each one means, and how to read WebSocket errors and assertions.
Supported scripts
WebSocket reporting is available for the following scripts:
- k6 scripts that import any of
k6/ws,k6/websockets, ork6/experimental/websockets. - JMeter scripts built with the WebSocket Samplers plugin by Peter Doornbosch.
You don’t need to bring your own WebSocket Samplers plugin .jar. BrowserStack includes the plugin by Peter Doornbosch in every JMeter run. The JMeter-WebSocketSampler plugin by Maciej Zaleski isn’t supported.
Prerequisites
To read a WebSocket report, you need a completed k6 or JMeter load test run that used WebSockets. To run one, see Protocol load testing using k6 or Protocol load testing using JMeter.
Where WebSocket data appears
WebSocket data appears in the following places in the report:
- Summary tab: The WEBSOCKET METRICS tiles and the WebSocket Performance Timeline chart.
- APIs > Requests: Per-request WebSocket performance and connection graphs.
- APIs > Errors: The WebSocket error breakdown and connection error graphs.
- APIs > Assertions: Pass and fail counts for WebSocket checks in k6 or assertions in JMeter.
On the APIs tab, select WebSocket in the Protocol dropdown above the sub-tabs to show WebSocket data.
Summary tab
Open the Summary tab and scroll to WEBSOCKET METRICS. The section shows the following tiles:
| Tile | What it shows |
|---|---|
| Session count | WebSocket sessions in the run. A session is one WebSocket connection that a VU opens. |
| Max concurrent sessions | Most connections open at the same time, as one run-level number across all load zones. |
| Connection error % | Failed opens divided by all connection attempts. Connection attempts are the successful sessions plus the failed opens. An attempt that never reached status 101 is a failed open. For example, 5% means that 5 of every 100 attempts never connected. |
| Avg. msgs sent | Average messages sent per second. |
| Avg. msgs received | Average messages received per second. |
| Time to Connect | Handshake time to reach status 101, at the percentile set in the Aggregate selector. The default is p75. |
Below the tiles, the WebSocket Performance Timeline chart plots sessions held, messages sent and received per second, connection error %, and P95 connect time over the course of the run.
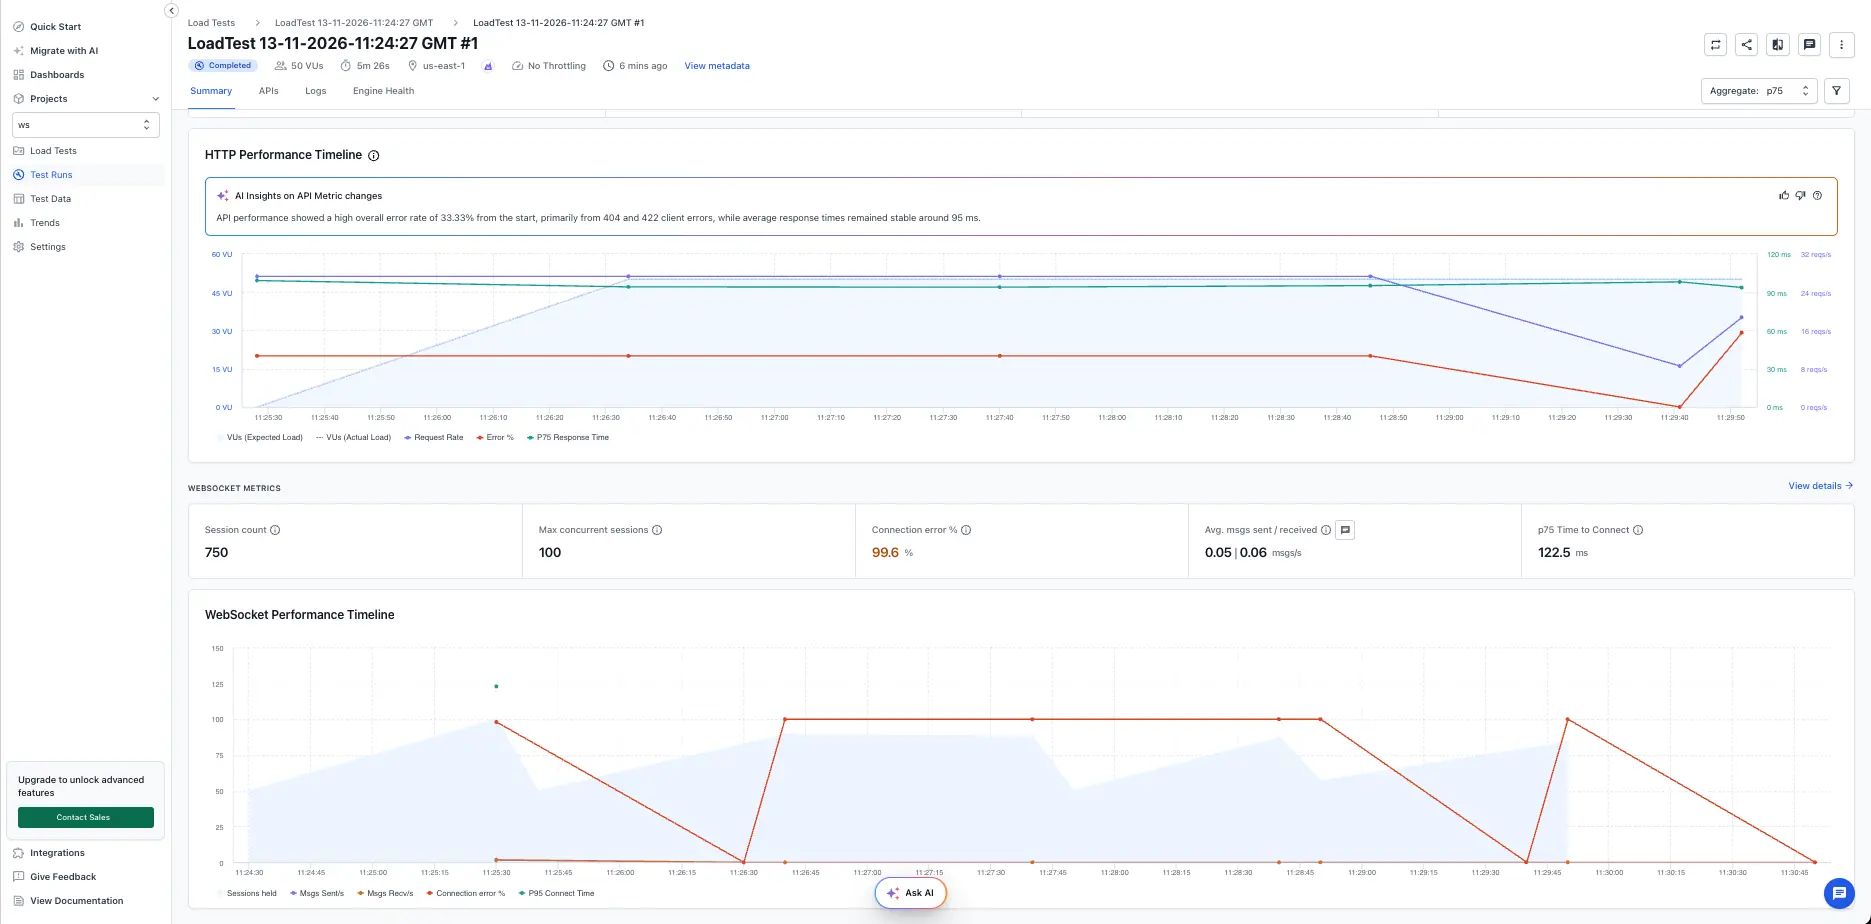
Connection error % counts only failures to open. A session that opened and later dropped isn’t counted. To investigate failed connections, review the WebSocket errors.
Requests
Open APIs > Requests. With Protocol set to WebSocket, the WebSocket Performance by Request table shows one row per WebSocket request. Rows are named by request URL for k6 and by sampler label for JMeter. To change how the rows are grouped, use the options at the top-right corner of the table:
- k6: Request, Group, or API Scenarios. Group groups the rows by k6 group, and API Scenarios groups them by scenario. Requests outside a k6 group appear only in the Request view.
- JMeter: Request or Thread Group.
The table shows the following columns:
| Column | What it shows |
|---|---|
| Request | The request URL for k6, or the sampler label for JMeter. |
| Sessions | WebSocket sessions for the request. |
| Msg sent/s and Msg recv/s | Messages sent and received per second. |
| Ping (ms) | Average ping time. |
| WS Error % | Connection error percentage for the request. |
| Connection time (ms) | Minimum, average, aggregate percentile, and maximum handshake time. |
Below the table, WebSocket Performance graphs shows the connection time and status code charts:
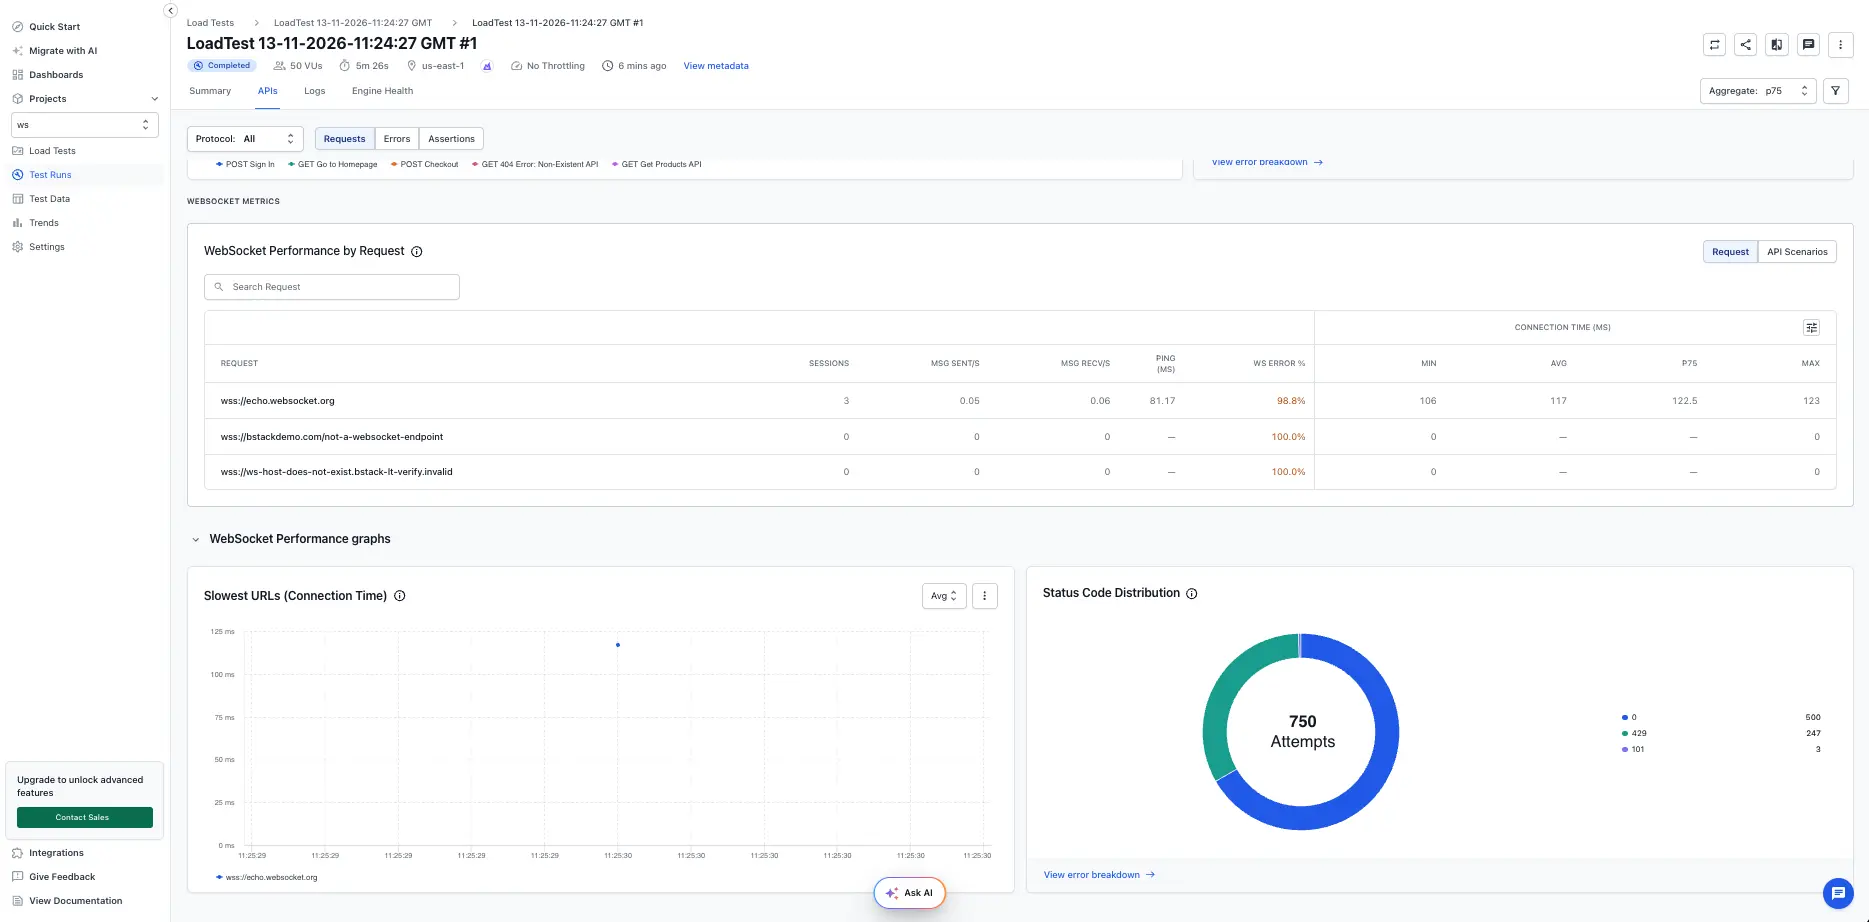
Search for a request
To find a request, type part of its name in Search Request. The table shows only the matching rows.

Show or hide columns
To choose the columns in the table, follow these steps:
- Select the column settings icon at the top-right corner of the table.
- In Select Columns, select the eye icon next to a column to show or hide it.
- Select Confirm.
To restore the default columns, select Reset.
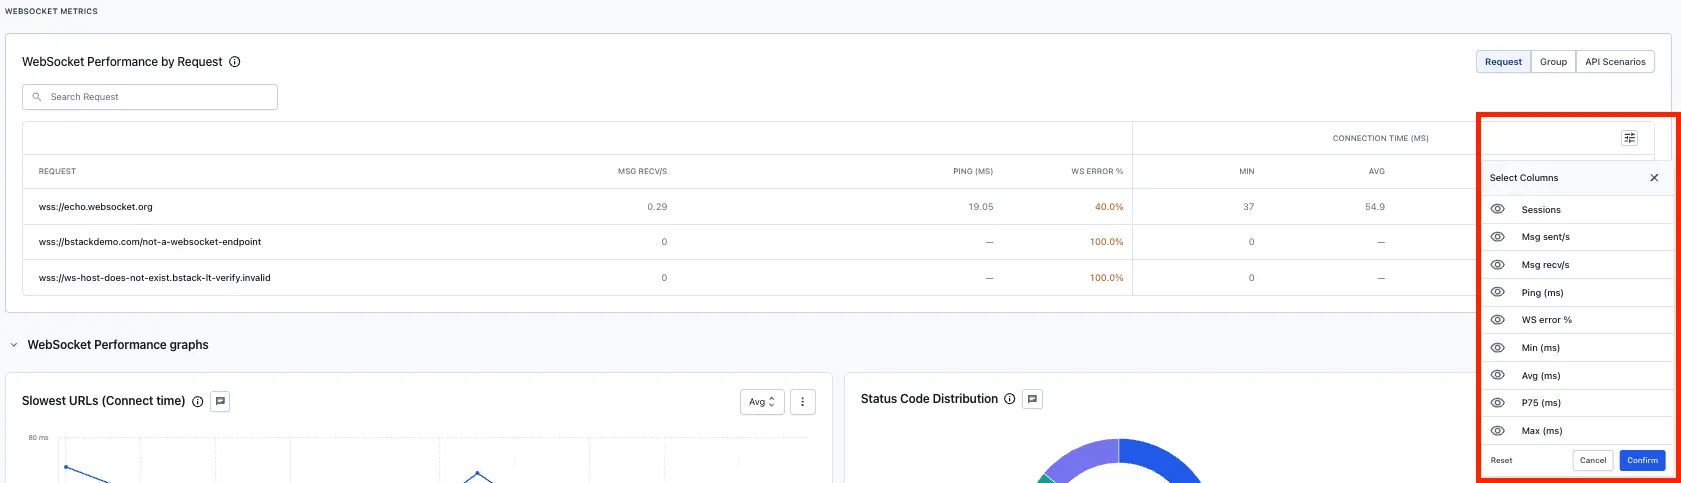
Slowest URLs chart
The Slowest URLs (Connect time) chart plots the connection time of each request over the run. Use the aggregate dropdown to switch between Avg, Min, Max, Median, P90, P95, and P99.
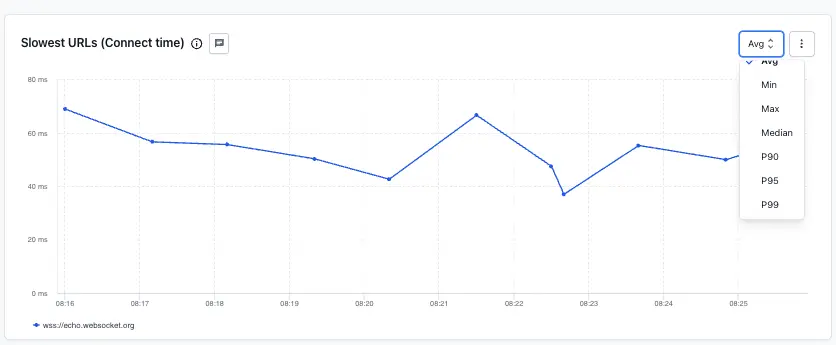
Status code distribution chart
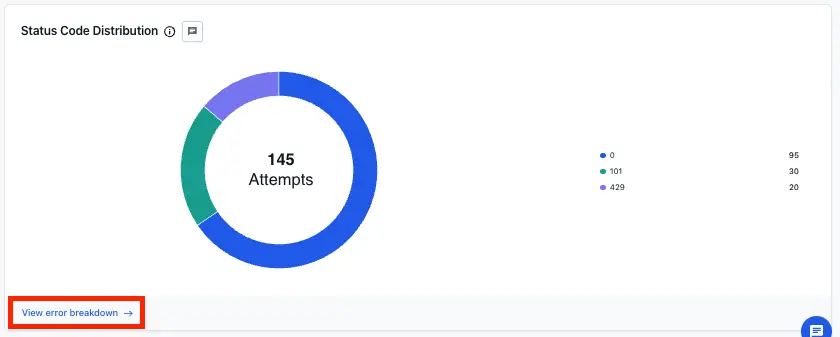
The Status Code Distribution chart shows the total connection attempts, split by handshake status code. For example, 101 is a successful connection, 0 is a transport error, and 429 is a rate-limited connection. Select View error breakdown to open the Errors sub-tab.
Errors
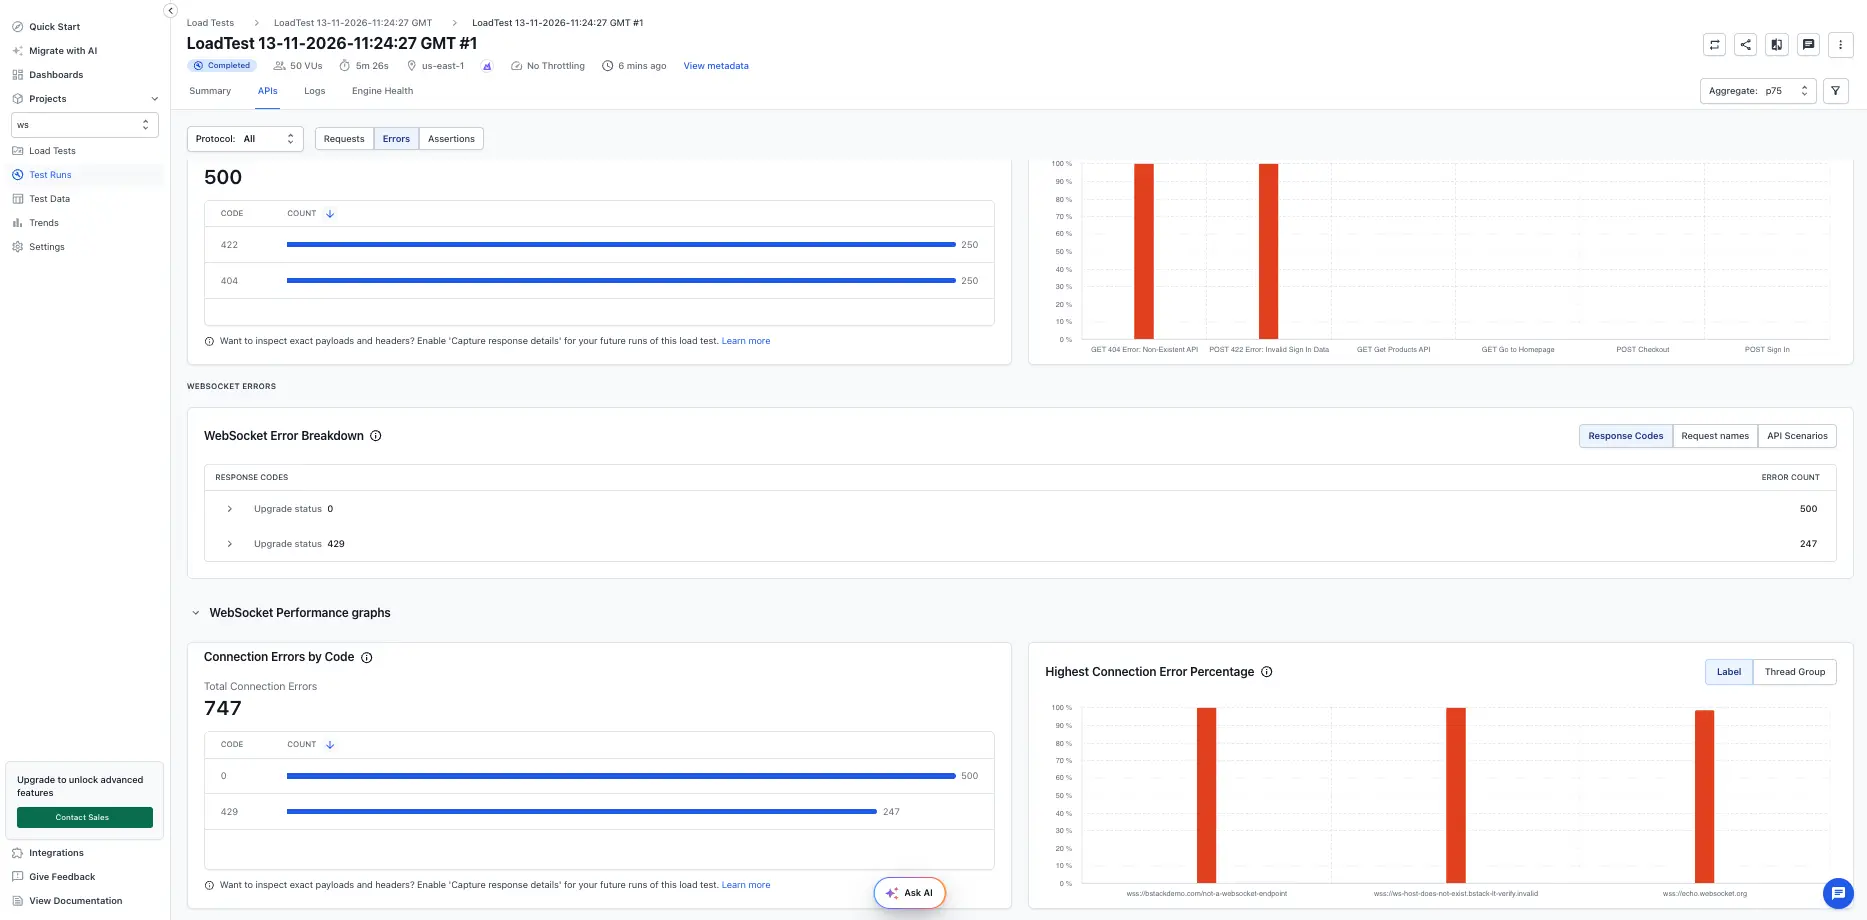
Open APIs > Errors. With Protocol set to WebSocket, the WebSocket Error Breakdown lists failed connections by upgrade status code, with the error count for each. Expand a row to see more detail.
Group the breakdown by one of the following options:
- k6: Response Codes, Request names, or API Scenarios.
- JMeter: Response Codes, Request, or Thread Group.
Below the breakdown, WebSocket Performance graphs shows the connection error charts:
Assertion failures are tracked in the Assertions sub-tab and aren’t counted in the WebSocket error breakdown.
Connection errors by code chart
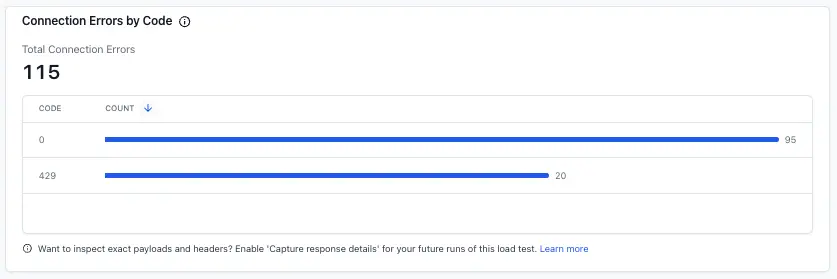
The Connection Errors by Code chart shows the total connection errors and a bar for each status code, sorted by count.
Highest connection error percentage chart
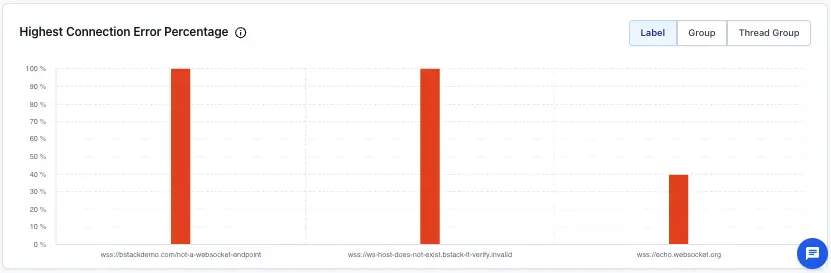
The Highest Connection Error Percentage chart shows the connection error percentage for each request. Switch between Label, Group, and Thread Group to change how the bars are grouped.
Error codes
The codes in the error breakdown depend on the engine that ran your script. Select your engine to view the codes that might appear:
k6 reports the handshake HTTP status code for every connection attempt. The following table lists the status codes:
| Status code | Name | Meaning |
|---|---|---|
| 101 | Switching Protocols | The connection opened successfully. |
| 200 | OK | The endpoint responded without upgrading the connection. |
| 302 | Found | The server returned a redirect. WebSocket upgrades don’t follow redirects. |
| 400 | Bad Request | The upgrade request is malformed. |
| 401 | Unauthorized | Authentication is required or the token is invalid. |
| 403 | Forbidden | The server rejected the upgrade. Check your credentials or origin. |
| 404 | Not Found | The endpoint doesn’t exist. |
| 426 | Upgrade Required | The server expects a different protocol version. |
| 429 | Too Many Requests | The server is rate-limiting connections. |
| 500 | Internal Server Error | The server failed while handling the upgrade. |
| 502 | Bad Gateway | An upstream server returned an invalid response. |
| 503 | Service Unavailable | The server refused the upgrade. |
| 504 | Gateway Timeout | An upstream server didn’t respond in time. |
| 0 | Transport error | The connection failed before any HTTP response. Causes include DNS failures, TLS errors, and refused or reset connections. |
k6 doesn’t capture close codes, so a k6 run doesn’t show close code rows.
Assertions
Open APIs > Assertions. WebSocket checks in k6 and assertions in JMeter appear in the Assertions Breakdown, grouped by label. Expand a label to see the pass and fail counts, failure message, and first occurrence for each assertion.
Thresholds
To fail a run on WebSocket metrics, add BrowserStack thresholds for them. In the threshold builder, the metric dropdown lists the WebSocket metrics under WEBSOCKET.
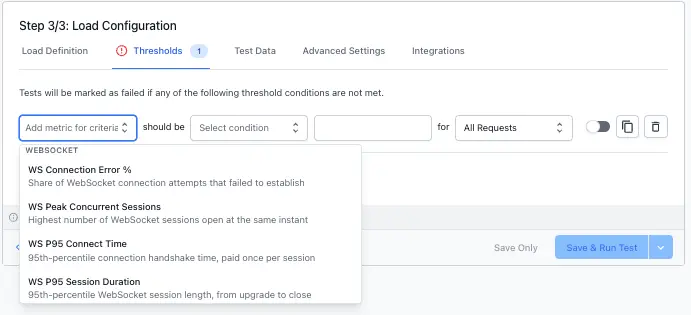
For the available metrics, units, CLI keys, and scoping, see WebSocket metrics in Set thresholds.
WebSocket metrics outside the report
WebSocket metrics also appear outside the test report, so you can compare runs, track changes over time, and share results.
Compare runs
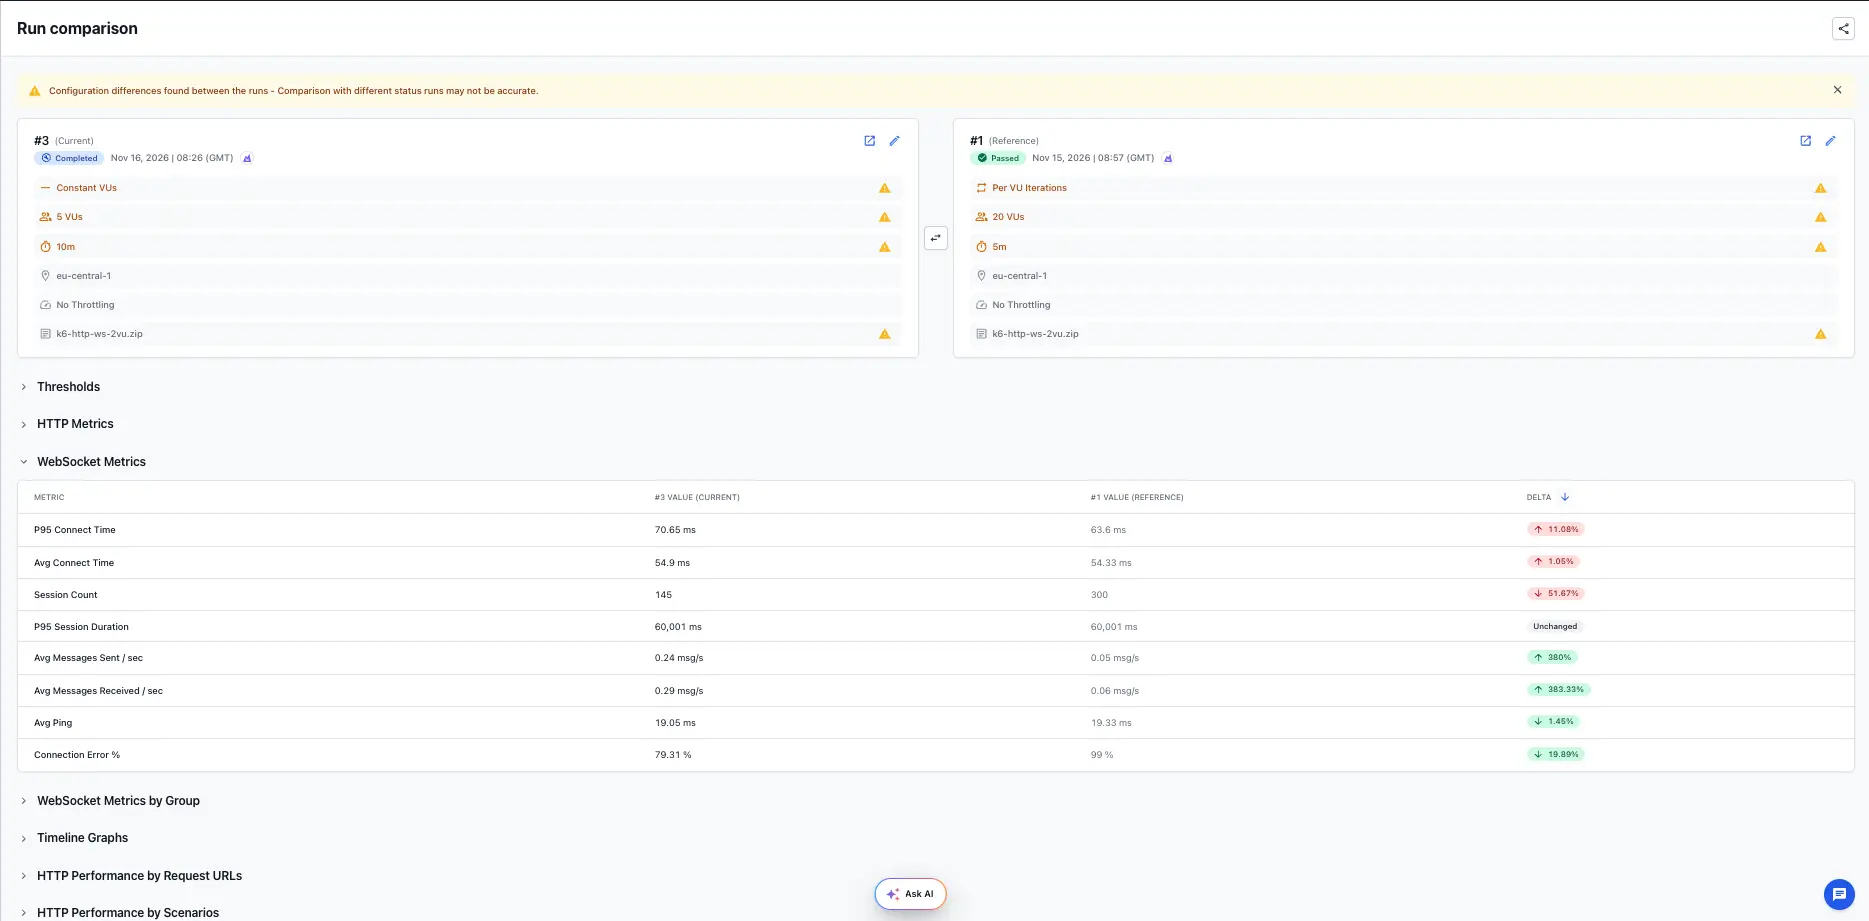
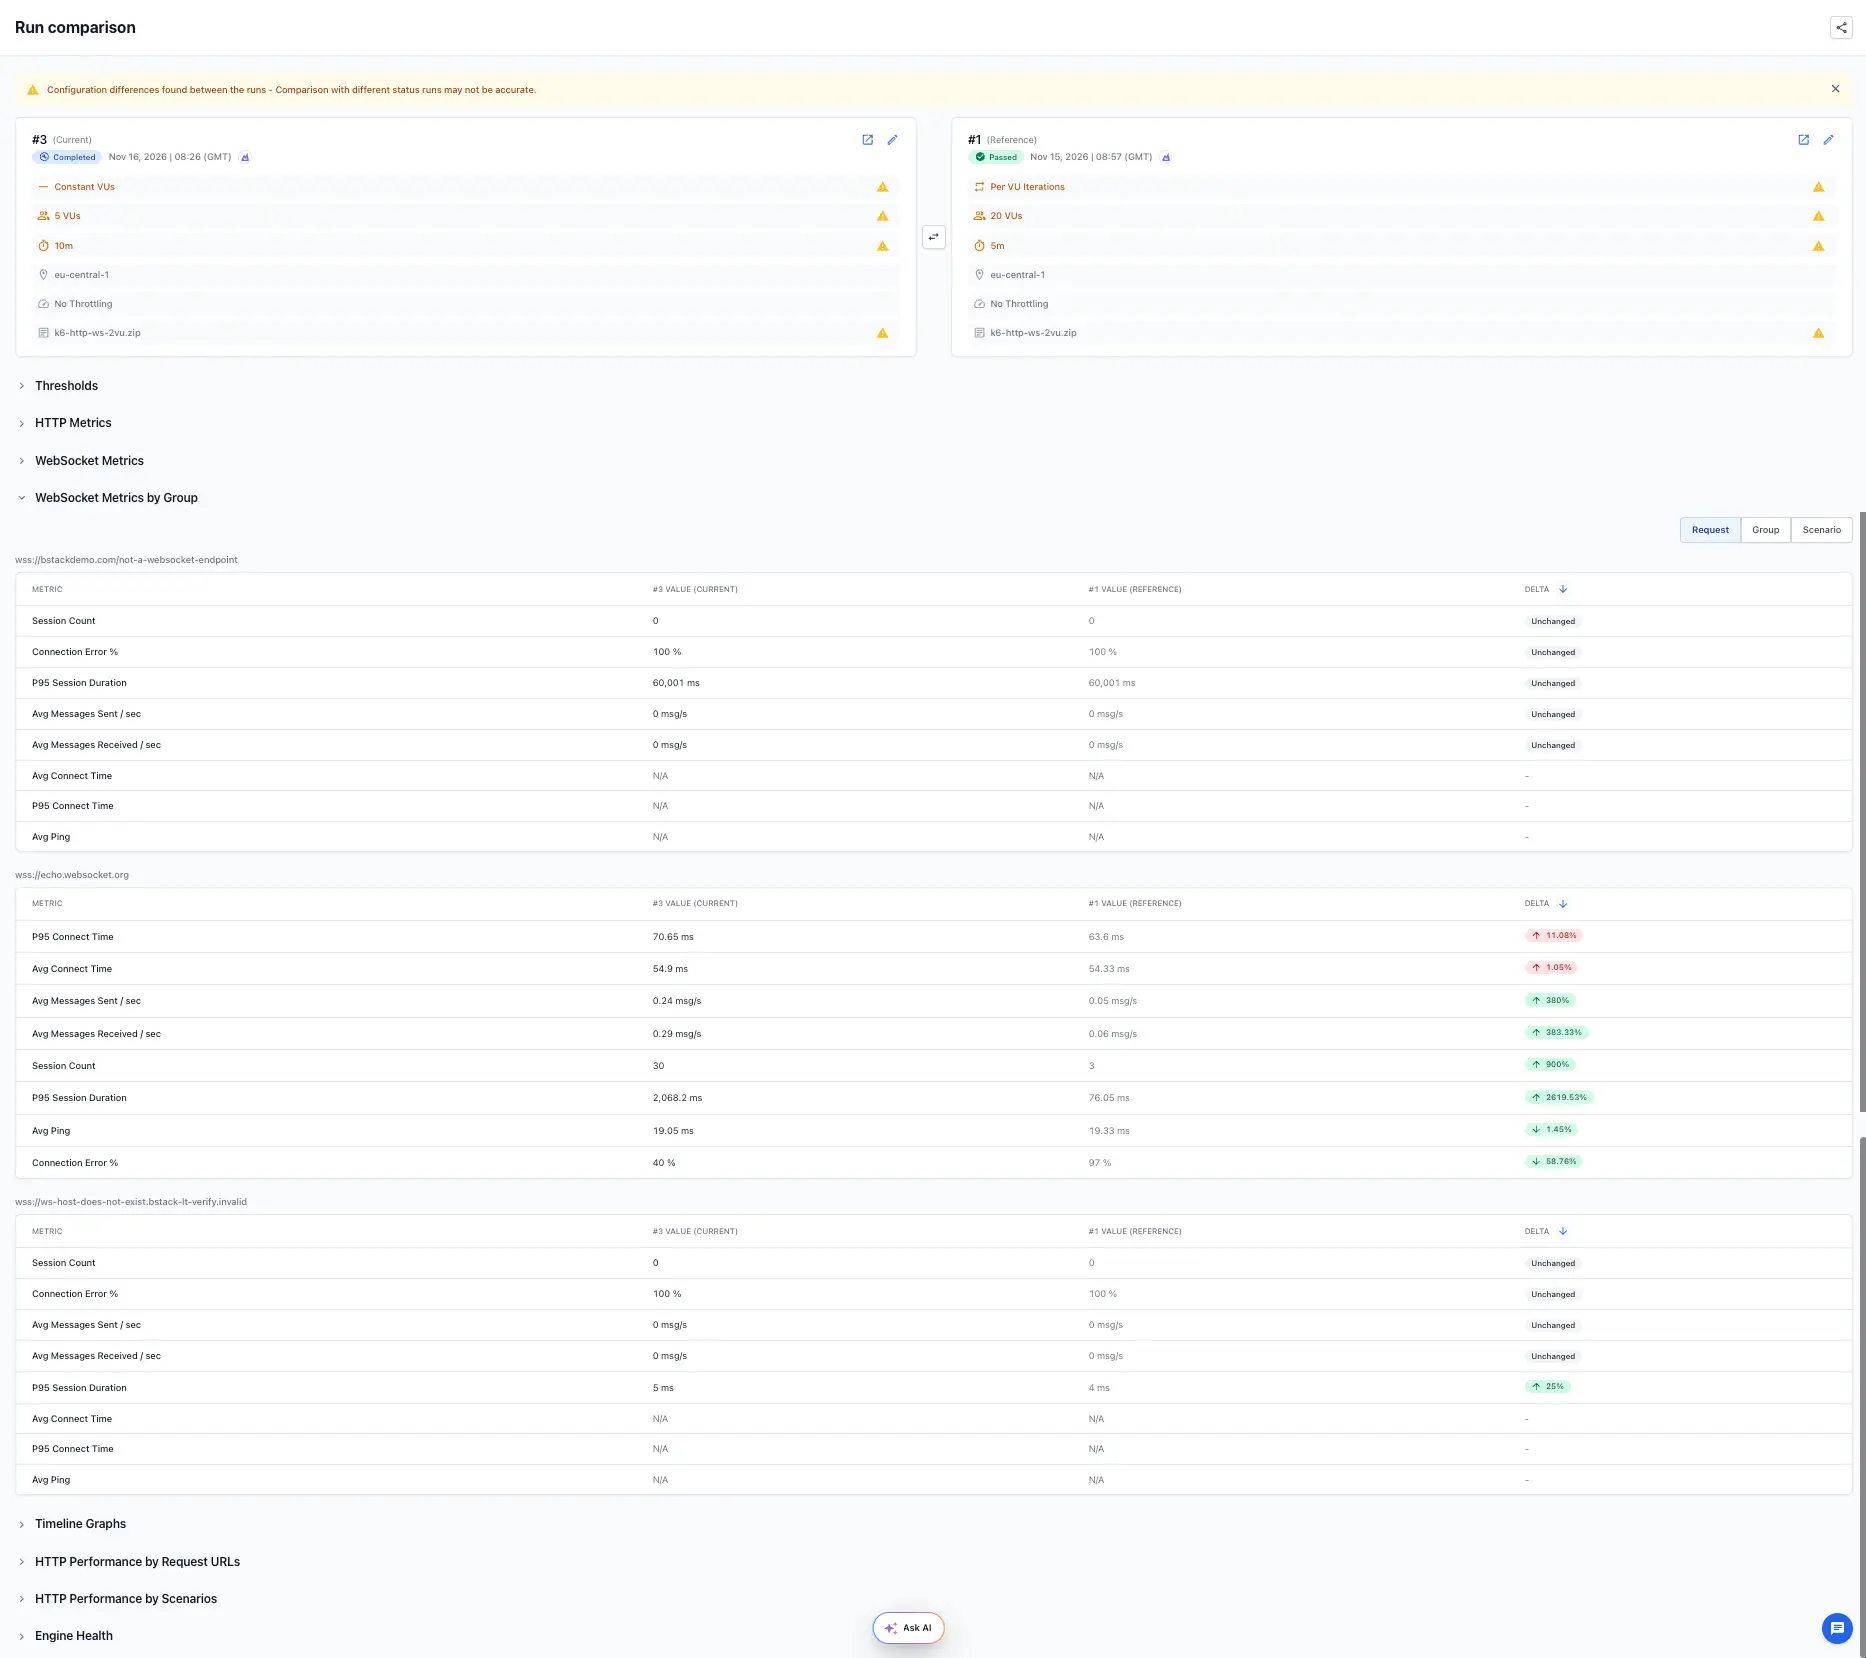
When you compare two runs, the Run comparison page adds the following WebSocket sections:
- WebSocket Metrics: Each WebSocket metric for both runs, with the delta between them.
- WebSocket Metrics by Group: The same metrics for each request, group, or scenario. Switch between Request, Group, and Scenario.
Trends
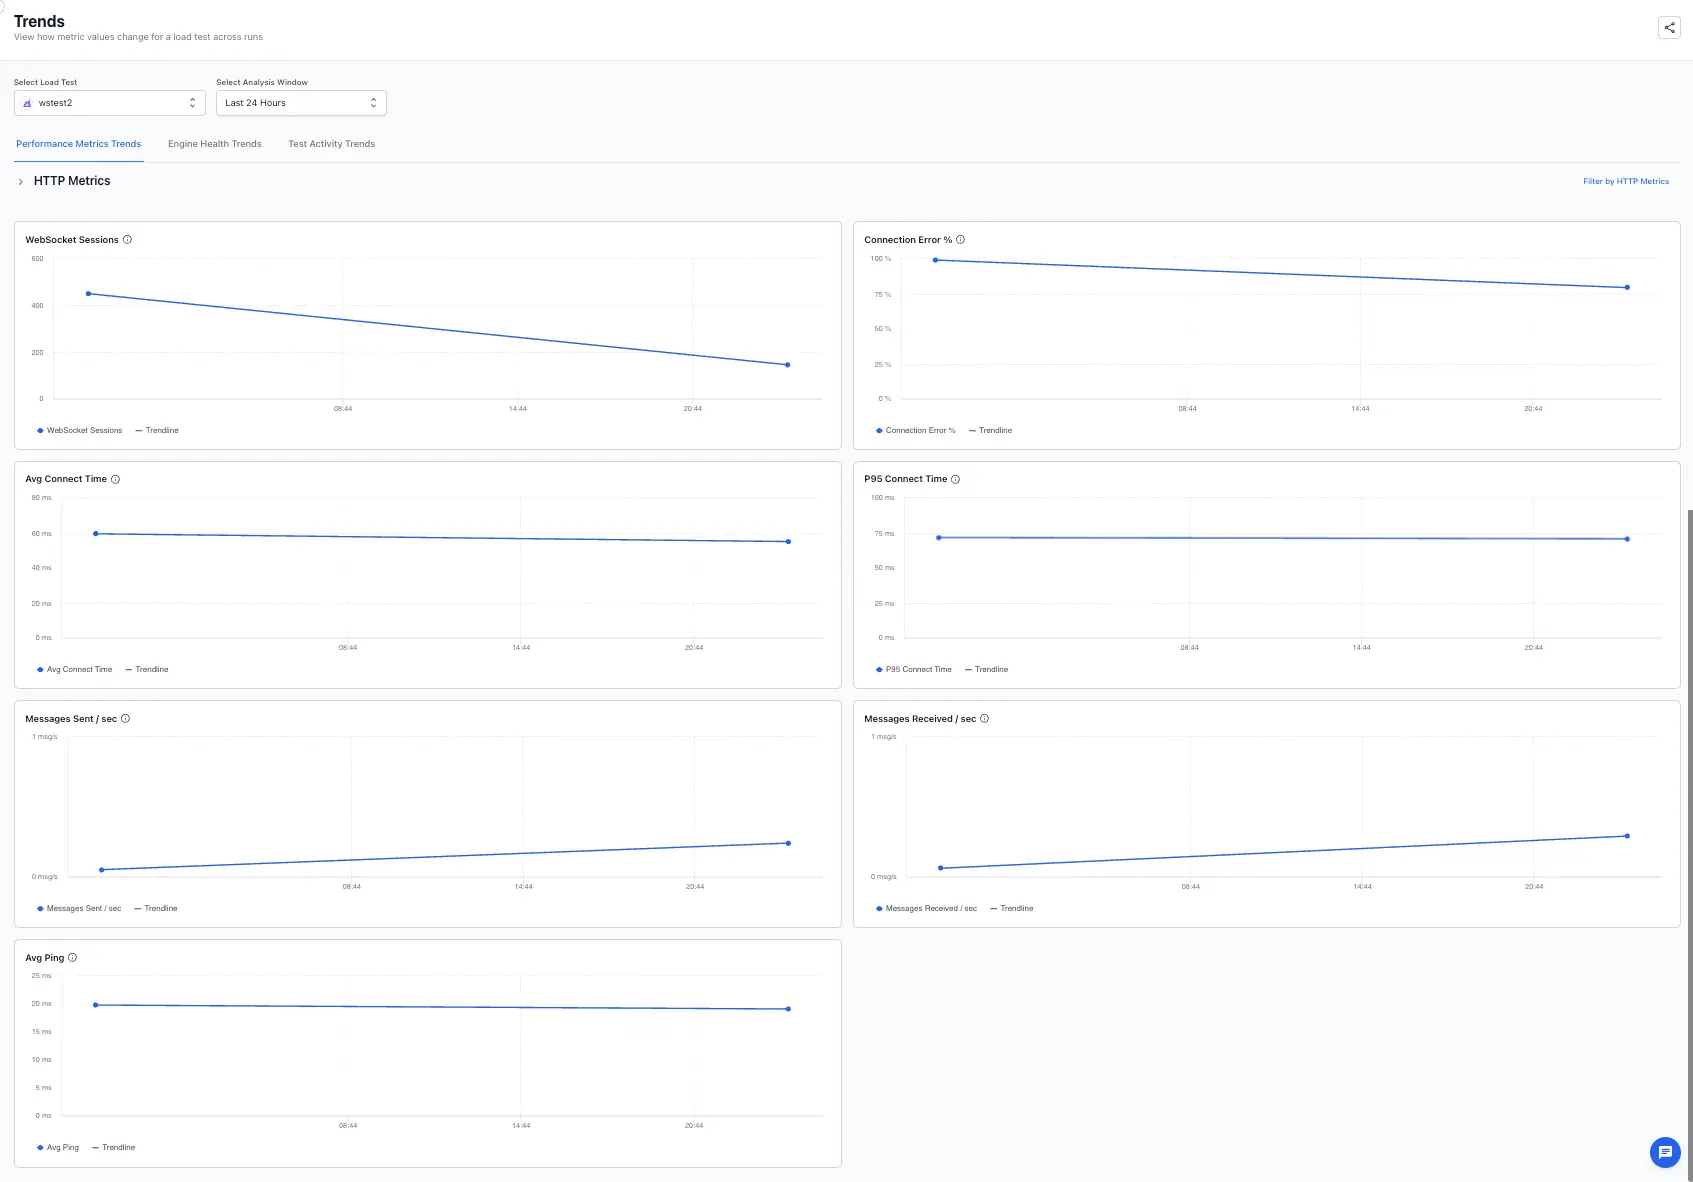
On the Performance Metrics Trends tab of Trends, WebSocket charts plot each metric across the runs of a load test, with a trendline. The charts cover WebSocket sessions, connection error %, average and P95 connect time, messages sent and received per second, and average ping.
PDF report
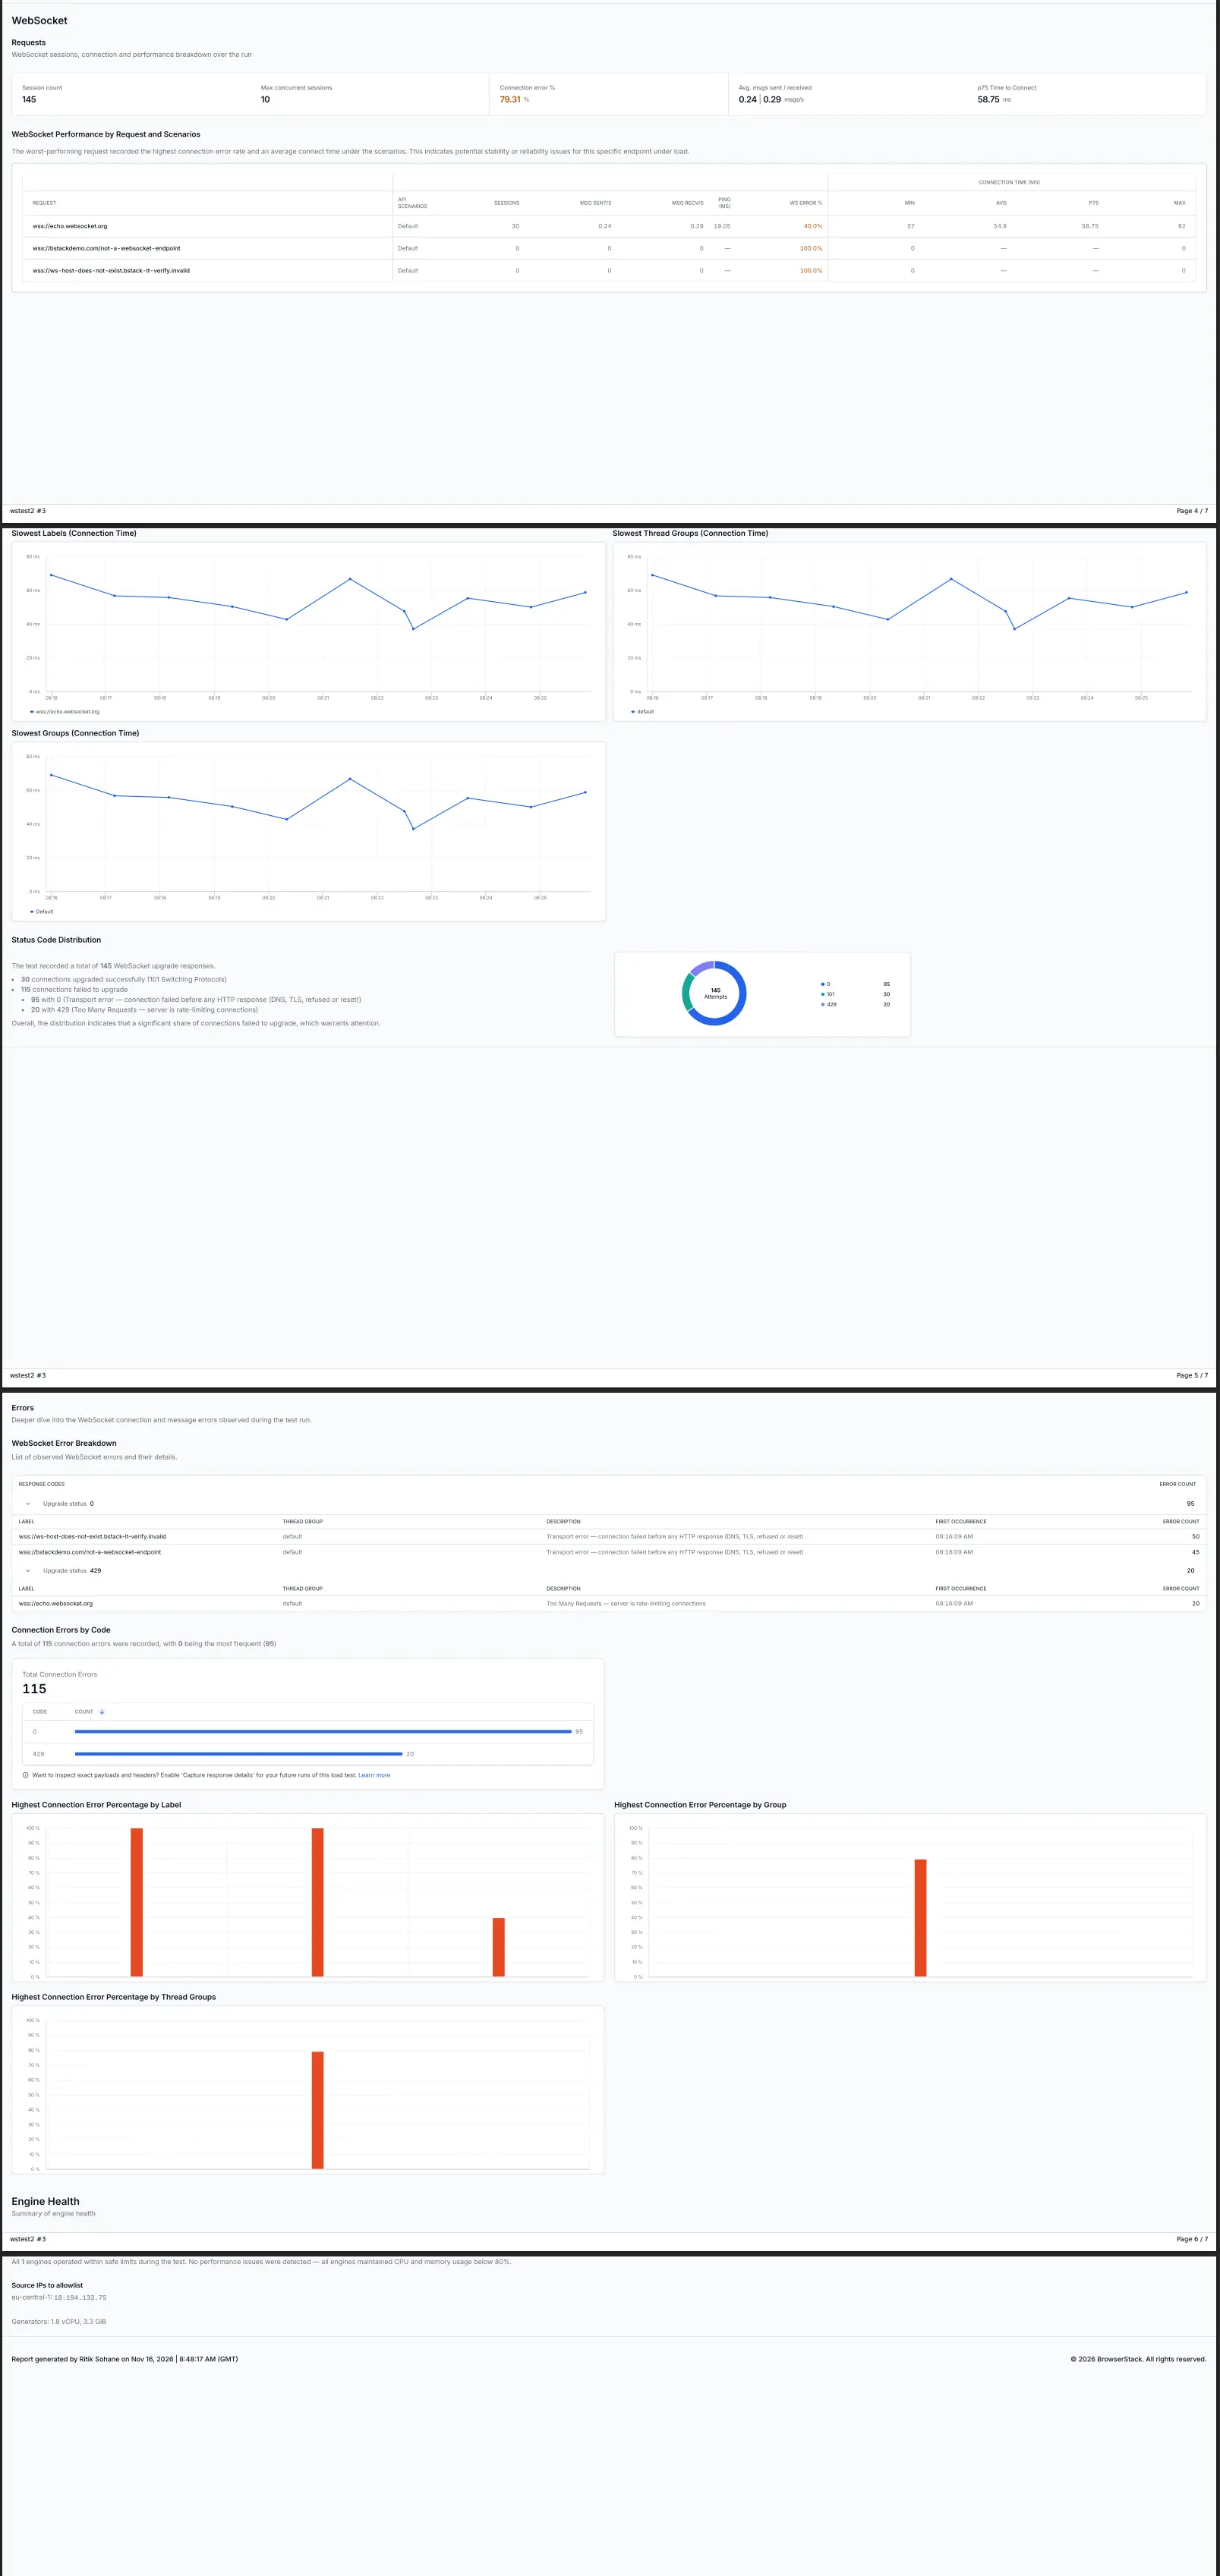
When you download the report as a PDF, it includes a WebSocket section. The section covers the WebSocket metrics, the per-request table, the connection time and status code charts, and the WebSocket error breakdown.
Custom dashboards
Add WebSocket metrics to a custom dashboard to track them alongside your other charts.
CSV export
When you export a report to CSV, WebSocket data is in separate files that have _websocket_ in the name.
Related resources
- Protocol load testing using k6: Run a k6 script on BrowserStack.
- Protocol load testing using JMeter: Run a JMeter script on BrowserStack.
- Set thresholds: Define pass or fail criteria from the builder or the CLI.
- View protocol test results: Review the report header controls and tabs.
- View hybrid test results: Review the tabs in a hybrid report.
We're sorry to hear that. Please share your feedback so we can do better
Contact our Support team for immediate help while we work on improving our docs.
We're continuously improving our docs. We'd love to know what you liked
We're sorry to hear that. Please share your feedback so we can do better
Contact our Support team for immediate help while we work on improving our docs.
We're continuously improving our docs. We'd love to know what you liked
Thank you for your valuable feedback!