Logs tab
Inspect per-load-generator and per-virtual-user execution logs, switch between successful and failed sessions, and download raw logs for offline analysis.
View execution logs for your API and browser tests in a hybrid load test.
The Logs tab displays detailed execution logs for each virtual user (VU) session in your load test. Use this tab to:
- Review execution flow: see step-by-step logs for every VU session, including test start, actions performed, and errors encountered.
- Identify failures: use the dropdown to filter for failed sessions. Select a session to view its logs and pinpoint the cause of failure.
- Debug errors: error messages, stack traces, and code snippets are shown inline. For example, timeouts, locator errors, and failed assertions are clearly marked.
- Filter sessions: use the filters to narrow sessions by load zone or time range.
- Download or view raw logs: export logs for offline analysis or share them with your team using the View Raw Logs or Download options in the top right.
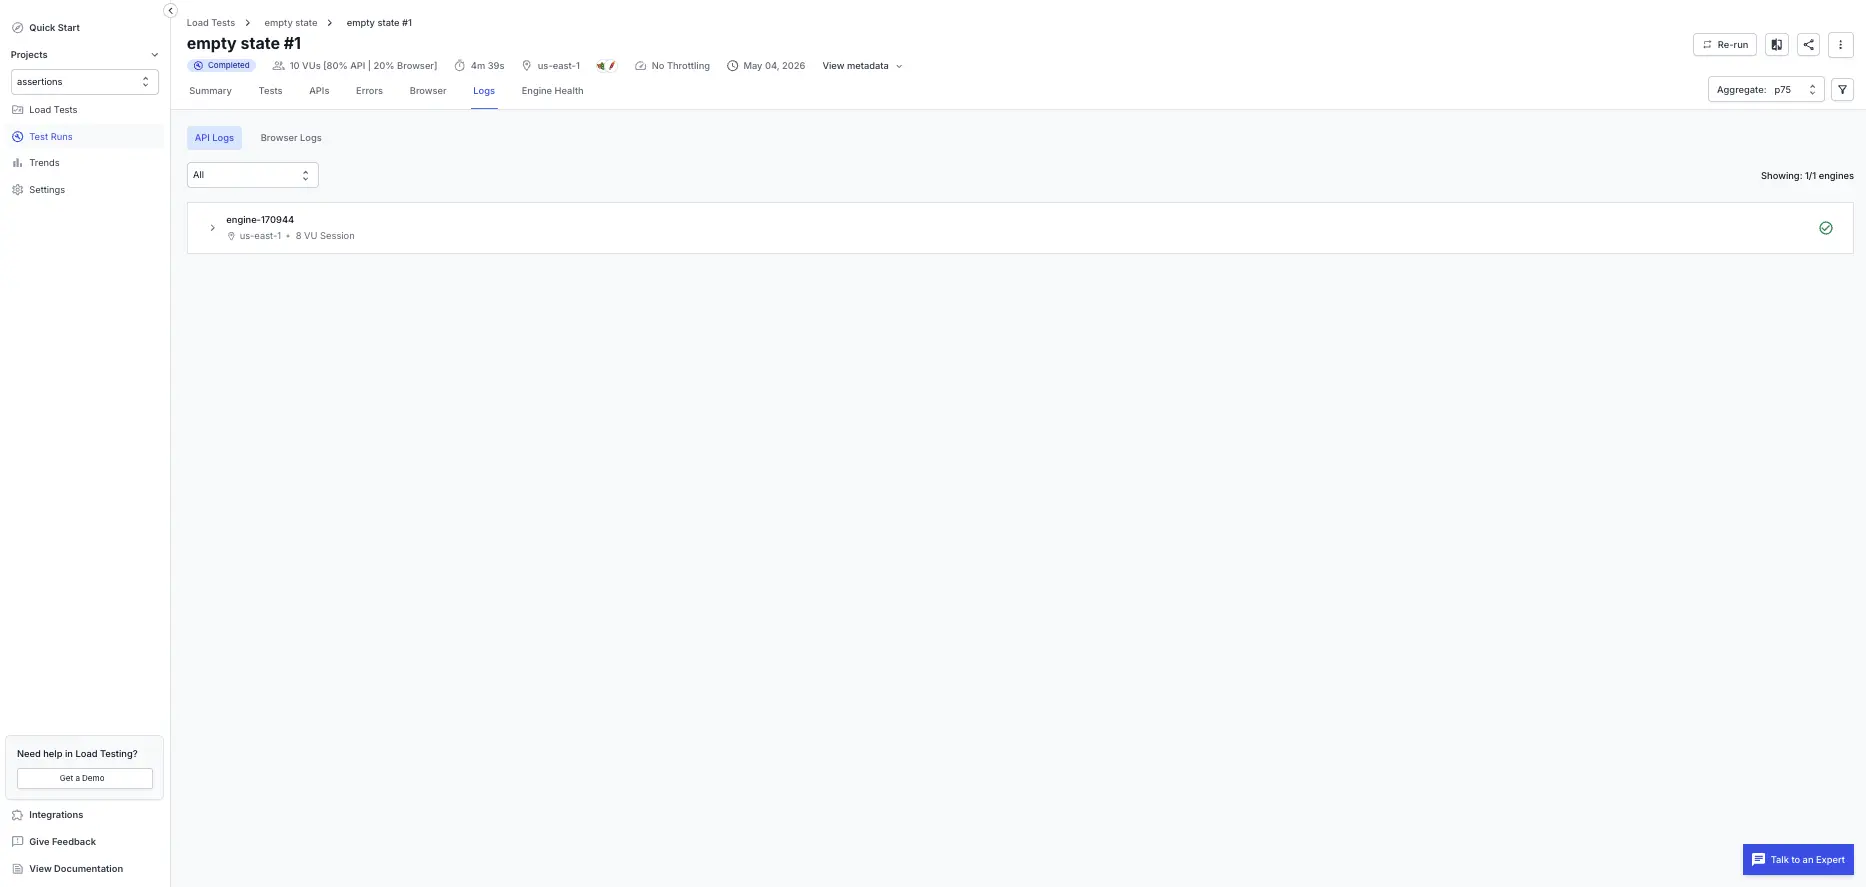
Toggle between API Logs and Browser Logs to view the logs for the API portion and browser portion of your hybrid test separately.
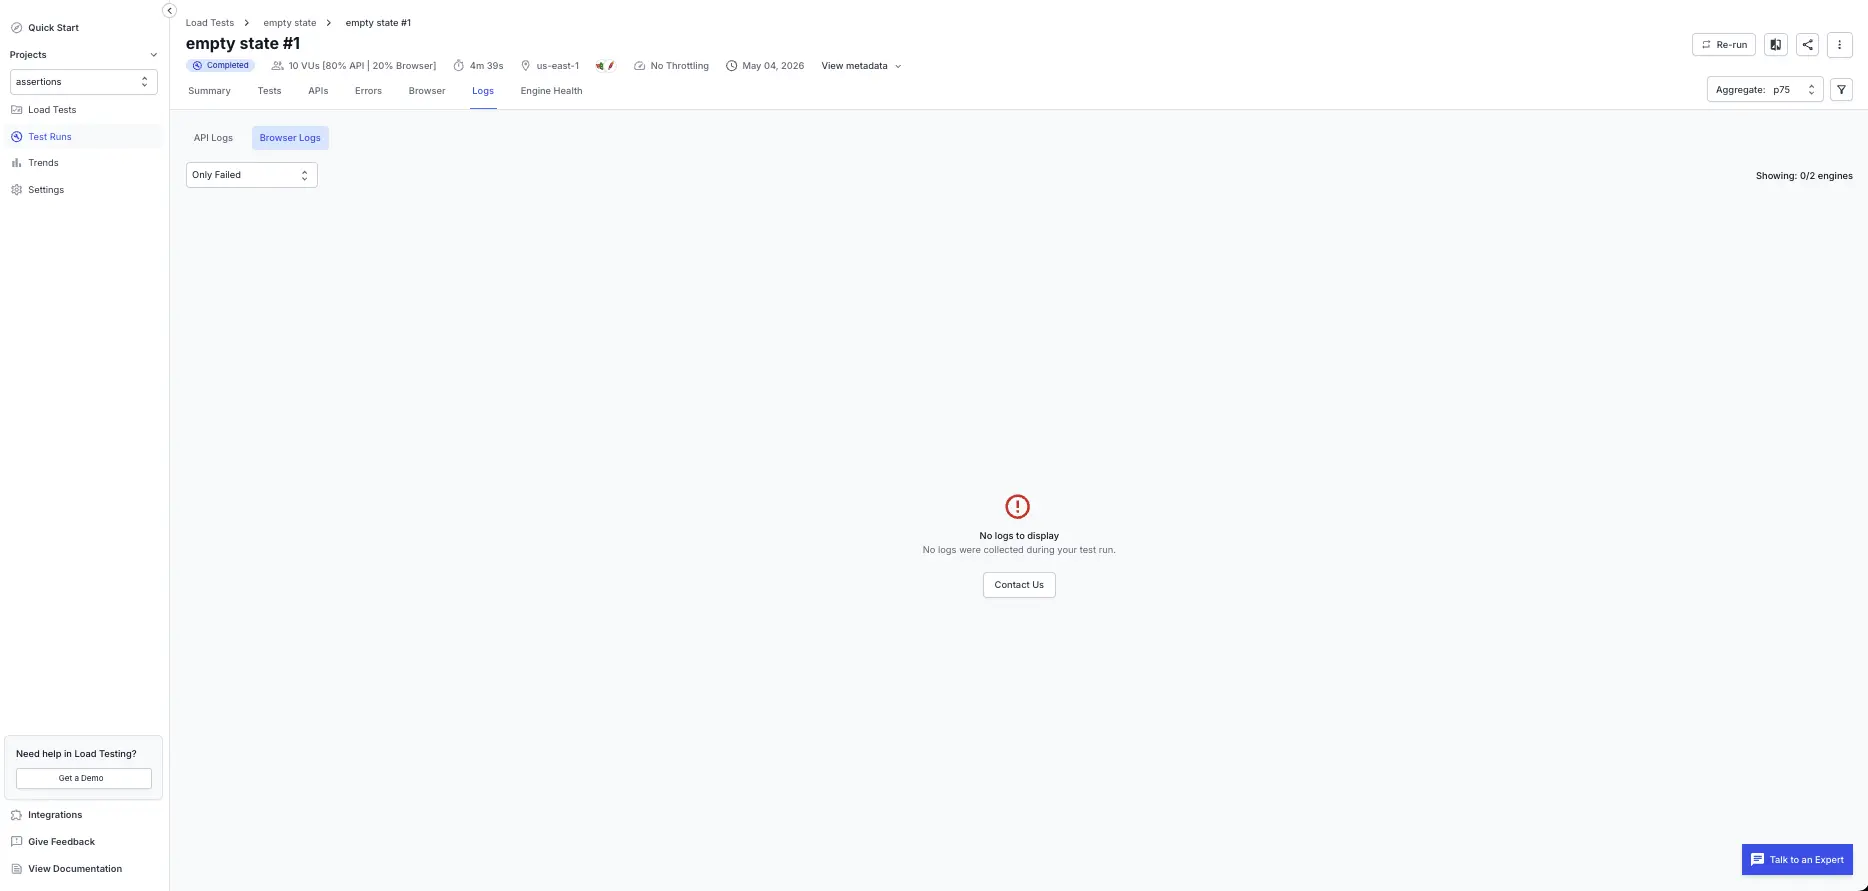
Switch between successful and failed sessions
The dropdown at the top of the session list allows you to filter between successful and failed VU sessions. Use this to triage a run:
- Start with the failed sessions to find out what broke.
- Compare a failed session against a successful one to isolate which step diverged.
By default, the test captures logs for failed sessions only to keep storage and noise low. To enable capturing all logs for your test runs, you need to configure your test settings.
How to use the Logs tab
- Select a VU session from the left panel to view its execution logs.
- Review the log output for test steps, errors, and code context.
- Use the filters to focus on relevant sessions or time ranges.
- Download logs for further analysis if needed.
Related tabs
- Tests: test case outcomes and per-test diagnostics.
- API: backend endpoint performance.
- Browser: frontend Web Vitals and per-URL network calls.
- Errors: aggregated error breakdown.
We're sorry to hear that. Please share your feedback so we can do better
Contact our Support team for immediate help while we work on improving our docs.
We're continuously improving our docs. We'd love to know what you liked
We're sorry to hear that. Please share your feedback so we can do better
Contact our Support team for immediate help while we work on improving our docs.
We're continuously improving our docs. We'd love to know what you liked
Thank you for your valuable feedback!