Tests tab
Inspect every test case executed during a hybrid load test, including pass and fail status and per-test diagnostics.
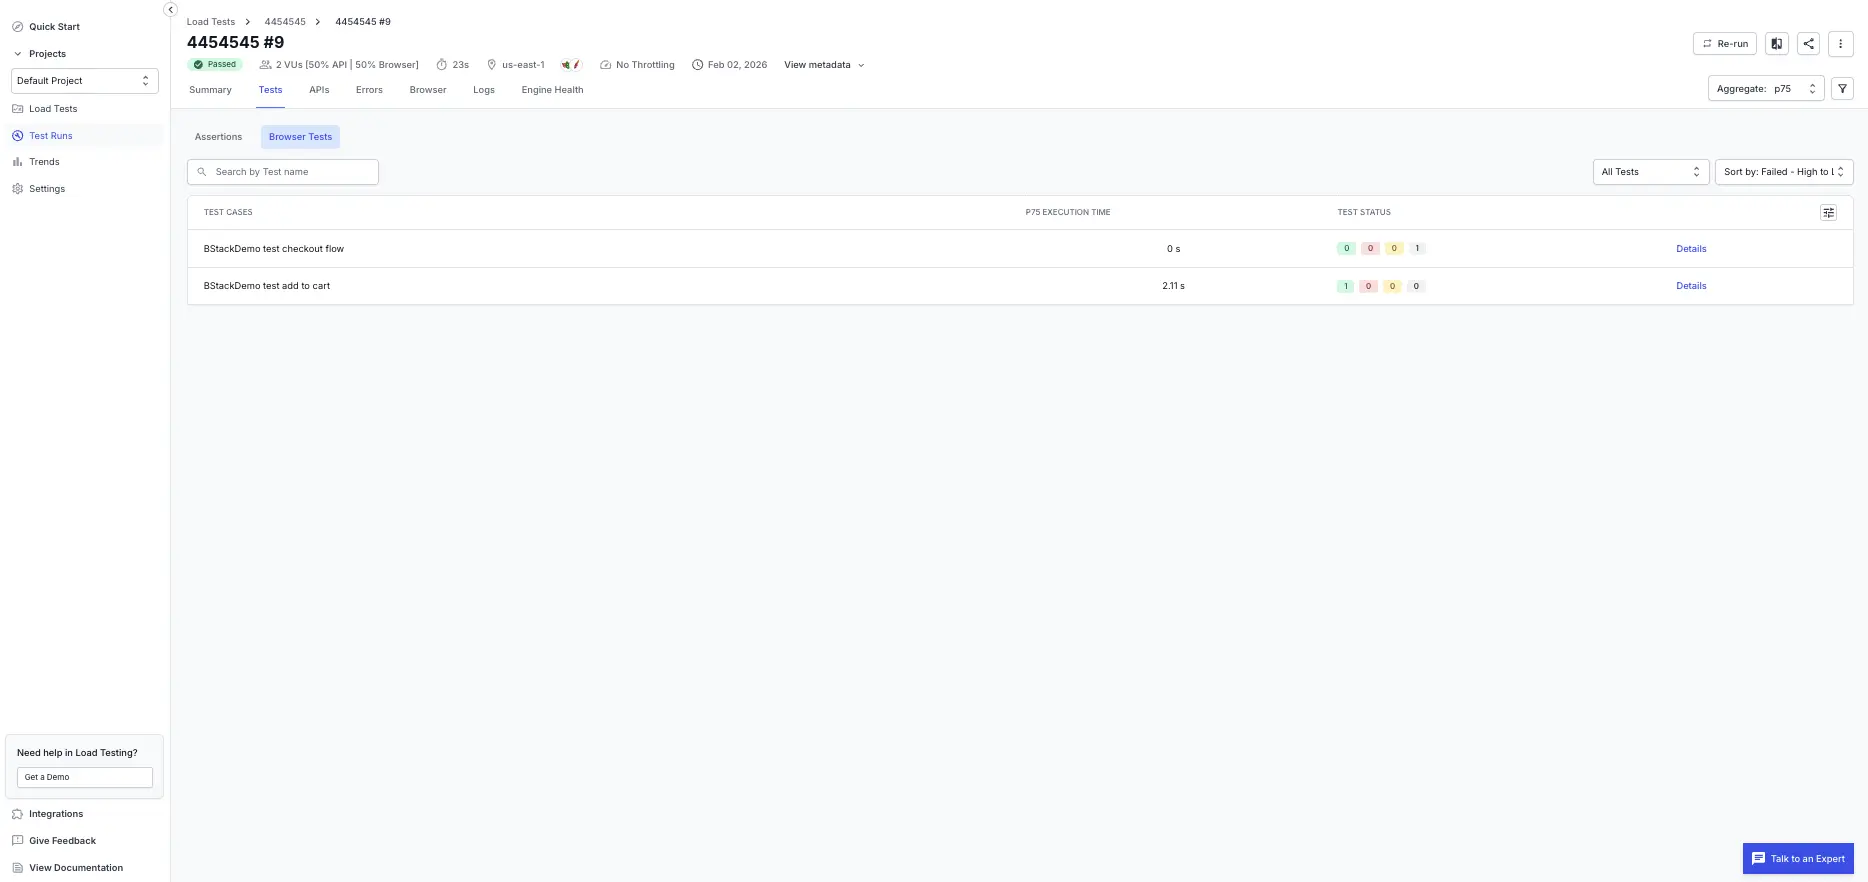
The Tests tab lists every test case executed during the run, surfaces its outcome, and links the result back to the underlying test reporting and analytics record. Use this tab to confirm functional correctness under load and to triage any tests that did not pass.
The Assertions tab (for JMeter) or Checks tab (for k6) lists every script-defined assertion evaluated during your run. Assertions verify that your API behaved as expected, for example, that a response code was 200, a JSON field existed, or response time stayed under a threshold, and let you spot regressions without combing through raw logs.
Assertions are auto-detected from your script, so no project setting changes are required.
Where to find assertions
- API-only (protocol) tests: open a completed test run and look for the Assertions tab (JMeter) or Checks tab (k6) on the report.
- Hybrid tests: open the run and go to the Tests tab. The Assertions sub-tab lists API assertions; the Browser Tests sub-tab lists browser test cases.
Assertion fields
Each row on the Assertions sub-tab includes the following fields:
| Field | Description |
|---|---|
| Name | The label defined in your script (for example, Status is 200). |
| Pass Count | Number of times the assertion passed across all virtual users. |
| Fail Count | Number of times the assertion failed across all virtual users. |
| Failed % | Percentage of total assertion executions that failed. |
| Failure Message | A summary of why the assertion failed (for example, “expected status 200, got 404”). |
| First Occurrence | The timestamp of when this assertion first failed during the test. |
Use assertions to debug a run
The Assertions tab is the fastest way to move from “something failed” to “this specific assertion failed under this load”:
- Quick failure overview: scan the Failed % column to identify which assertions had the highest failure rates.
- Failure context: read the Failure Message to see why the assertion failed (for example, “expected status 200, got 404”).
- Correlation with load: compare the First Occurrence timestamp across assertions to see if failures clustered at a specific point in the test, correlating with load spikes.
- Failure drill-down: click View details on a failed assertion to inspect the Response Code Distribution and Response Body to understand what the API returned.
Drill into an assertion
Select any row or click View details to open the per-assertion drill-in view. This view shows:
- Response Code Distribution: a breakdown of HTTP response codes received for this assertion, including the code, count, description, and first occurrence timestamp.
- Response Body (when enabled): the captured response body for requests, when Capture response details is enabled on the test. This helps you understand what the API returned and why the assertion failed.
Use assertions to set test thresholds
You can use assertion outcomes as a pass/fail gate for the overall test. For example, you can set a threshold that fails the run if total assertion failures exceed a limit. To configure this, see Set thresholds.
k6 vs JMeter terminology
- k6: assertions are called Checks, and the sub-tab reads “Checks”.
- JMeter: assertions are called Assertions, and the sub-tab reads “Assertions”.
Both surfaces show the same fields and behavior (no setup difference, no separate enablement).
The Tests tab lists every test case executed during the run, surfaces its outcome, and links the result back to the underlying test reporting and analytics record. Use this tab to confirm functional correctness under load and to triage any tests that did not pass.
What you can do here
On this tab, you can:
- Review the four status counts on every test case row: Passed, Failed, Skipped, and Other status (across virtual users).
- Search by test name to locate a specific test case.
- Filter the list with the All Tests dropdown, or sort by status (for example, Failed - High to Low) to bring the worst-performing tests to the top.
- Open the Details link on any row to inspect a single test’s failure profile.
Test status reference
The following table describes the possible test statuses you may see on the Tests tab:
| Status | Meaning |
|---|---|
| Passed | The test case ran end-to-end without assertion failures or runtime errors. |
| Failed | The test case ran but one or more assertions or steps failed. |
| Skipped | The test case was not executed (for example, due to a precondition or a filter). |
| Other | The test case did not complete due to a non-functional issue (for example, an aborted run or an engine-side error). |
Drill into a single test
Select Details on any test case row to open the per-test panel. The panel shows:
- Load vs Failure Rate Progression for that single test case: virtual users (actual load) plotted alongside the test failure rate against time, so you can correlate the test’s failures with the run’s load profile.
- Unique Errors captured for that test across all virtual users. If the test had no errors, the panel reports “No errors in the test”.
Use this view to confirm whether a failing test failed under specific load levels and to read the deduplicated error messages without leaving the tab.
Related tabs
- API: backend endpoint performance.
- Browser: frontend Web Vitals and per-URL network calls.
- Errors: aggregated error breakdown.
We're sorry to hear that. Please share your feedback so we can do better
Contact our Support team for immediate help while we work on improving our docs.
We're continuously improving our docs. We'd love to know what you liked
We're sorry to hear that. Please share your feedback so we can do better
Contact our Support team for immediate help while we work on improving our docs.
We're continuously improving our docs. We'd love to know what you liked
Thank you for your valuable feedback!