Summary tab
Quickly assess overall test health with key metrics and AI-generated insights for a protocol load test.
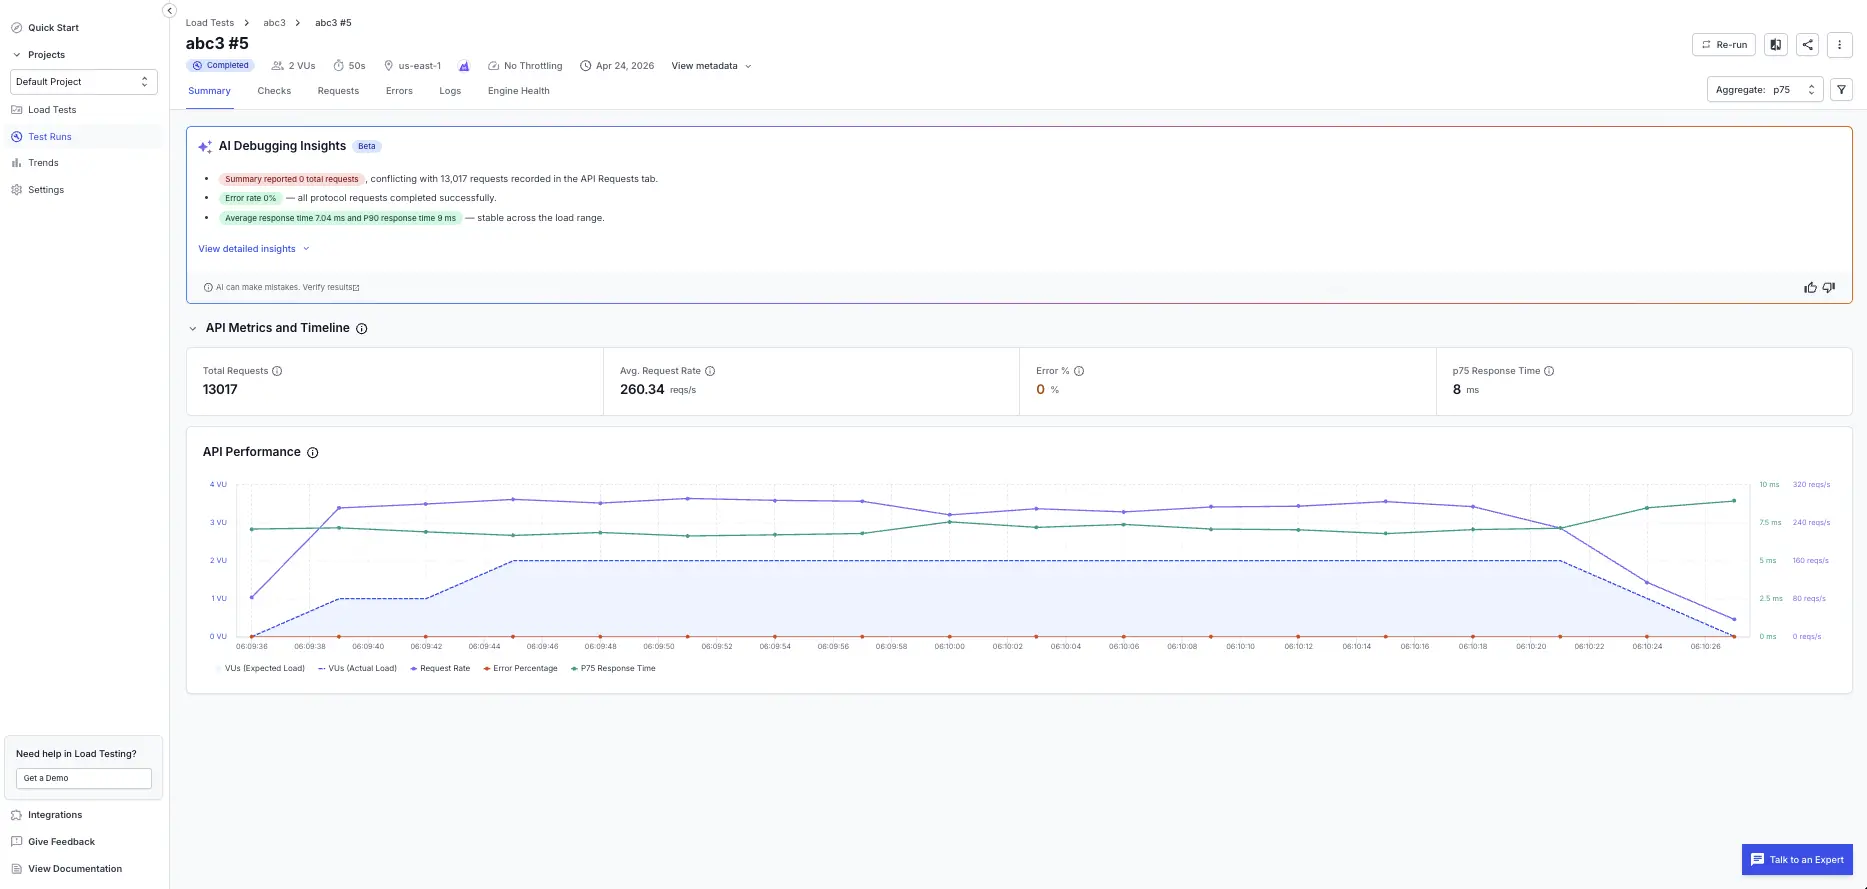
The Summary tab gives you a high-level overview of your application’s performance during load testing. Use this page to quickly assess key metrics, identify trends, and spot potential issues that may affect user experience under load.
Report-level controls (Re-run, Compare run, Set as Baseline, Share, Download PDF, Aggregate, and Filters) live in the report header and apply to the entire run. See Test run report controls.
AI Insights
The AI Insights card (Beta) summarizes the most important findings from the run in plain language. Common things it can surface include:
- Overall test pass rate.
- Notable error rates with the failing endpoint(s) called out.
- Notable response-time outliers that indicate long-tail latency.
Select View detailed insights to expand the full AI-generated explanation. AI Insights is advisory. Verify findings against the underlying metrics before acting on them. For more about this feature, see AI Insights.
Key metric tiles
On the Summary tab, you get a high-level view of run health:
- Max VUs: highest concurrent virtual users reached during the test.
- Total requests: number of protocol requests attempted.
- Error %: percentage of requests that returned an error status.
- Avg. request rate: average requests per second sustained.
- Avg. response time: mean server response time across all requests.
- P90 response time: 90th percentile latency. Shows tail performance.
The aggregate selected in the report header determines which percentile is reported in the response-time tile.
Performance chart
The performance chart below the tiles lets you correlate virtual user load, request rate, response time, and error percentage over time. Click and drag across the chart to zoom into a specific time interval; all metrics update to the zoomed range.
We're sorry to hear that. Please share your feedback so we can do better
Contact our Support team for immediate help while we work on improving our docs.
We're continuously improving our docs. We'd love to know what you liked
We're sorry to hear that. Please share your feedback so we can do better
Contact our Support team for immediate help while we work on improving our docs.
We're continuously improving our docs. We'd love to know what you liked
Thank you for your valuable feedback!