View protocol test results
Learn how to analyze protocol load test results in BrowserStack to identify performance issues.
After your protocol load test completes, you can view detailed performance data for backend, network, and load-generator behavior. Use the test report to analyze trends, identify bottlenecks, and optimize your application under load.
Access your test results
You can access your test results from the dashboard.
Go to Test Runs from the left navigation panel.
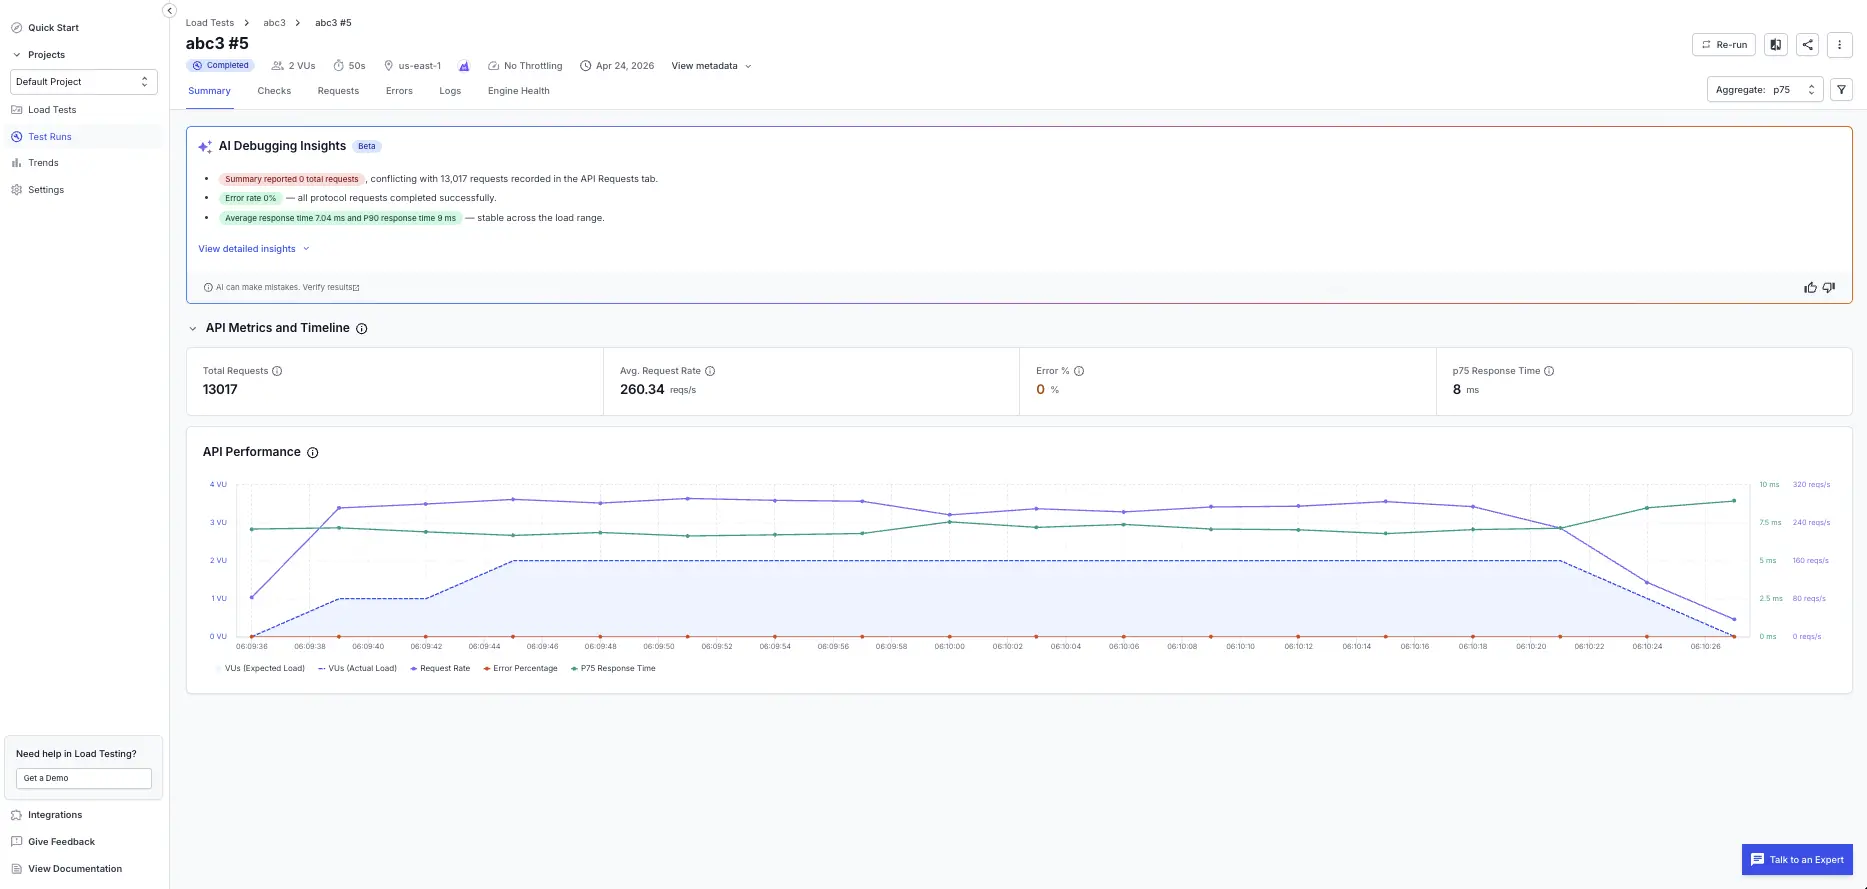
At the top of every report, you’ll find metadata to help you confirm the correct test run:
- Test name
- Test run number
- Status: Queued, Running, Completed, Aborted by user, Error
- Virtual users (VUs)
- Duration
- Regions
- Username
- Test type
- Start and end time
- Test ID
- Download link to the test suite
Test run report controls
The report header exposes controls that apply to the entire run, not to a single tab. Use these before drilling into the tabbed sections.
Re-run a test
Select Re-run in the top-right corner to launch the same test configuration again. Use this to reproduce a result, validate a fix, or capture a fresh baseline candidate.
Compare run
Select the Compare run icon next to Re-run to compare the current run against another run or your saved baseline. Use this to confirm regressions or improvements between two runs of the same test.
Set as baseline
A baseline run is the reference run that future runs are compared against. To mark the current run as the baseline:
- Select the kebab menu (⋮) in the top-right corner.
- Select Set as Baseline.
Subsequent runs will be compared against this run when you use Compare run.
Set a global percentile (aggregate)
The report supports a single aggregate that applies to every metric across the run. To change it, open the Aggregate dropdown in the top-right of the report and pick one of: Min, Avg, p75 (project default), p90, p95, p99, or Max. To change the aggregate for all reports in the project, update it in Project Settings.
Filter the report
Select the filter icon next to the aggregate dropdown to scope the report by Load Zones and a custom Start/End date and time window. All charts and tables update to reflect the filter.
Download the report as a PDF
- Select the kebab menu (⋮) in the top-right corner.
- Select Download PDF Report.
Share the report
Select the Share icon in the top-right corner to copy a private URL (visible to your team) or a public URL (visible to anyone with the link).
Navigate the test report
The report is divided into the following tabs:
Related resources
We're sorry to hear that. Please share your feedback so we can do better
Contact our Support team for immediate help while we work on improving our docs.
We're continuously improving our docs. We'd love to know what you liked
We're sorry to hear that. Please share your feedback so we can do better
Contact our Support team for immediate help while we work on improving our docs.
We're continuously improving our docs. We'd love to know what you liked
Thank you for your valuable feedback!