Trends
See how a load test’s key metrics change across its runs over time, so you can spot regressions, improvements, and anomalies without comparing runs by hand.
A single report tells you how one run behaved. It doesn’t tell you whether your system is getting faster or slower, more or less reliable, release after release. The Trends view answers that question. It plots a load test’s key metrics across its runs on a timeline, so you can see the direction of travel at a glance and catch a slow regression before it reaches production.
With the Trends view, you can:
- Track how response time, error rate, request rate, and resource usage change across a test’s runs.
- Tell a one-off spike apart from a steady decline that builds up over several runs.
- Focus on a time window, such as the last 7 days, and choose which metrics to show.
- Switch response time between its average and percentile values.
- Share the view with your team or with anyone through a public link.
Open the Trends view
The Trends view is shown per load test and is built from that test’s runs over a time window you choose.
To open it:
- In your project’s left navigation, select Trends.
- From Select Load Test, choose the load test you want to analyze.
- From Select Analysis Window, choose the time range, such as Last 7 Days.
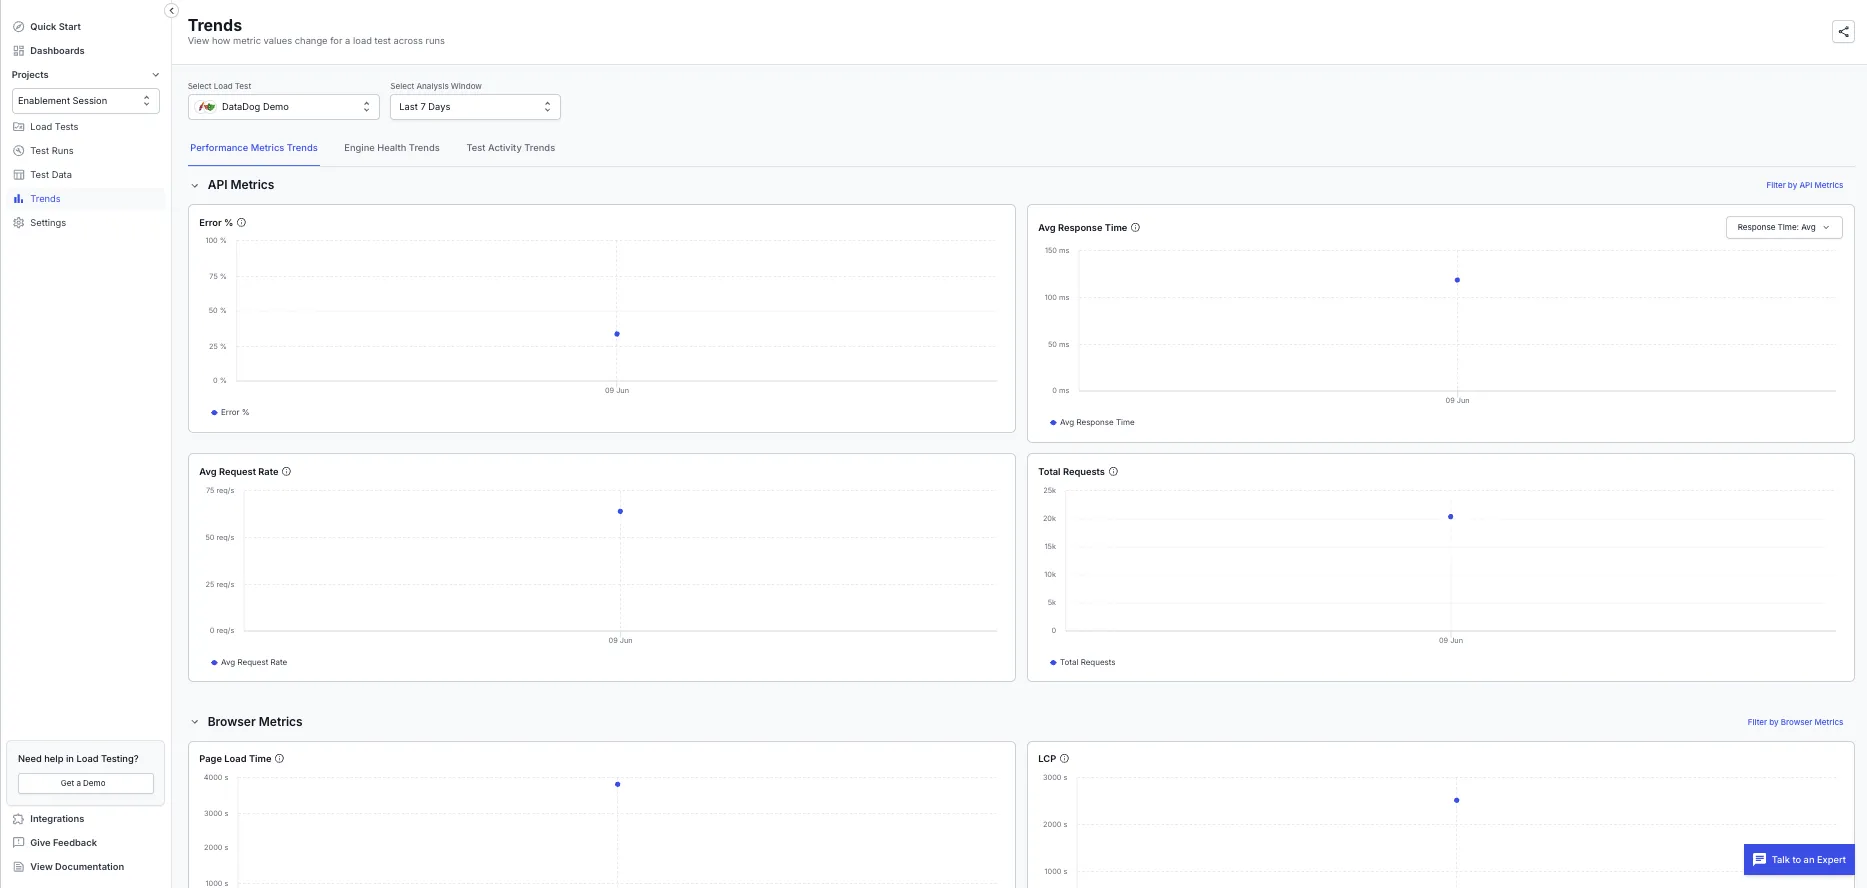
The view opens on the Performance Metrics Trends tab. Use the tabs at the top to switch between trend types.
Trends you can see
The Trends view organizes data into three tabs: Performance Metrics Trends, Engine Health Trends, and Test Activity Trends. Select a tab to switch between trend types.
Performance Metrics Trends
This tab groups its charts into two sets, based on your test type:
| Metric set | Metrics |
|---|---|
| API Metrics | Error rate, average response time, including its P90, P95, and P99 values, average request rate, and total requests. |
| Browser Metrics | Page load time, LCP, and other Core Web Vitals. |
On the Avg Response Time chart, use the response-time dropdown to switch between the average and the P90, P95, and P99 values.
Engine Health Trends
This tab shows how the load generators behave across runs, with two charts:
- CPU usage: Processor load on the generators across runs.
- Memory usage: Memory used by the generators across runs.
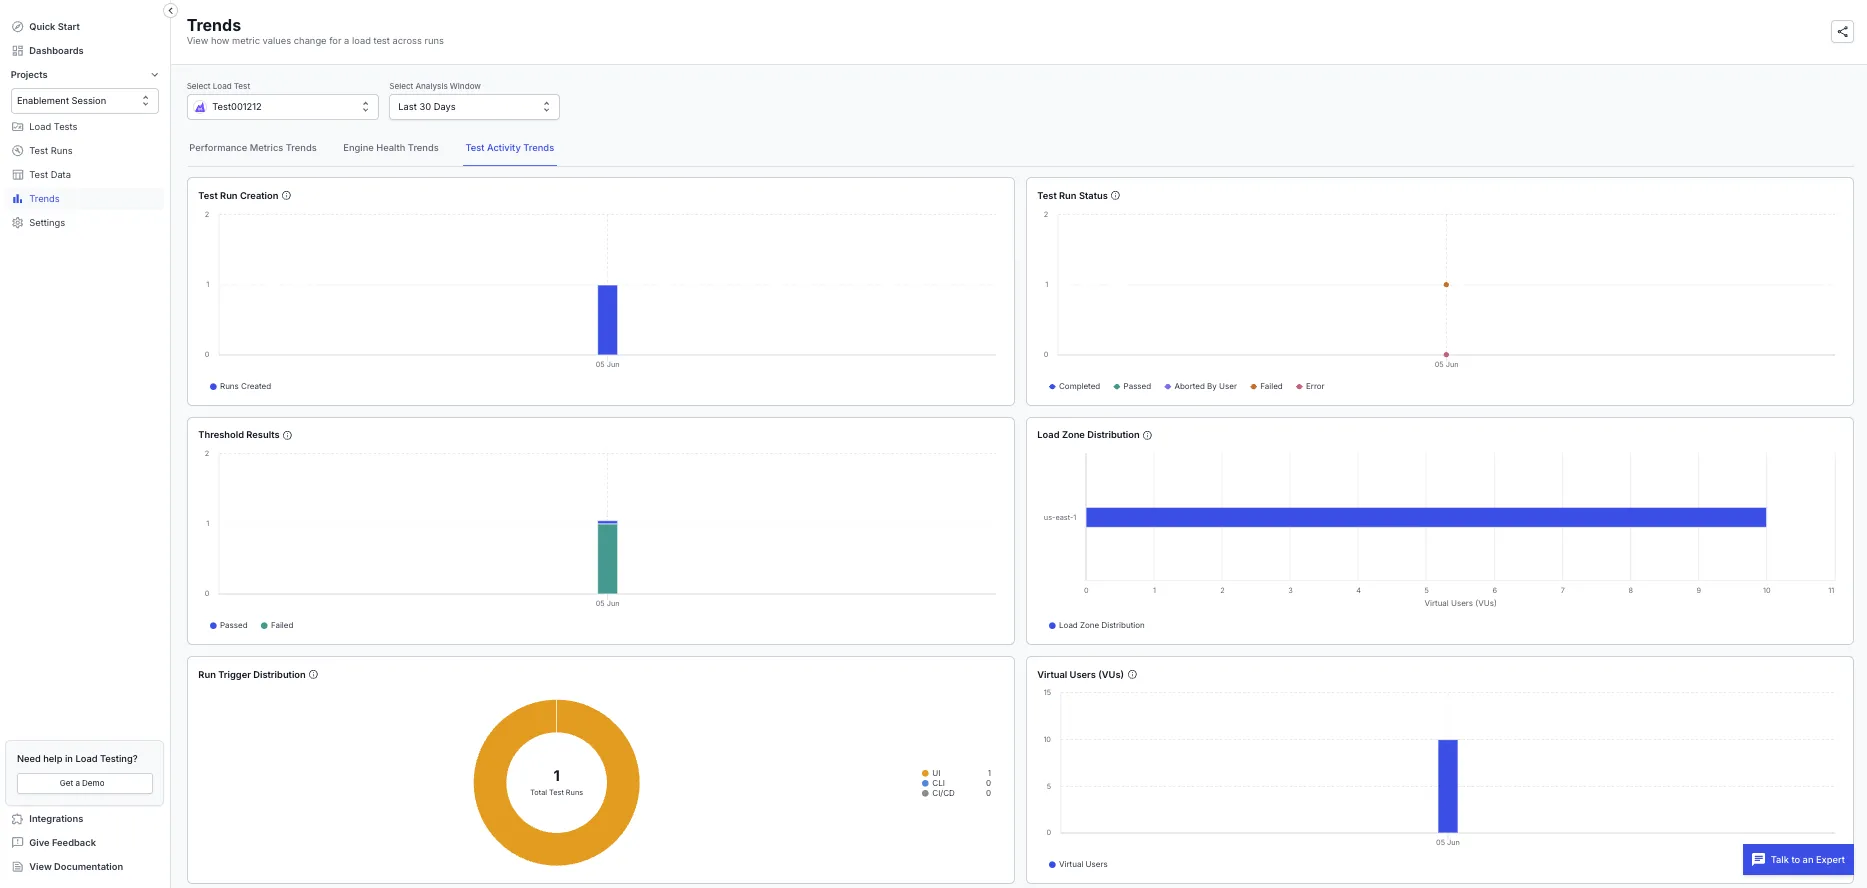
Test Activity Trends
This tab shows how the test is run and how its outcomes trend across the selected window:
| Chart | What it shows? |
|---|---|
| Test Run Creation | The number of runs created over time. |
| Test Run Status | Run outcomes over time: completed, passed, aborted by user, failed, and error. |
| Threshold Results | Passed and failed threshold checks across runs. |
| Load Zone Distribution | Virtual users distributed across load zones. |
| Run Trigger Distribution | How runs were triggered: UI, CLI, or CI/CD. |
| Virtual Users (VUs) | The virtual users used per run over time. |
Filter the trends
Use these controls to focus the view on the data that matters:
- Select Analysis Window: Change the time range the trends cover, such as Last 7 Days.
- Filter by API Metrics and Filter by Browser Metrics: Choose which metric charts appear on the Performance Metrics Trends tab.
- Response-time dropdown: On the Avg Response Time chart, switch between the average and the P90, P95, and P99 values.
Read a trend chart
Each chart plots time on the horizontal axis and the metric value on the vertical axis, with one point per run. Hover over any point to see that run’s details, so you can connect a shift in the trend to the run that caused it.
A test’s configuration can change between runs. When the same test runs with a different load profile, script, or load zone, the metrics aren’t strictly like for like, which can look like a regression or an improvement that isn’t real. Check the run details before you read too much into a sudden change.
To compare two specific runs side by side instead of across time, use Compare reports. To read a single run tab by tab, see the view-results guide for your test type: browser, API, or hybrid.
Share a trend view
Select the share icon in the top-right corner of the Trends view to generate a public link. Anyone with the link can open the view without a BrowserStack account, which makes it useful for release reviews and updates to stakeholders.
Points to remember
Review the following before you act on a trend:
- Trends build up as a test accumulates runs, so a test with a single run in the selected window shows a single point.
- Aborted or partial runs can skew a trend. Check the run details for any point that looks out of place.
- A change in load profile, script, or load zone between runs can look like a regression or an improvement that isn’t real. Check the run details first.
- Runs are plotted in your local time zone.
We're sorry to hear that. Please share your feedback so we can do better
Contact our Support team for immediate help while we work on improving our docs.
We're continuously improving our docs. We'd love to know what you liked
We're sorry to hear that. Please share your feedback so we can do better
Contact our Support team for immediate help while we work on improving our docs.
We're continuously improving our docs. We'd love to know what you liked
Thank you for your valuable feedback!