
 Join our Discord
Dashboards and gadgets
Show BrowserStack test data on a Jira dashboard. Create the dashboard, add a BrowserStack gadget, and set its filters and time period.
A Jira dashboard is a page of gadgets. Each gadget reports on one thing, such as the status of your active test runs. BrowserStack Test Management for Jira adds 28 gadgets to the Jira gadget catalog. Jira treats them like the gadgets that Atlassian ships. So one dashboard can show the Jira issues assigned to you next to your BrowserStack test results.
Prerequisites
Before you start, confirm the following:
- BrowserStack Test Management for Jira is installed and enabled for the Jira projects you want to report on. To check, open a project and confirm that BrowserStack Test Management for Jira appears under Apps in the project sidebar. For the setup steps, read Install and configure the app.
- Your Jira account can create dashboards. To check, select Dashboards in the Jira sidebar and confirm that the Create dashboard button appears.
You do not need any extra permission to build a dashboard for yourself. To share it with other people, you need two global permissions. Manage dashboards and gadgets names both.
Step 1: Create a dashboard
If you already have a dashboard, open it, click Edit, and skip to Step 2. To create a new dashboard, follow these steps:
-
From your Jira sidebar, select Dashboards > View all dashboards.
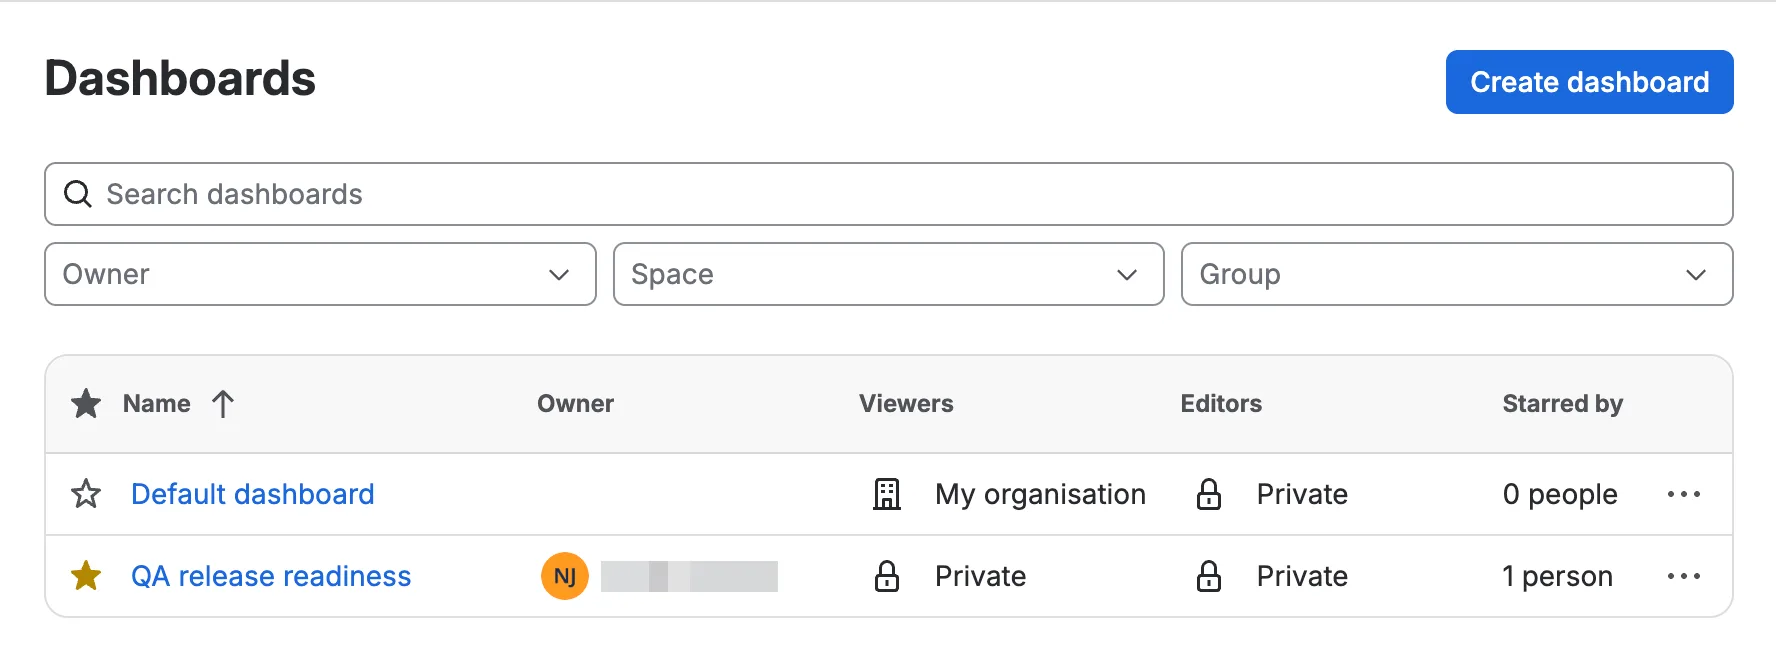
- Click Create dashboard.
- In Name, enter a name that says what the dashboard covers.
-
In Description, add more detail, or leave the field empty.
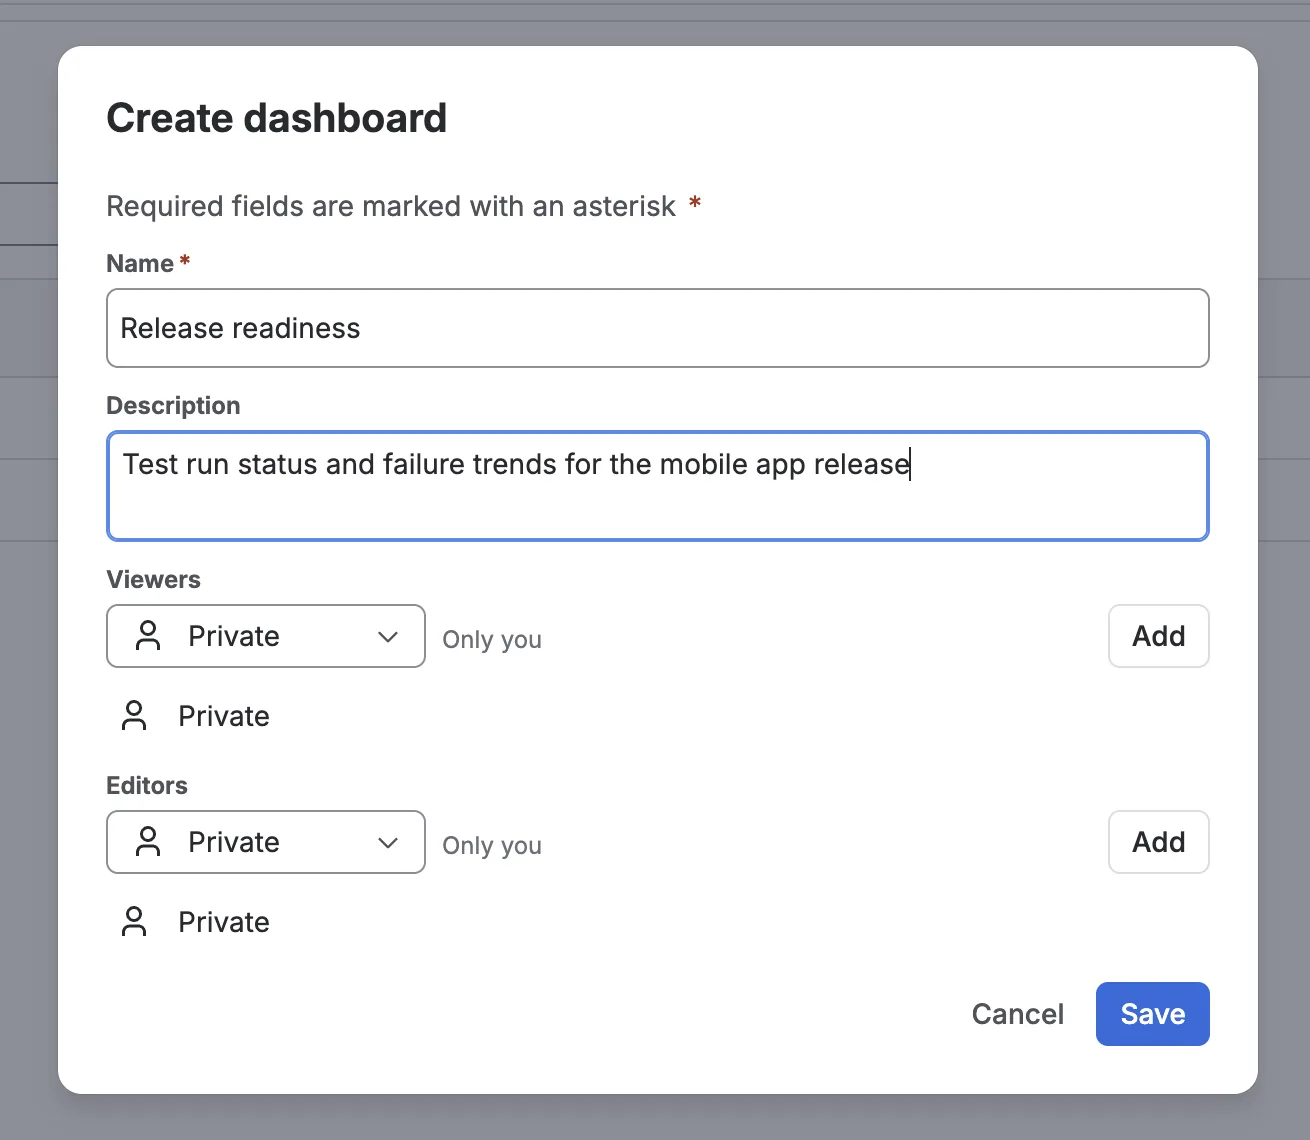
- In Viewers and Editors, pick who can open and change the dashboard. Private is the default. Manage dashboards and gadgets describes each option.
- Click Save.
Jira opens the new dashboard in edit mode with the Add a Gadget panel open. A banner at the top of the page confirms that Jira saves your changes automatically.
Step 2: Add a BrowserStack gadget
The Add a Gadget panel lists every gadget on your Jira site. To find the BrowserStack ones, follow these steps:
-
If the Add a Gadget panel is closed, click Add gadget at the top of the dashboard.

-
In Search gadgets, enter
BrowserStack. The panel reads 28 gadgets found.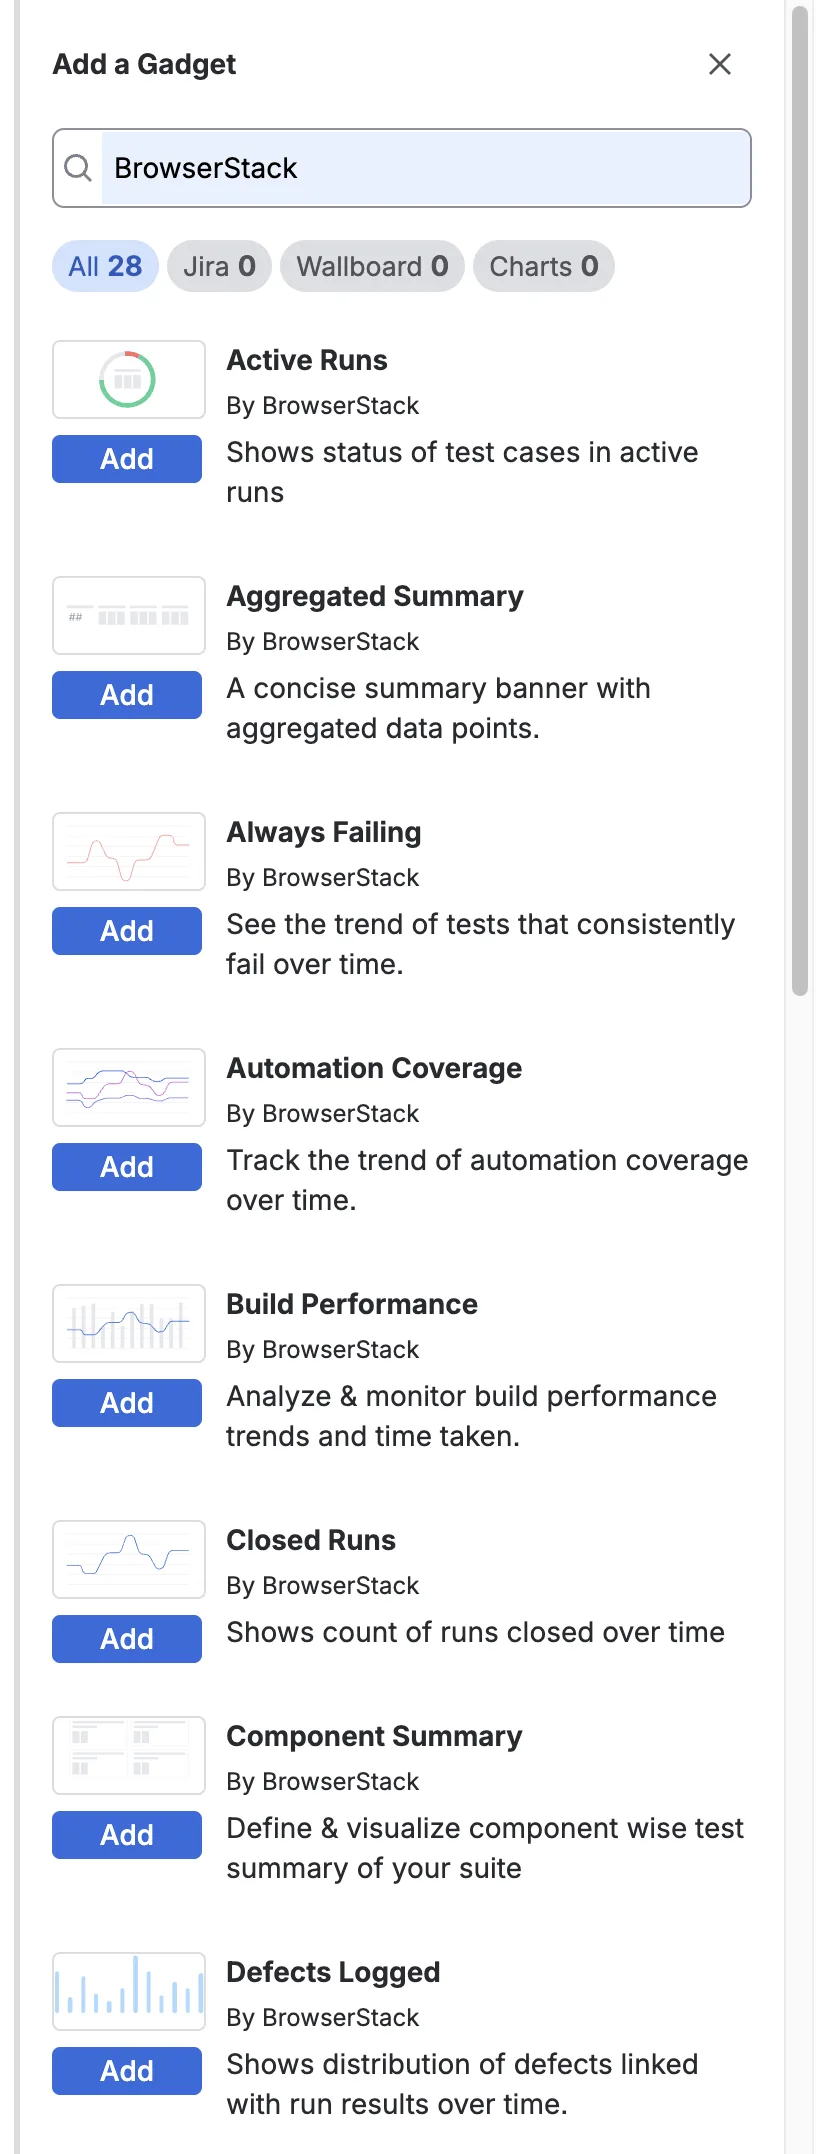
-
Next to the gadget you want, click Add.
Jira places the new gadget at the top of the leftmost column. Under each gadget title, the panel names the publisher and gives a one-line summary of what the gadget shows. If the list is empty, click the All chip under the search box. The Jira, Wallboard, and Charts chips hide BrowserStack gadgets.
To choose a gadget, read the BrowserStack gadgets reference. It lists all 28 with what each one reports.
Step 3: Configure the gadget
The new gadget opens in configuration mode.
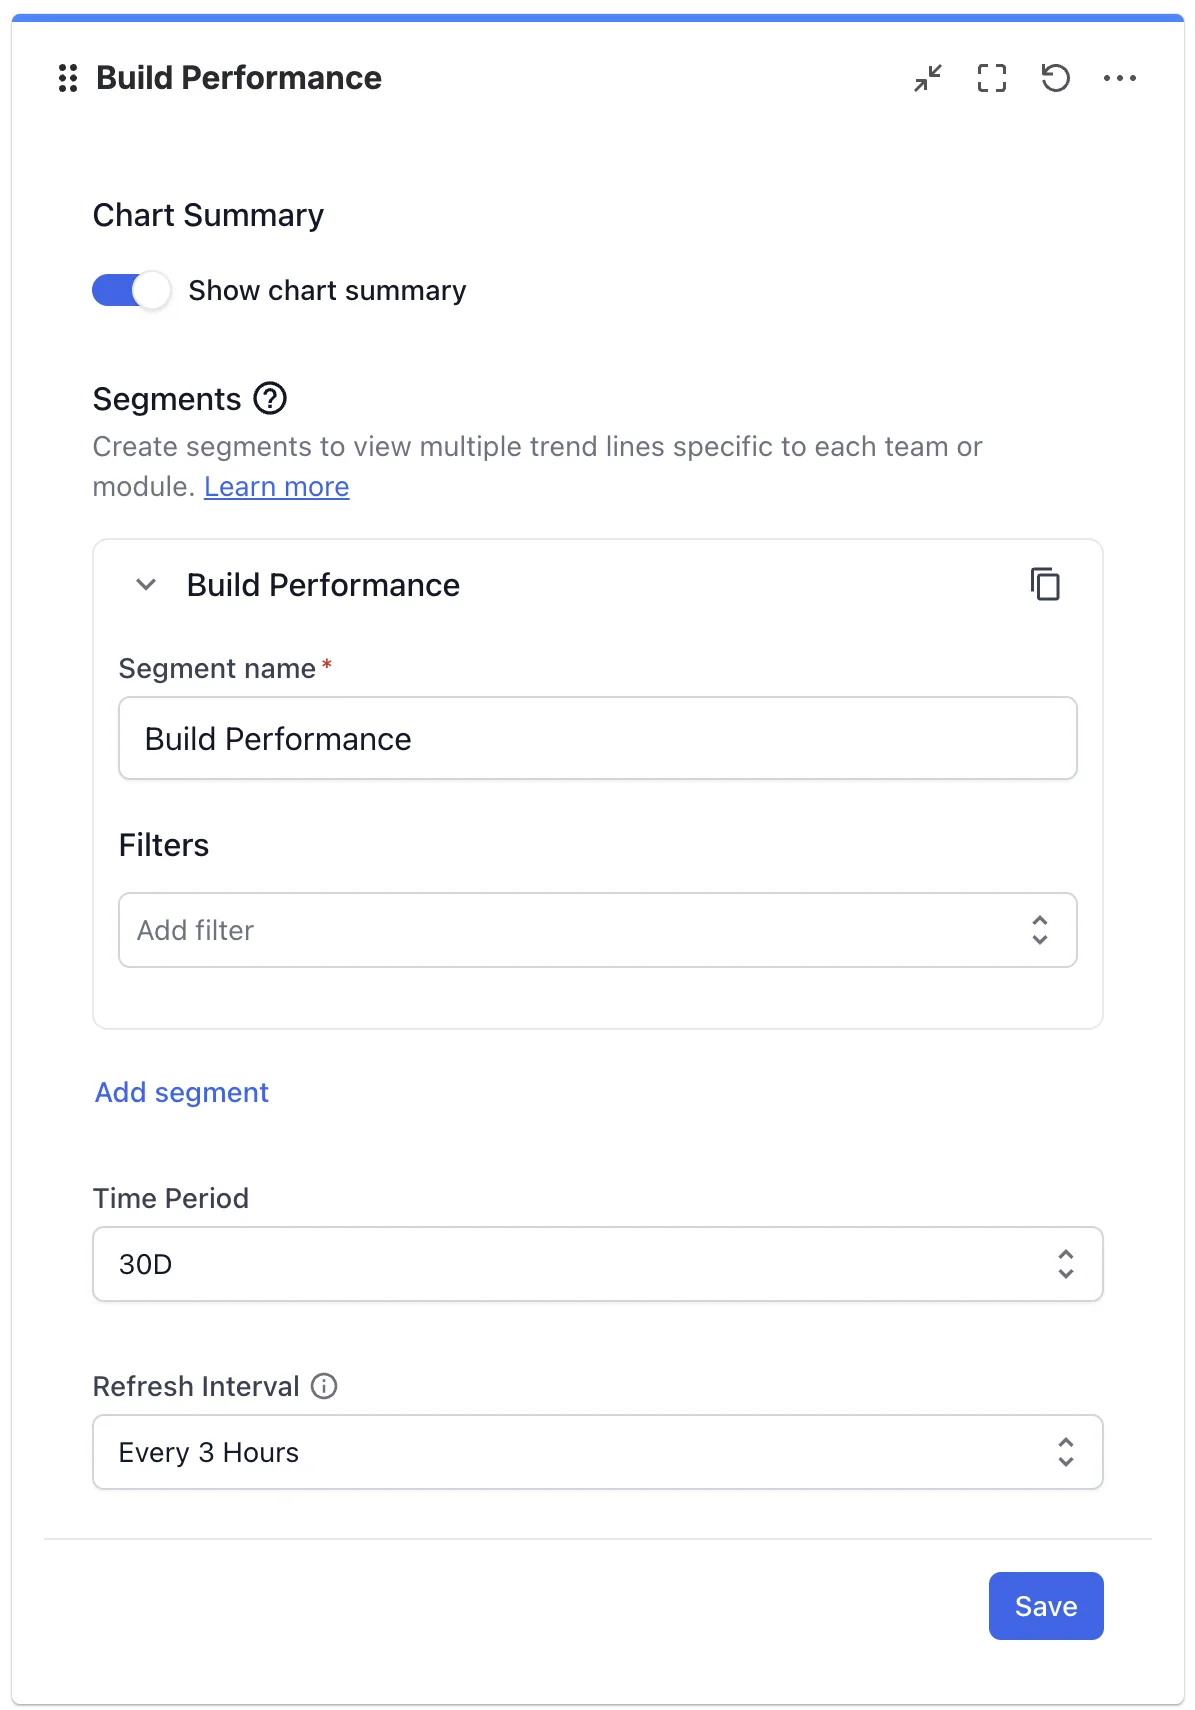
Every BrowserStack gadget has a Time Period and a Refresh Interval. The other settings depend on the gadget:
| Setting | Details |
|---|---|
| Filters | Narrows the data the gadget reports on. Which filters you see depends on the gadget. |
| Segments | On trend gadgets such as Closed Runs, adds one trend line per segment, so you can compare teams or modules. Each segment has a name and its own filters. |
| Time Period | Sets the date range the gadget covers. Pick 1D, 7D, 30D, 3M, 1Y, 2Y, or a custom date range. The default is 30D. |
| Refresh Interval | Sets how often the gadget reloads its data. Pick Every 15 minutes, Every 30 minutes, Every 1 Hour, Every 3 Hours, or Never. The default is Every 3 Hours. |
A gadget shows no data until you configure it and click Save. Until then it reads “This gadget hasn’t been configured yet.”
Click Save in the gadget to apply the settings. Then click Done at the top of the dashboard to leave edit mode.
Verify the dashboard
After you click Done, the gadget shows its chart with the data for your time period.
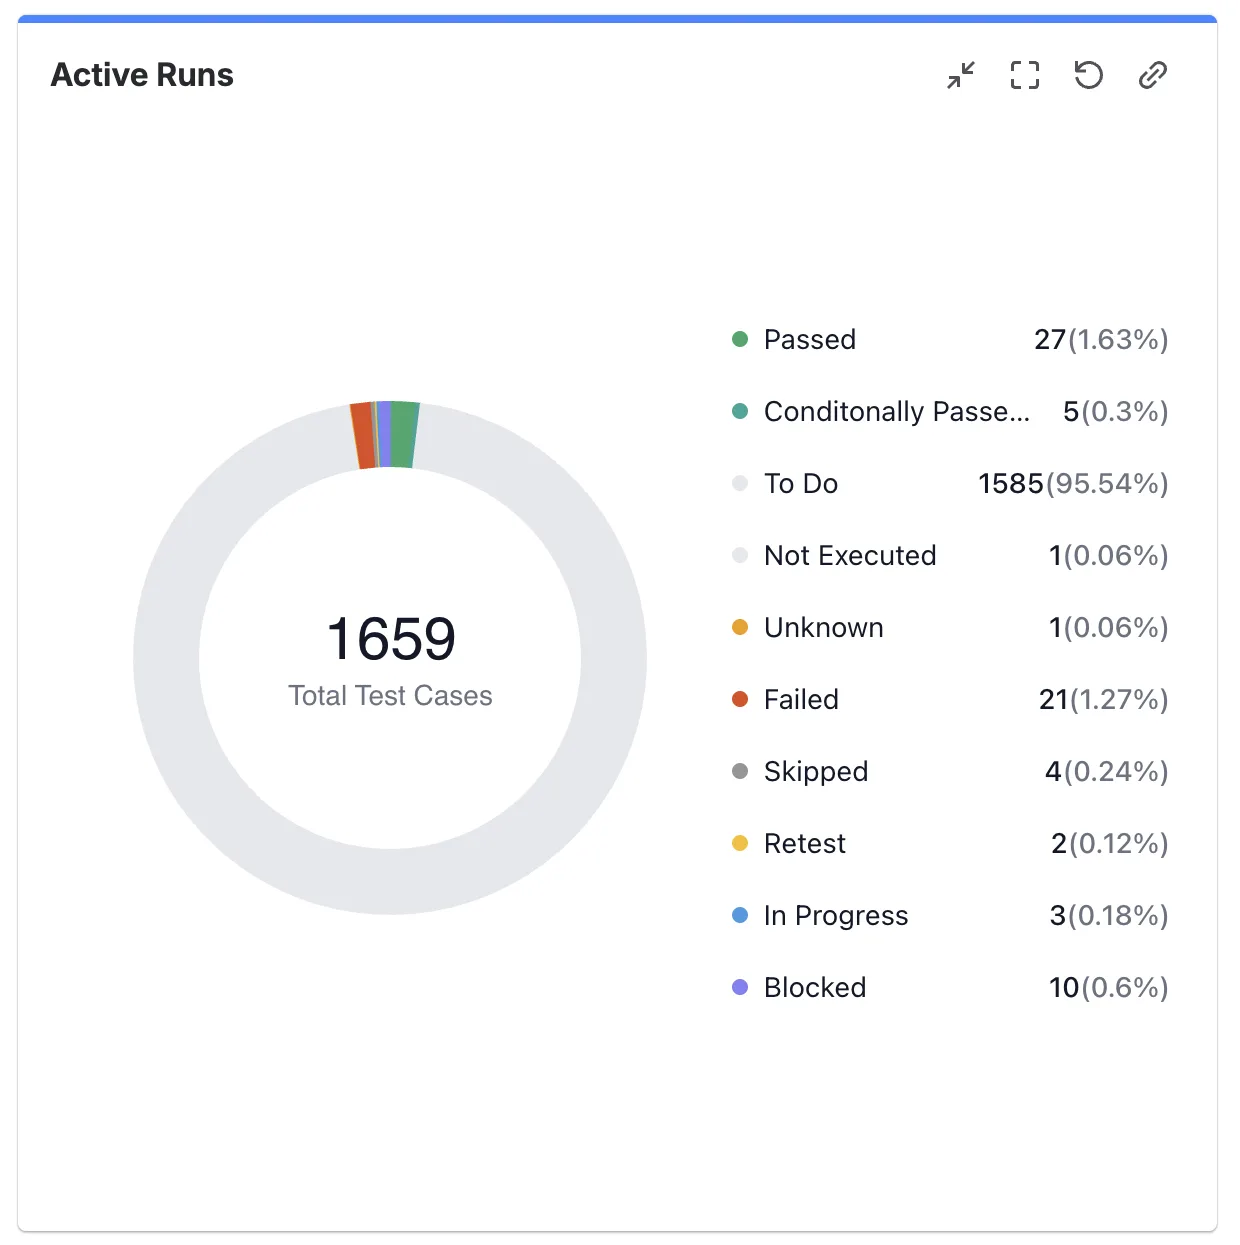
If the gadget shows no results, click Edit, then More actions on the gadget, then Configure.
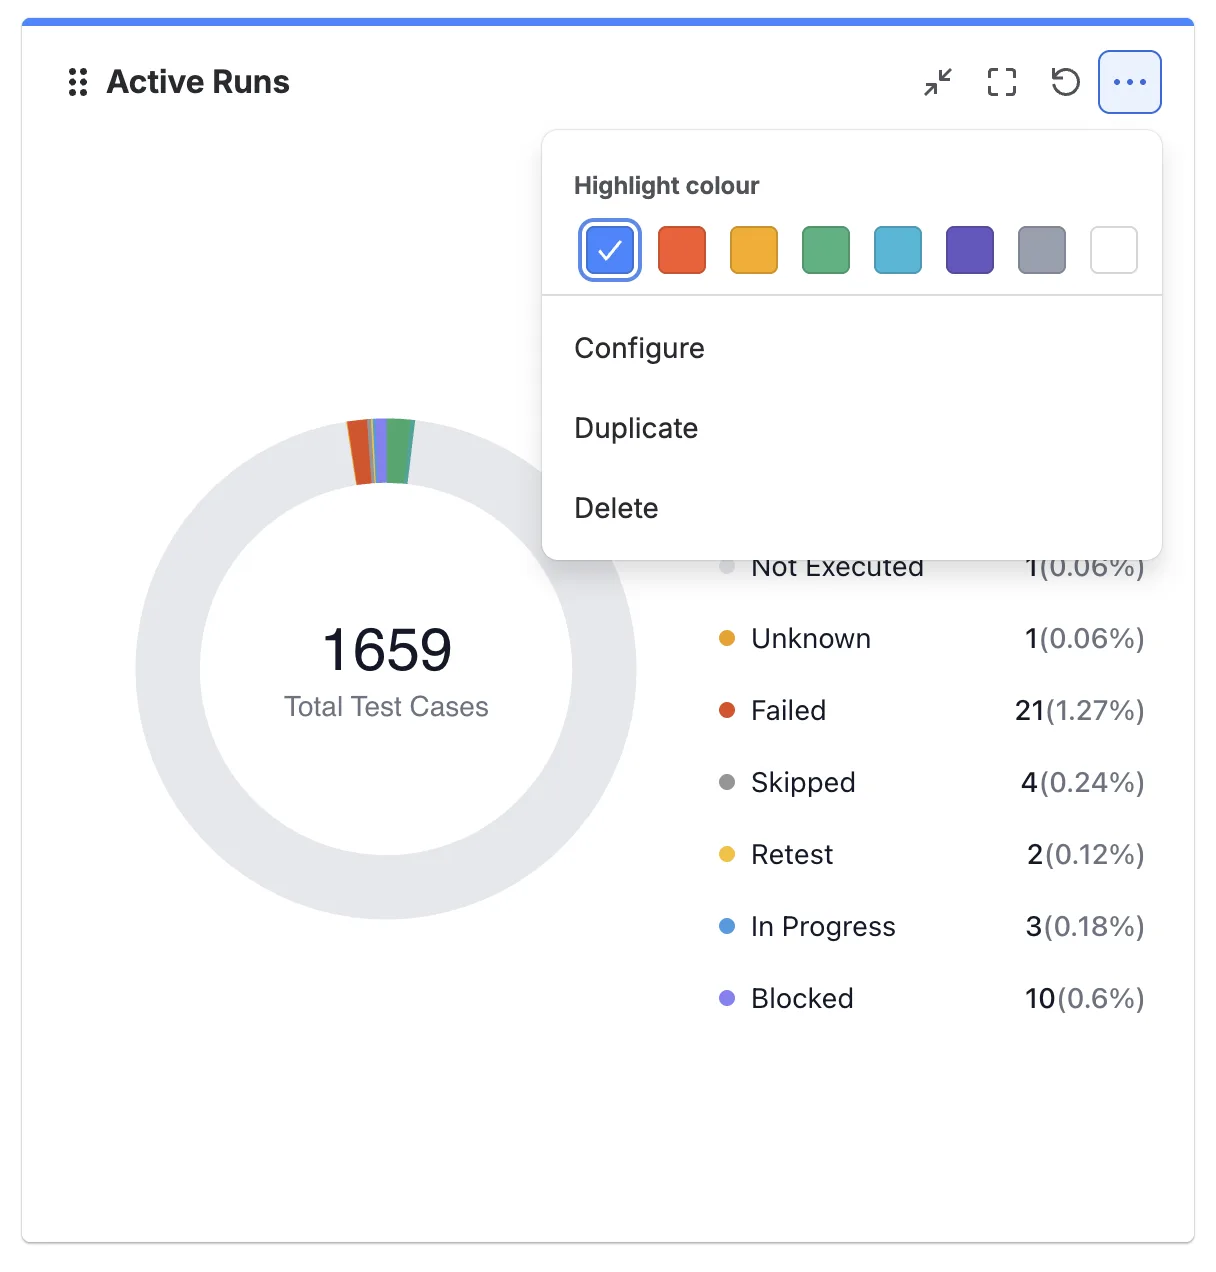
Widen Time Period or remove a filter, then click Save.
Next steps
- Manage dashboards and gadgets: share the dashboard with your team, copy it, or rearrange the gadgets.
- BrowserStack gadgets reference: find the gadget that answers your question.
We're sorry to hear that. Please share your feedback so we can do better
Contact our Support team for immediate help while we work on improving our docs.
We're continuously improving our docs. We'd love to know what you liked
We're sorry to hear that. Please share your feedback so we can do better
Contact our Support team for immediate help while we work on improving our docs.
We're continuously improving our docs. We'd love to know what you liked
Thank you for your valuable feedback!