Project insights dashboard
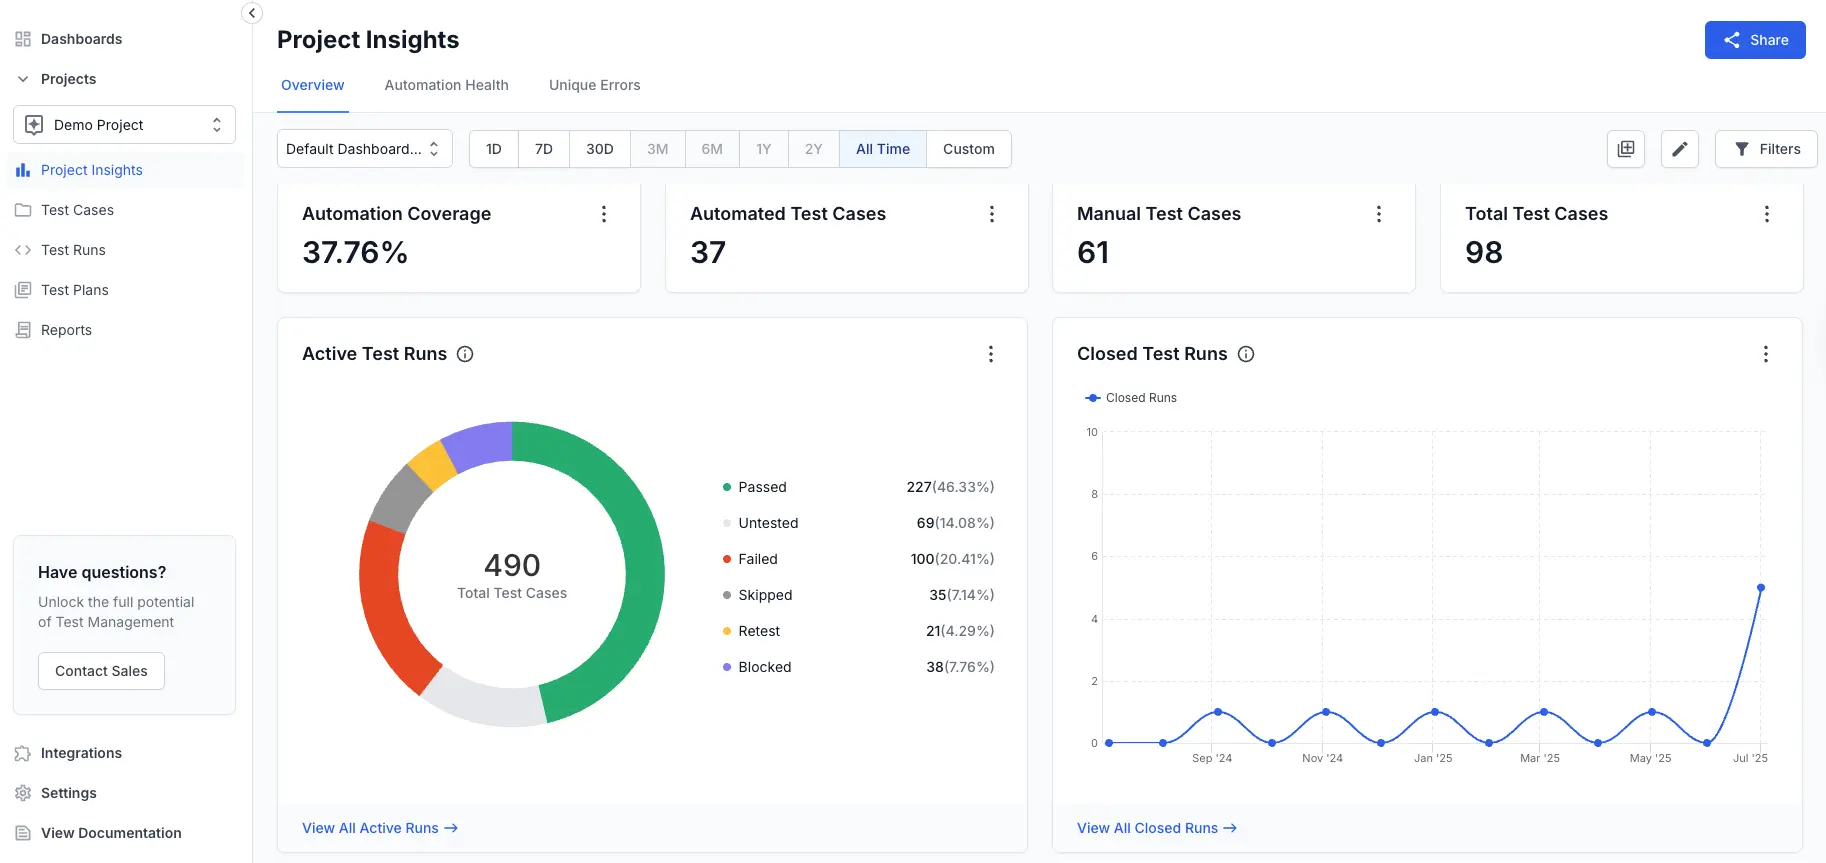
The project insights dashboard provides an overview of your testing activities and performance metrics. It allows you to quickly assess test progress, automation coverage, and test case health across your project.
Dashboard overview
Your dashboard includes interactive widgets that visually summarize key metrics:
Widgets overview
-
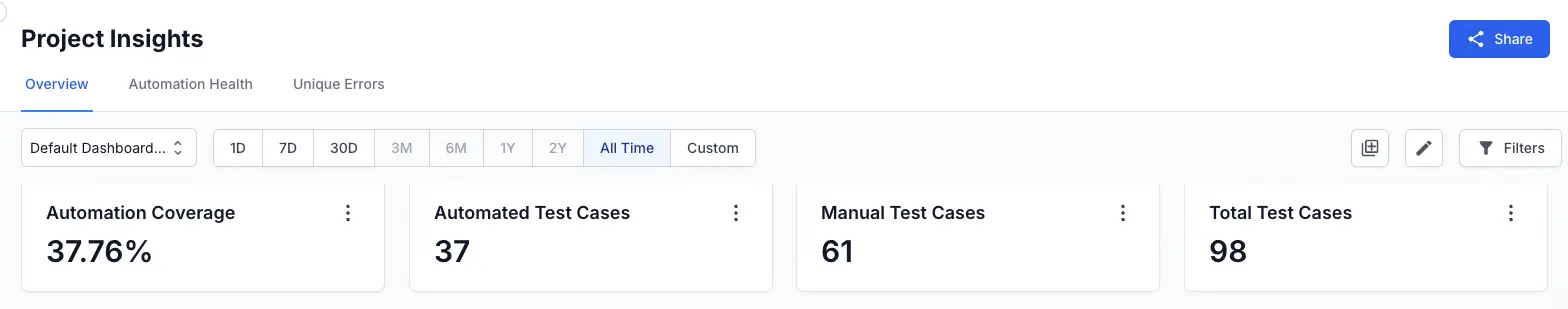
Automation coverage: Displays the percentage of automated test cases compared to the total test cases.
-
Automated test cases: Shows the number of automated test cases.
-
Manual test cases: Shows the number of manual test cases.
-
Total test cases: Displays the combined total of manual and automated test cases.
Detailed widgets
Following are the widgets available by default on the dashboard:
-
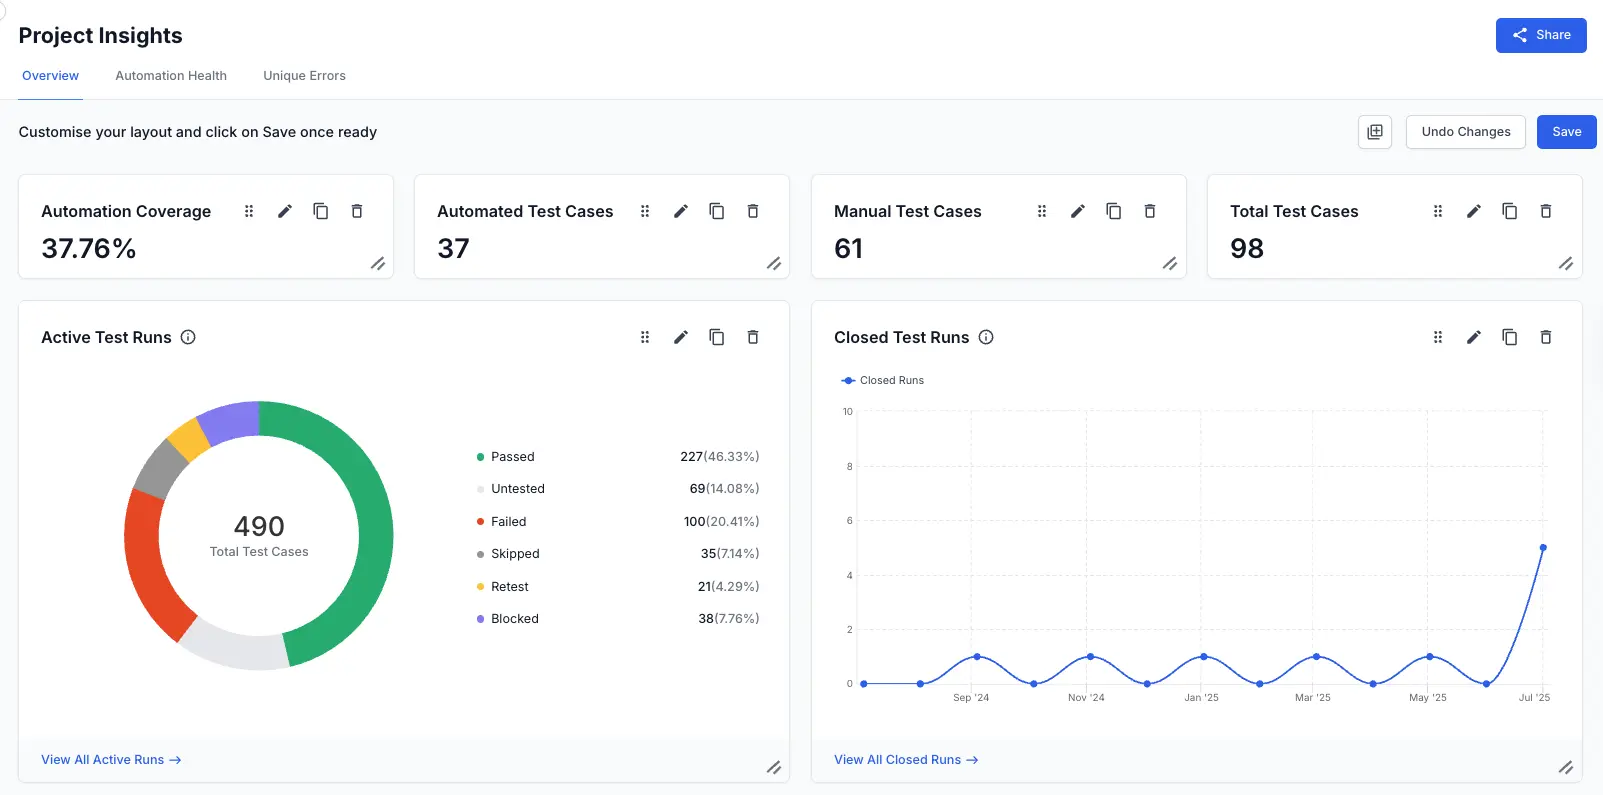
Active Test Runs: This widget provides a visual representation of test case statuses (
Passed,Untested,Failed,Skipped,Retest,Blocked) in currently active test runs. For more information, refer to the Active Test Runs widget documentation. -
Closed Test Runs: This widget tracks the number of test runs closed over a defined time period. For more information, refer to the Closed Test Runs widget documentation.
-
Results from Closed Test Runs: This widget shows the distribution of test outcomes (
Passed,Failed,Skipped,Blocked) from previously closed test runs. For more information, refer to the Results from Close Test Runs widgetdocumentation. -
Test cases breakdown: This widget shows how your test cases are distributed across a property you choose, such as priority, owner, type, state, or automation status. For more information, refer to the Test cases breakdown widget documentation.
-
Statistics cards: This widget displays essential test case data in a clear numeric format. It helps you instantly see critical test metrics. For more information, refer to the Statistics cards widget documentation.
-
Trend of Test Cases: This widget illustrates the growth or changes in different types of test cases over time. For more information, refer to the Trend of Test Cases widget documentation.
-
Defects Logged: This widget provides insights into the defects associated with test runs, tracked over time. For more information, refer to the Defects Logged widget documentation.
Customize the dashboard
Customize your dashboard to suit your project’s unique needs:
Add widgets
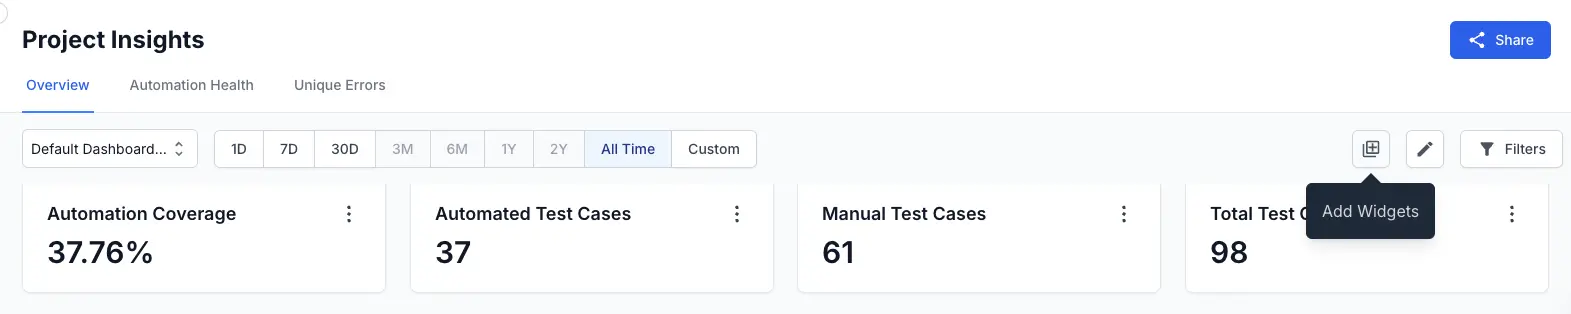
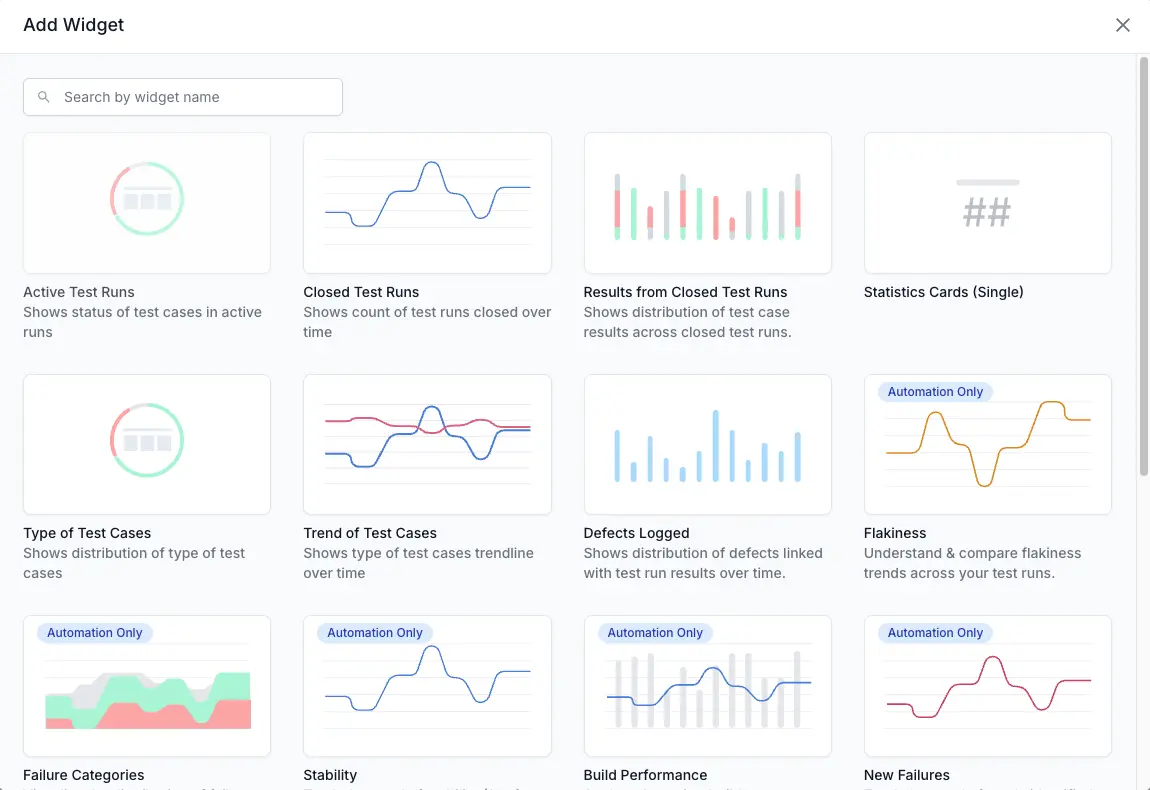
To add widgets to your project insights dashboard:
-
On the project insights dashboard, click on Add Widgets icon.
-
Choose your desired widget from the displayed options.
-
Click to add it to your dashboard.
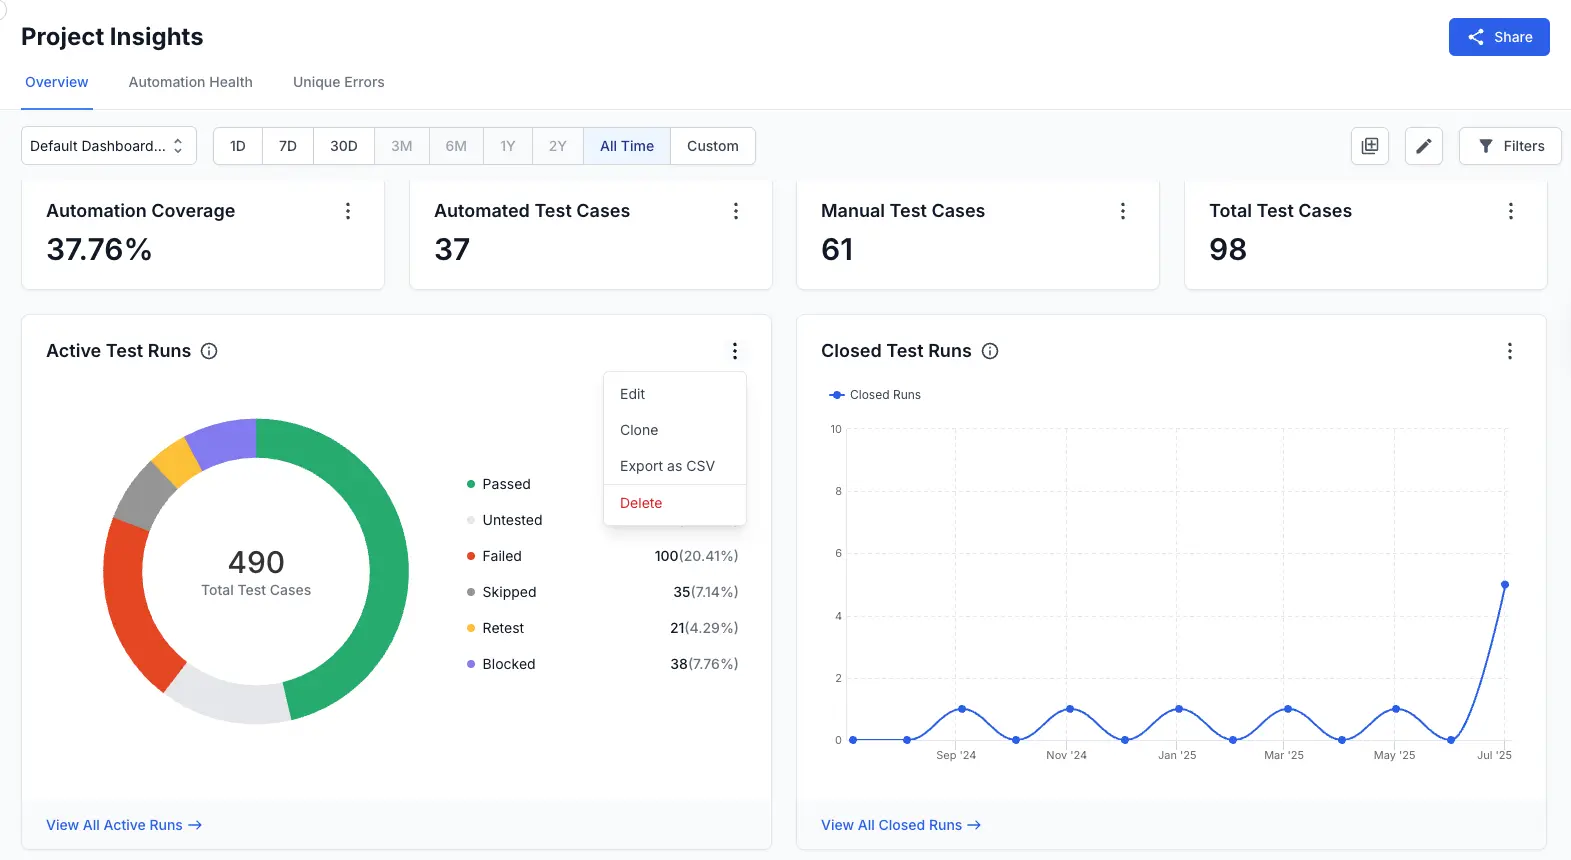
Managing widgets
Widgets can be edited, cloned, exported as CSV, or deleted. To perform one of these actions:
-
Access these options by clicking the options menu (⋮) located on the right-top each widget.
Adjust time filters
You can choose to view the data from a defined time range. Select a predefined period (1D, 7D, 30D, All Time, etc.) or set a Custom date range to refine your view.
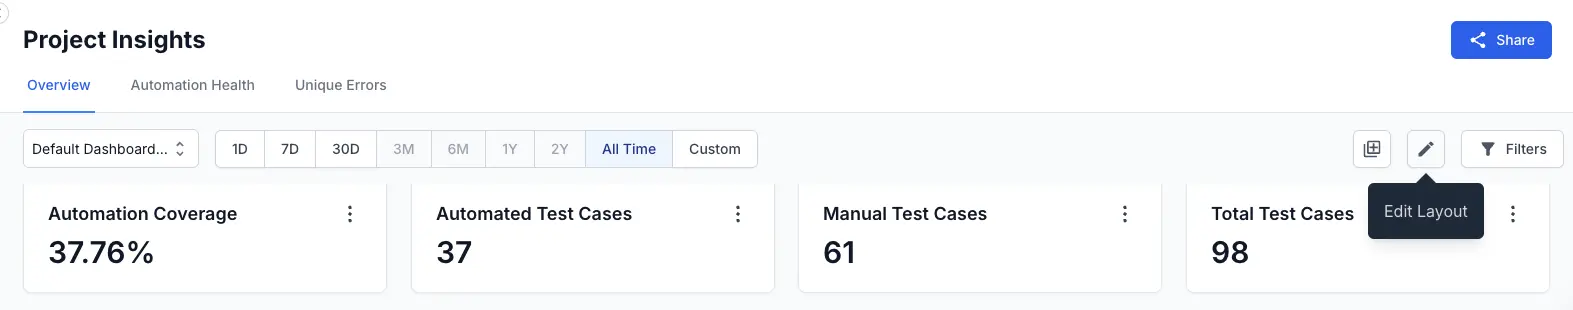
Edit layout of you dashboard
You can rearrange and resize widgets on your dashboard to create a layout that best suits your needs.
To edit the layout of your dashboard:
-
Click the edit layout icon (represented by a pencil) located in the top right corner of the dashboard.
-
In the edit mode, click and hold (⋮⋮) icon on the desired widget, and drag and drop them to rearrange their positions.
-
Resize widgets by dragging their corners to adjust their width and height.
-
After making your desired changes, click Save to apply the new layout
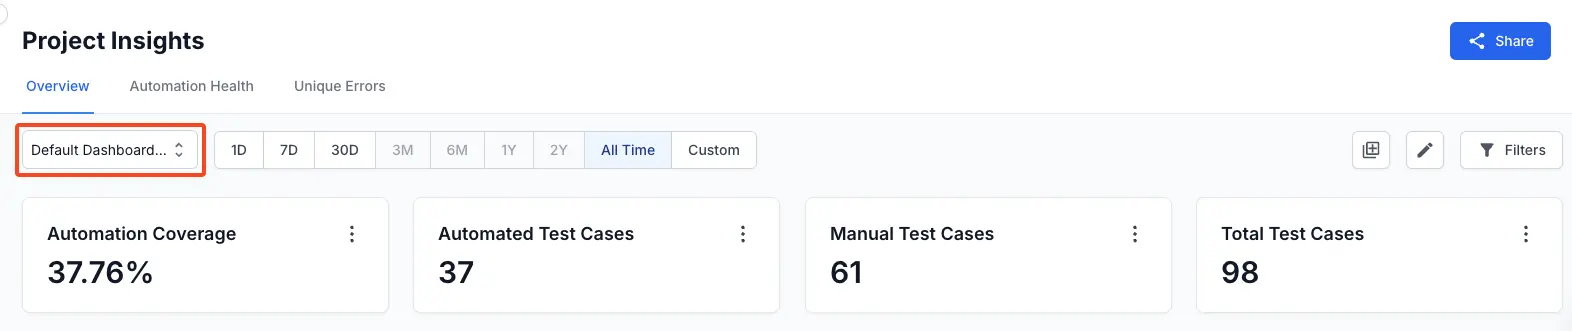
Change dashboard views
You can switch between different predefined or custom dashboard views to quickly access relevant insights.
To change your dashboard view:
-
Locate the dashboard view dropdown menu in the top left corner of the dashboard.
-
Click the dropdown to reveal a list of available dashboard views.
-
Select the view you wish to switch to. The dashboard will update to display the selected view.
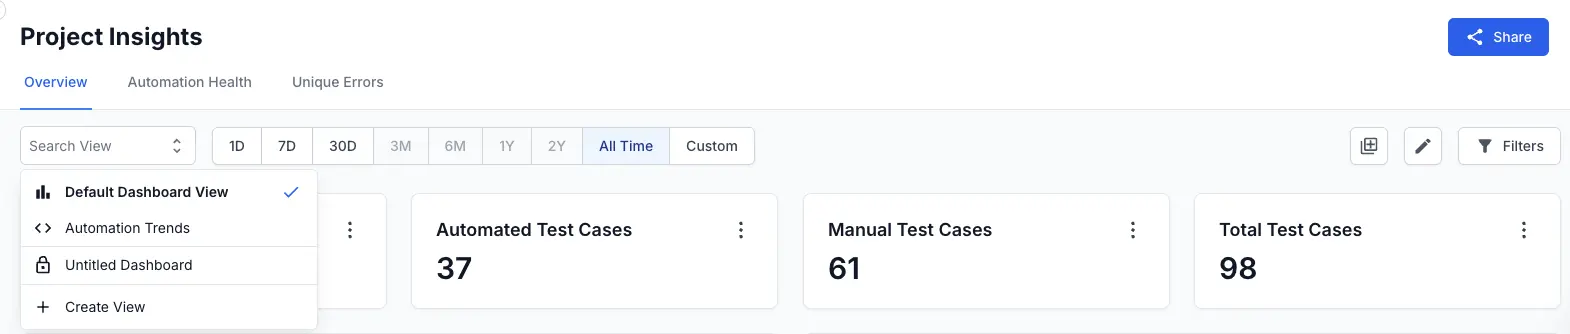
-
You can choose to create new view by selecting Create View.
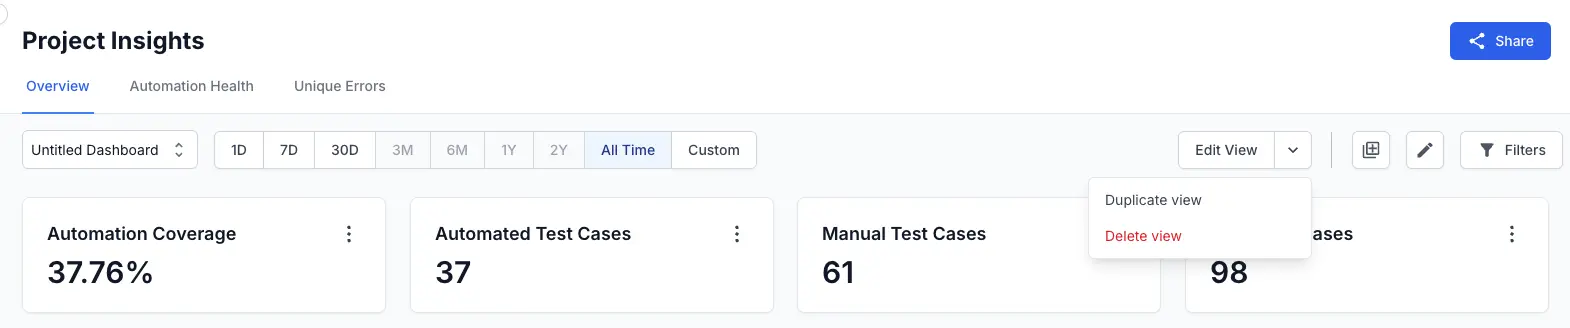
Duplicate a custom view
If you have an existing custom dashboard view that you want to use as a template for a new one, you can duplicate it. This creates an editable copy without altering the original.
To duplicate a custom view:
-
From the dashboard view dropdown, select the custom view you wish to duplicate.
-
Click the Edit View dropdown menu, then select Duplicate view.
-
In the Clone Dashboard View dialog, enter a Dashboard View Name for the new duplicated view.
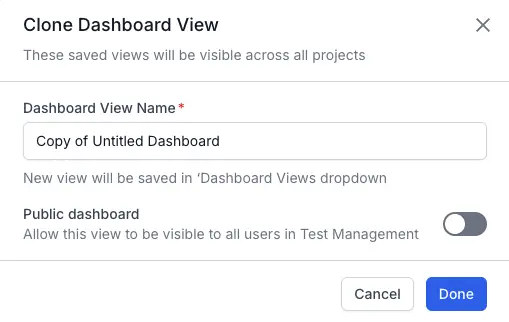
-
Toggle Public dashboard on or off to control its visibility to other users.
-
Click Done to create the duplicated view.
Delete a custom view
You can remove custom dashboard views that are no longer needed.
To delete a custom view:
-
From the dashboard view dropdown, select the custom view you wish to delete.
-
Click the Edit View dropdown menu, then select Delete view.
-
In the Delete Dashboard View confirmation dialog, review the warning that deleting the view is permanent and cannot be undone.
-
Click Delete to confirm and remove the custom view. Click Cancel to keep the view.
Use filters in the dashboard
Filters allow you to narrow down the data displayed on your dashboard to focus on specific criteria, such as users or test run names.
To apply filters to your dashboard:
-
Click the Filter button located in the top right corner of the dashboard. The Filters sidebar will appear on the right.
-
In the Users field, you can filter the dashboard data by specific user(s).
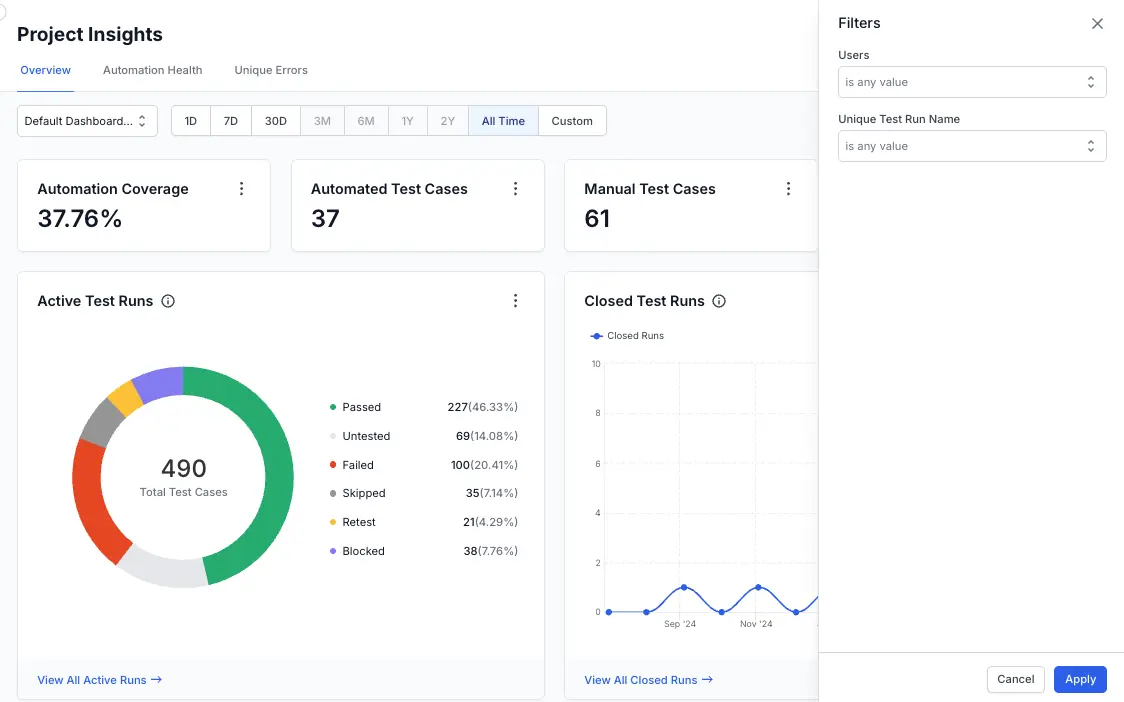
-
Click the dropdown menu next to is any value.
-
Select the users you want to include in the filter. You can select multiple users.
-
In the Unique Test Run Name field, you can filter the dashboard data by specific test run names.
-
Click the dropdown menu next to is any value.
-
Select the unique test run names you want to include in the filter.
-
After selecting your desired filters, Click Apply.
We're sorry to hear that. Please share your feedback so we can do better
Contact our Support team for immediate help while we work on improving our docs.
We're continuously improving our docs. We'd love to know what you liked
We're sorry to hear that. Please share your feedback so we can do better
Contact our Support team for immediate help while we work on improving our docs.
We're continuously improving our docs. We'd love to know what you liked
Thank you for your valuable feedback!