Run an Exploratory Session
Learn how to run an exploratory session in BrowserStack Test Management, including adding log entries, setting statuses, and tracking time.
Add timestamped log entries, assign statuses, and track your testing time as you work through an exploratory session.
Session execution UI
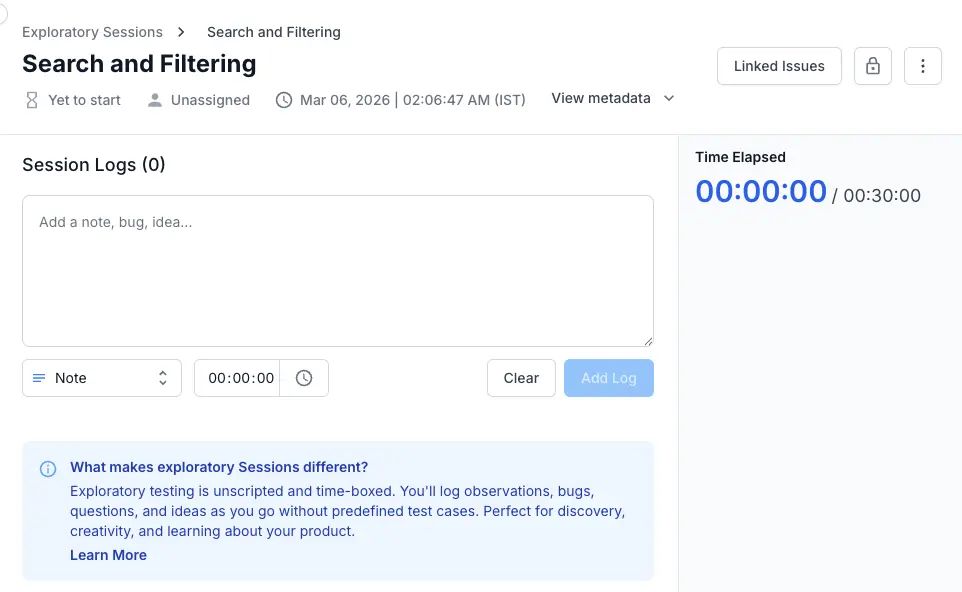
When you open an active session, you land on the Session Execution UI. This is your workspace for the entire session. It has three main areas:
-
The session header at the top shows the session title, status, assignee, creation timestamp, and a View metadata dropdown for session details. The Linked Issues button in the top-right corner lets you view and manage requirements and defects connected to this session.
-
The session log in the center is where you add entries. It includes a rich text editor, a log type selector, a timestamp field, and the timeline of all entries added so far.
-
The elapsed-time counter on the right side tracks testing duration against the timebox you defined at creation. For example,
00:04:43 / 00:15:00means you have spent 4 minutes and 43 seconds of a 15-minute timebox.
Add a log entry
Each log entry represents a single observation, test result, or finding during your session.
-
Type your observation in the rich text editor.
-
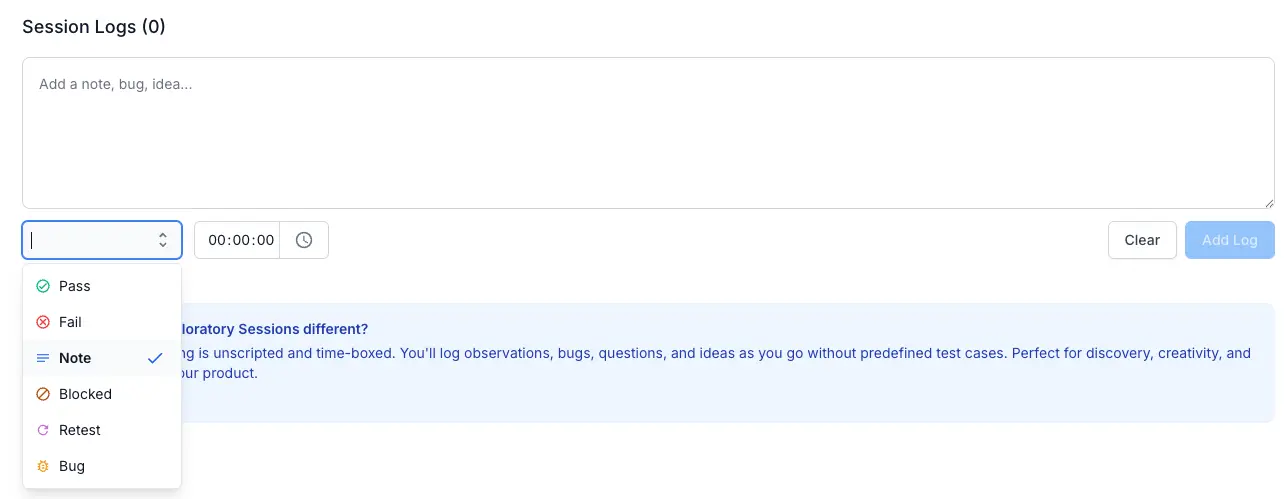
Select the log type from the dropdown below the editor. The default is Note. Click the dropdown to choose from six available statuses.
-
Optionally, set a timestamp for the entry. By default, the timestamp is
00:00:00. Click the time field to open a picker with scrollable wheels for hours, minutes, and seconds. The timestamp lets you record when during the session you made the observation. This is useful when you are logging findings after the fact or want precise time correlation.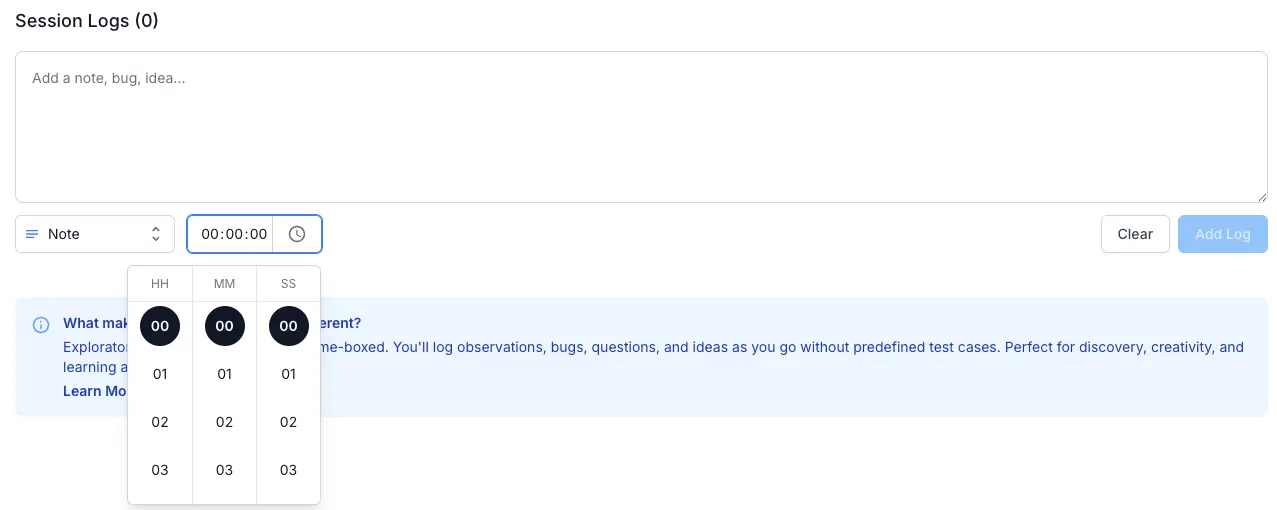
-
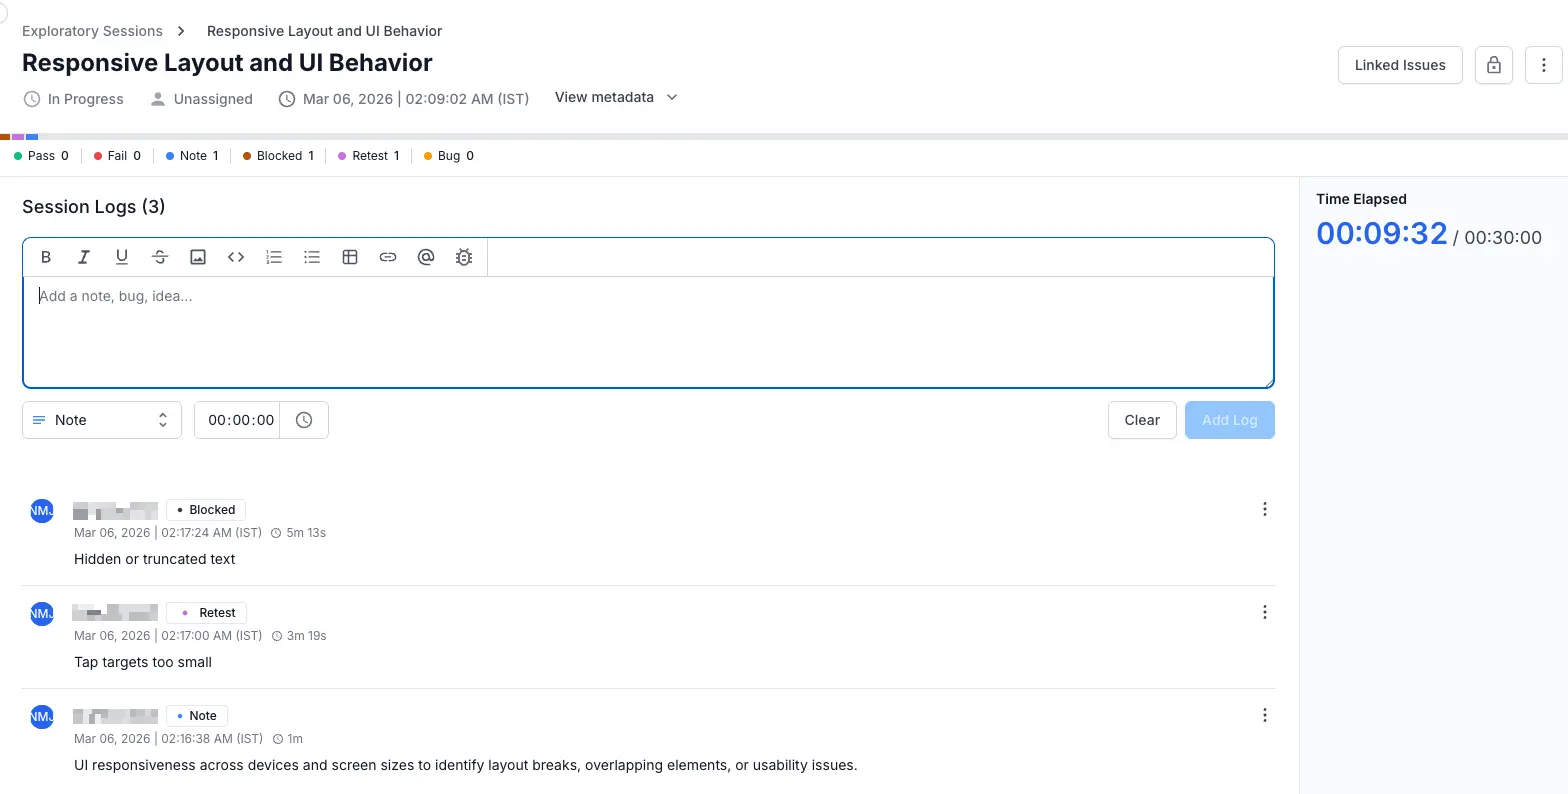
Click Add Log to save the entry. The entry appears in the session log timeline below, showing the author’s name, log type badge, creation date/time, elapsed time marker, and the entry content.
To discard what you have typed without saving, click Clear.
You have added your first log entry. The session status automatically moves from Yet to start to In Progress after the first entry is saved.
The session log timeline
Entries appear in reverse chronological order (newest first) in the session log. Each entry displays:
-
Author name and avatar identifying who created the entry.
-
Status badge (color-coded) showing the log type: Pass, Fail, Note, Blocked, Retest, or Bug.
-
Date, time, and elapsed marker showing when the entry was created and how far into the session it was added (for example,
4mmeans 4 minutes elapsed). -
Entry content as rich text, including any embedded images, code blocks, or tables.
For entries with the Bug status, a Link Bug button appears on the right side of the entry. This lets you connect the finding to an issue in your linked tracker. See Link issues to a session for details.
The status bar
At the top of the session page, a color-coded status bar gives you a visual summary of your session’s findings. Each status shows its count.
For example: Pass 1, Fail 1, Note 1, Blocked 0, Retest 1, Bug 1. The bar also renders as a proportional color strip, so you can see the distribution of findings at a glance.
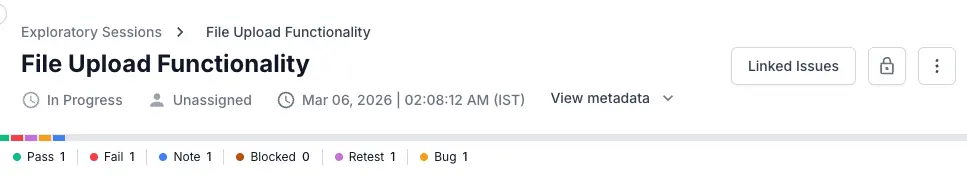
This summary updates in real time as you add log entries.
The elapsed-time counter
The elapsed-time counter sits in the top-right corner of the session page. It displays time spent against the timebox in the format HH:MM:SS / HH:MM:SS (elapsed / total).
The counter helps you stay within your planned timebox, but it does not enforce it. When the elapsed time exceeds the timebox, the session remains open. You can keep adding log entries for as long as you need.
The rich text editor
The editor in the log entry area supports the following formatting options:
-
Text formatting includes bold, italic, underline, and strikethrough. Use these to emphasize key findings or distinguish expected from actual behavior.
-
Code blocks let you paste error messages, stack traces, or API responses with proper formatting. Click the code block icon (
< >) to insert one. -
Lists include both bulleted and numbered varieties. Use numbered lists for reproduction steps and bulleted lists for collections of observations.
-
Tables help you organize structured data like form inputs and their results.
-
Images can be embedded directly in the log entry. Click the image icon to upload a screenshot or paste one from your clipboard. This is especially useful for visual bugs, layout issues, or unexpected UI states.
-
Links let you reference external resources. Click the link icon to add a URL.
-
Mentions let you tag team members using the
@symbol. The tagged person receives a notification. -
Bug logging is accessible via the bug icon at the end of the toolbar. Click it to flag the current log entry as a bug and initiate the defect linking flow without leaving the editor.
Typical session workflow
Here is a complete session from start to finish for a session logger testing a checkout flow:
-
Start: Open the session. Read the mission. Set up your test environment to match the session’s configuration.
-
Test and log: Begin testing. As you explore, add log entries for each action or finding. Mark passing behaviors as Pass, issues as Fail or Bug, and observations as Note.
-
Link defects: When you find a bug, add a Bug entry and click Link Bug to create or link an issue in Jira (or your configured tracker). This gives you traceability between the session log and your defect backlog.
-
Track time: Glance at the counter periodically to stay within your timebox. If you are running low on time, shift focus to the highest-risk areas you have not covered yet.
-
Close: When you have finished testing, close the session from the session page or the list view. Closing makes the session read-only and moves it to the Closed Sessions tab. See Edit, close, and delete Exploratory Sessions for details.
Next steps
-
To connect your session findings to your issue tracker, see Link issues to an Exploratory Session.
-
To finalize or modify a session after testing, see Edit, close, and delete Exploratory Sessions.
We're sorry to hear that. Please share your feedback so we can do better
Contact our Support team for immediate help while we work on improving our docs.
We're continuously improving our docs. We'd love to know what you liked
We're sorry to hear that. Please share your feedback so we can do better
Contact our Support team for immediate help while we work on improving our docs.
We're continuously improving our docs. We'd love to know what you liked
Thank you for your valuable feedback!