Test Automation Dashboard
Test Automation Dashboard to track Test Suite Health
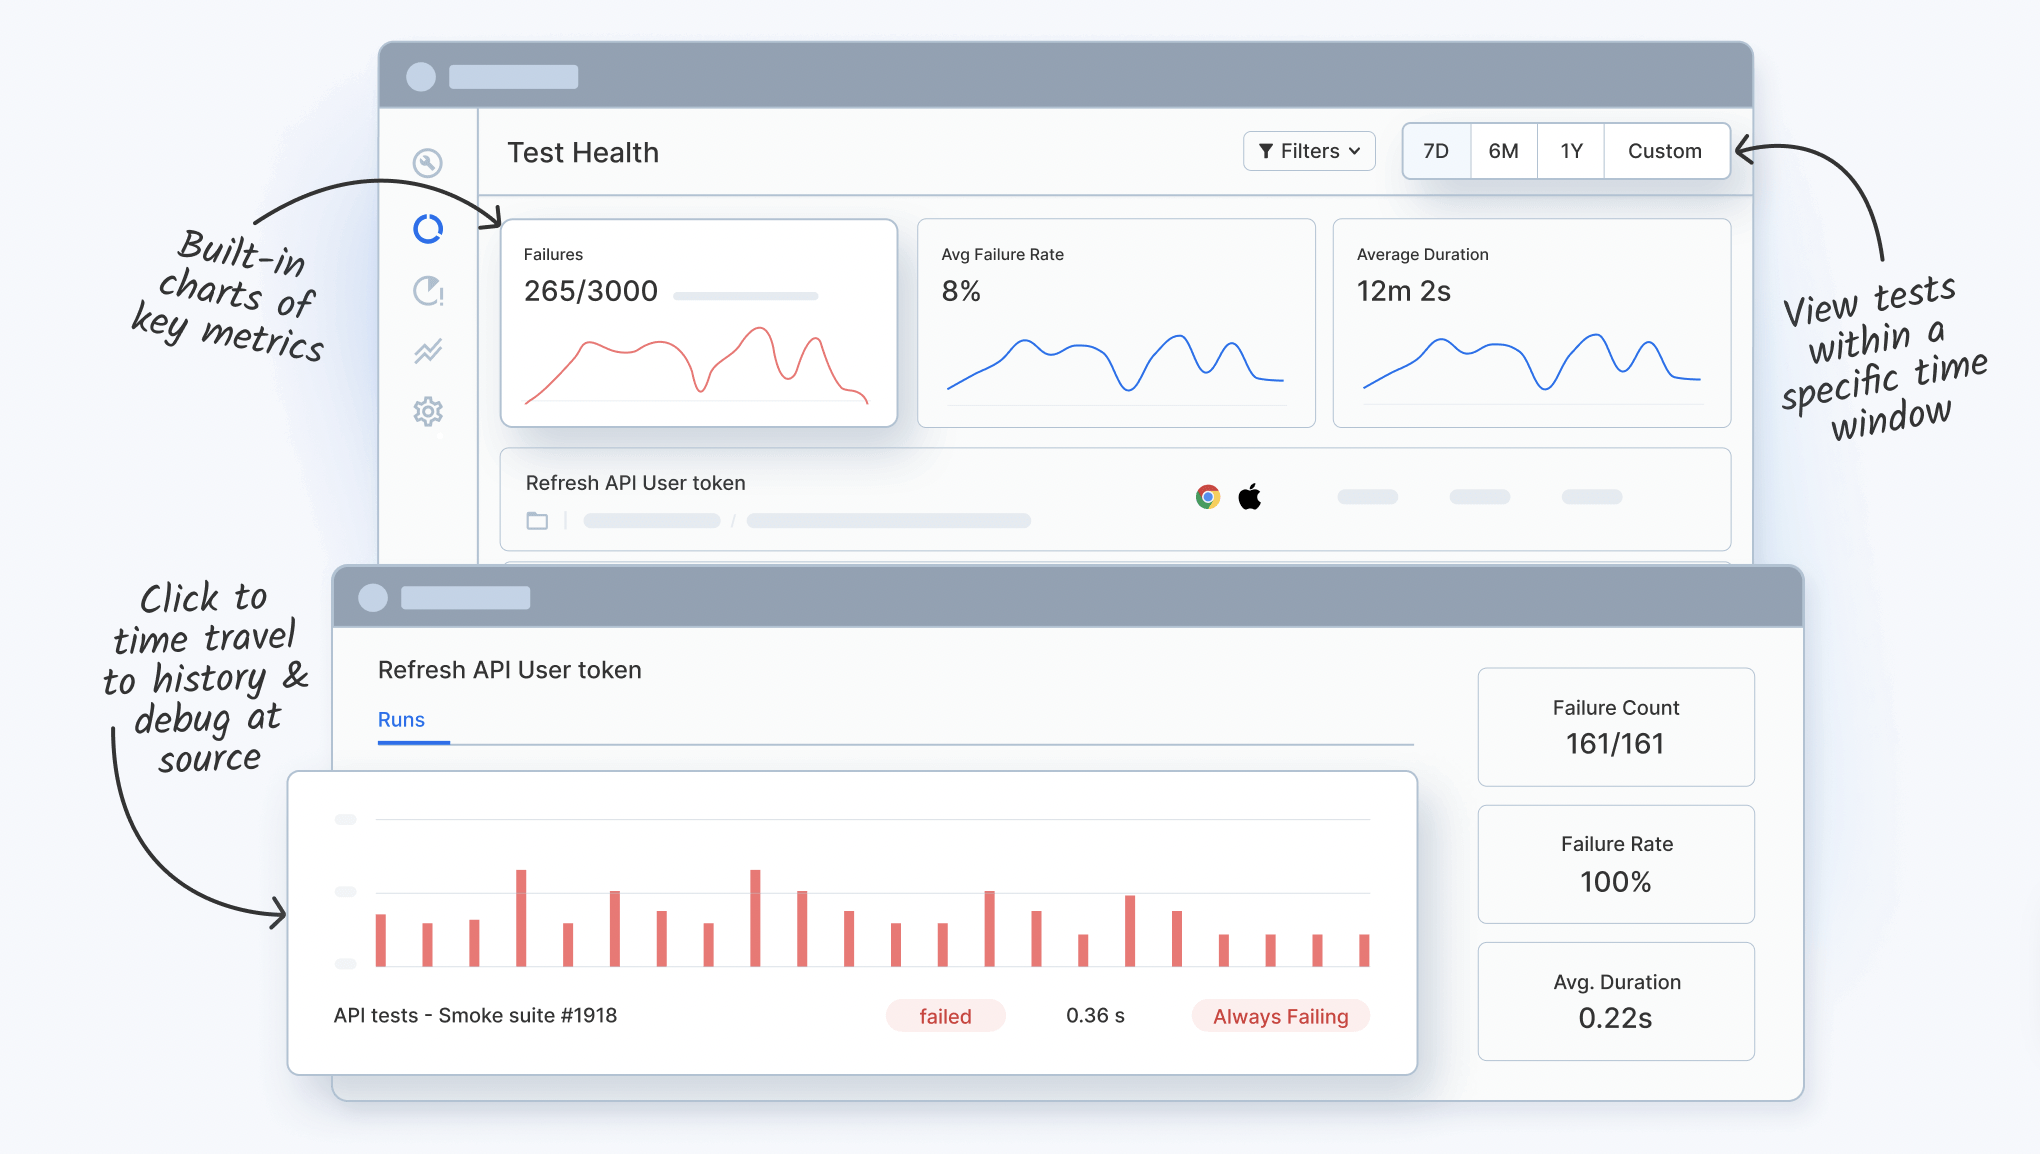
Keep a track of Test Suite Health and get consolidated insights for all the build runs in a central dashboard using BrowserStack Test Reporting and Analytics. Save time on triage and debug test failures after every run using AI-driven Reporting and Analytics.
How to create a Custom Test Automation Dashboard
BrowserStack Test Reporting and Analytics is an integrated platform that checks Test Suite Health and offers a centralized Test Automation Dashboard:
- Select Dashboards from the menu.
- Select a widget from the options such as Failure Categories.
- Configure the widget using the available options and click Done.
- Name the Dashboard and it’s ready with the detailed insights from different build runs.

You can create, manage, download, and share dashboards with Test Reporting and Analytics.
Features
 | Get Detailed Test Build InsightsYou can access comprehensive test build insights like performance, flakiness, new failures, always failing, build stability, run summary, and more. | |
 | Track Failure Rate of Test BuildsKnow the performance of each test build and track the failure rate of tests, flakiness, and average failure rate to keep an eye on the health of test suite. | |
 | Complete End-to-End VisibilityInteractive testing trends charts that provide a 360-degrees end to end visibility into automation metrics for all teams, projects and modules. | |
 | Understand Impact of Unique ErrorsGet Detailed analytics on Unique errors. View how many tests each error impacts to easily prioritize error debugging. | |
 | Enhanced Debugging with Rich ArtifactsEffectively identify and debug any issues in your test build with detailed analytics and rich artifacts on the central test automation dashboard. | |
 | Get Historical Data and TrendsIdentify trends with comprehensive historical data for all re-runs and merged runs of test builds for a better understanding of reoccurring issues. | |
Frequently Asked Questions
Test Automation Dashboard is a centralized Test Reporting platform offered by BrowserStack Test Reporting and Analytics that provides detailed insights and visualizations of various test build runs together for better analysis.
Automation Testing Dashboard gives a complete 360-degree view of the test runs through a centralized multi-dimensional report containing rich insights and artifacts. This speeds up debugging and decision-making for high-quality software delivery.
You can easily create a centralized Custom Test Report Dashboard using BrowserStack Test Reporting and Analytics in 3 simple steps:
- Select Dashboards from the Test Observability menu.
- Select a widget from the options and configure it.
- Name the Dashboard
BrowserStack Test Reporting and Analytics offers AI-driven Test Automation Dashboard with rich insights and artifacts for faster triage and debugging. It integrates well with different frameworks and CI pipelines for a consolidated test run report from multiple triggers across different frameworks.
