Debug WebViews with WebView Inspector
Inspect and debug WebView elements in your mobile apps using the WebView Inspector in App Live.
The WebView Inspector feature is available under the Pro plan. You can also access the feature if you are in the Pro trial period. For more details check out our pricing page.
Using WebView Inspector, you can inspect HTML DOM elements, debug JavaScript, view console logs, and analyze WebView-specific network traffic of WebView elements in your mobile apps directly within App Live. The inspector displays WebViews that are available on the current app page, allowing you to focus on debugging active content.
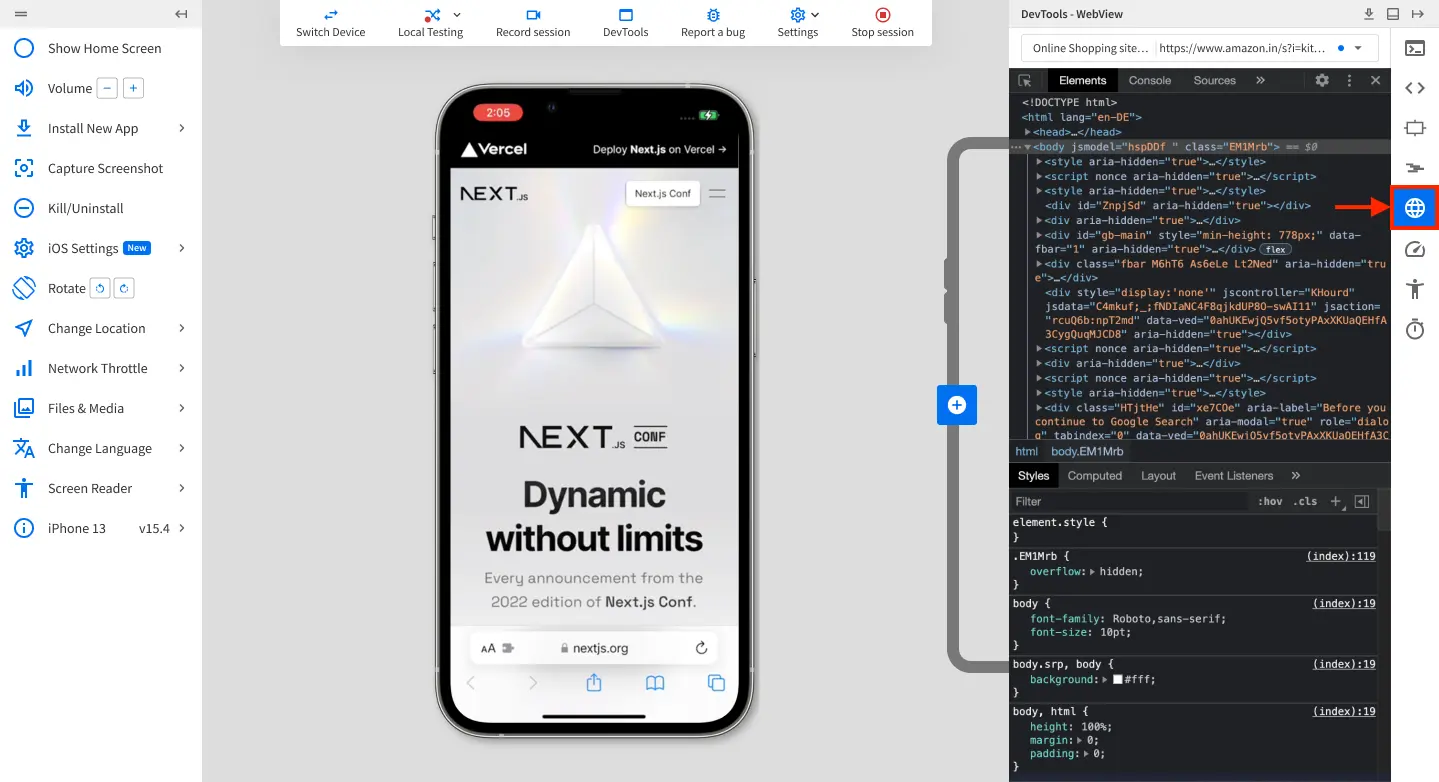
The WebView Inspector is available in the DevTools toolbar on the testing dashboard.
Supported platforms
The following platforms support WebView Inspector:
| Platform | Supported versions |
|---|---|
| Android | V13 and later |
| iOS | V16 and later |
Access WebView Inspector
To inspect and debug WebView elements in your app, use the WebView Inspector in the DevTools section of the testing dashboard:
- Log in to the App Live dashboard.
- Upload or install your app, then select a device from the list to launch your test session. For more details on app sources, see Get started (Select app sources).
- On the DevTools pane, click the WebView Inspector icon in the DevTools toolbar. The WebView Inspector pane opens and displays the WebViews available on the current app page.
If the page contains no WebViews, or if the WebView is unavailable or expired, the pane shows a WebView data not found error.
Switch between WebViews
If your app uses multiple WebViews on a page, you can switch between them:
- In the WebView Inspector pane, click the dropdown menu at the top. The dropdown displays all available WebView contexts on the current page.
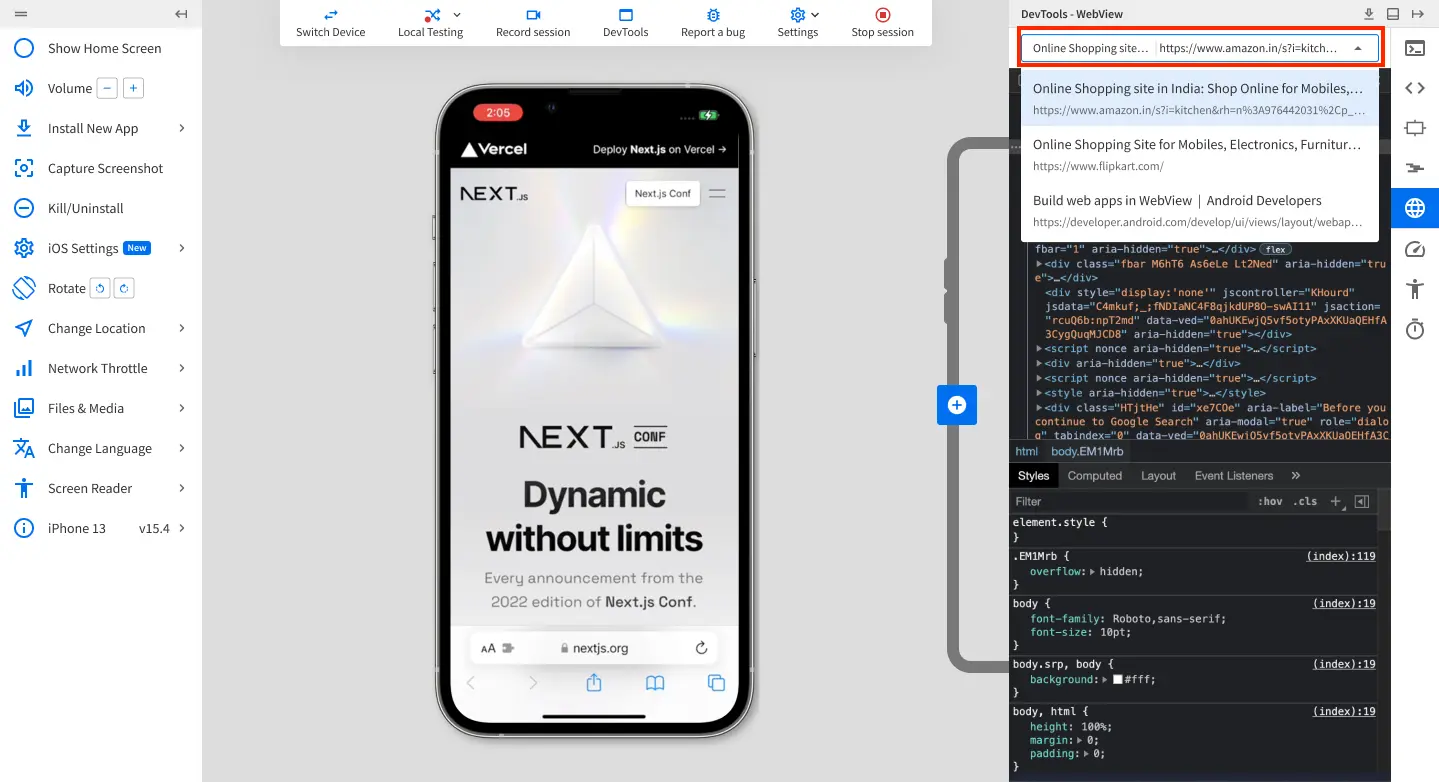
- Select the WebView context you want to inspect from the list. The inspector updates to show the selected context.
We're sorry to hear that. Please share your feedback so we can do better
Contact our Support team for immediate help while we work on improving our docs.
We're continuously improving our docs. We'd love to know what you liked
We're sorry to hear that. Please share your feedback so we can do better
Contact our Support team for immediate help while we work on improving our docs.
We're continuously improving our docs. We'd love to know what you liked
Thank you for your valuable feedback!