New dashboard in Automate
Learn the exciting benefits and features of the new dashboard and how to perform actions that you did in the old dashboard experience using the new dashboard.
We are introducing a new dashboard experience powered by the Test Reporting & Analytics platform as the default experience for all test reporting.
With the new dashboard, Automate and App Automate users get a more organized, efficient, and insightful way to manage and analyze test results. The new dashboard streamlines the testing process, reduces testing cycle time, and provides deeper insights into test failures, flakiness, and overall test health.
Fundamental differences from the old dashboard
The following table summarizes the fundamental differences between the old and new dashboards:
| Old dashboard | New dashboard |
|---|---|
| Information is organized around browser sessions (a browser session starts from the moment the test is instantiated on the BrowserStack infra and ends when it is closed). Each session represents a single browser instance in which there could be multiple tests, which makes it difficult to track and analyze tests granularly. | Information is organized around tests. The new dashboard groups these tests automatically and you can directly view information like test status and other metrics. |
| No association existed between sessions. The old dashboard didn’t offer any history or relationship between runs. Useful information like a regularly failing session running fine or vice versa was absent. | Maintains a history of test runs and builds. The new dashboard tracks and presents trends, flakiness, and failure patterns out of the box. |
| Groups build runs entirely depending on the build names. It was upto the users to ensure that the build names are unique by appending a build identifier. | Automatically detects multiple runs of the same build and maintains a build run number. You don’t need to add a build identifier. The grouping happens automatically. |
How to access build runs, tests, sessions, and video recordings
The new dashboard allows you to perform all the actions you could do on the old dashboard, with additional enhancements.
Access build runs
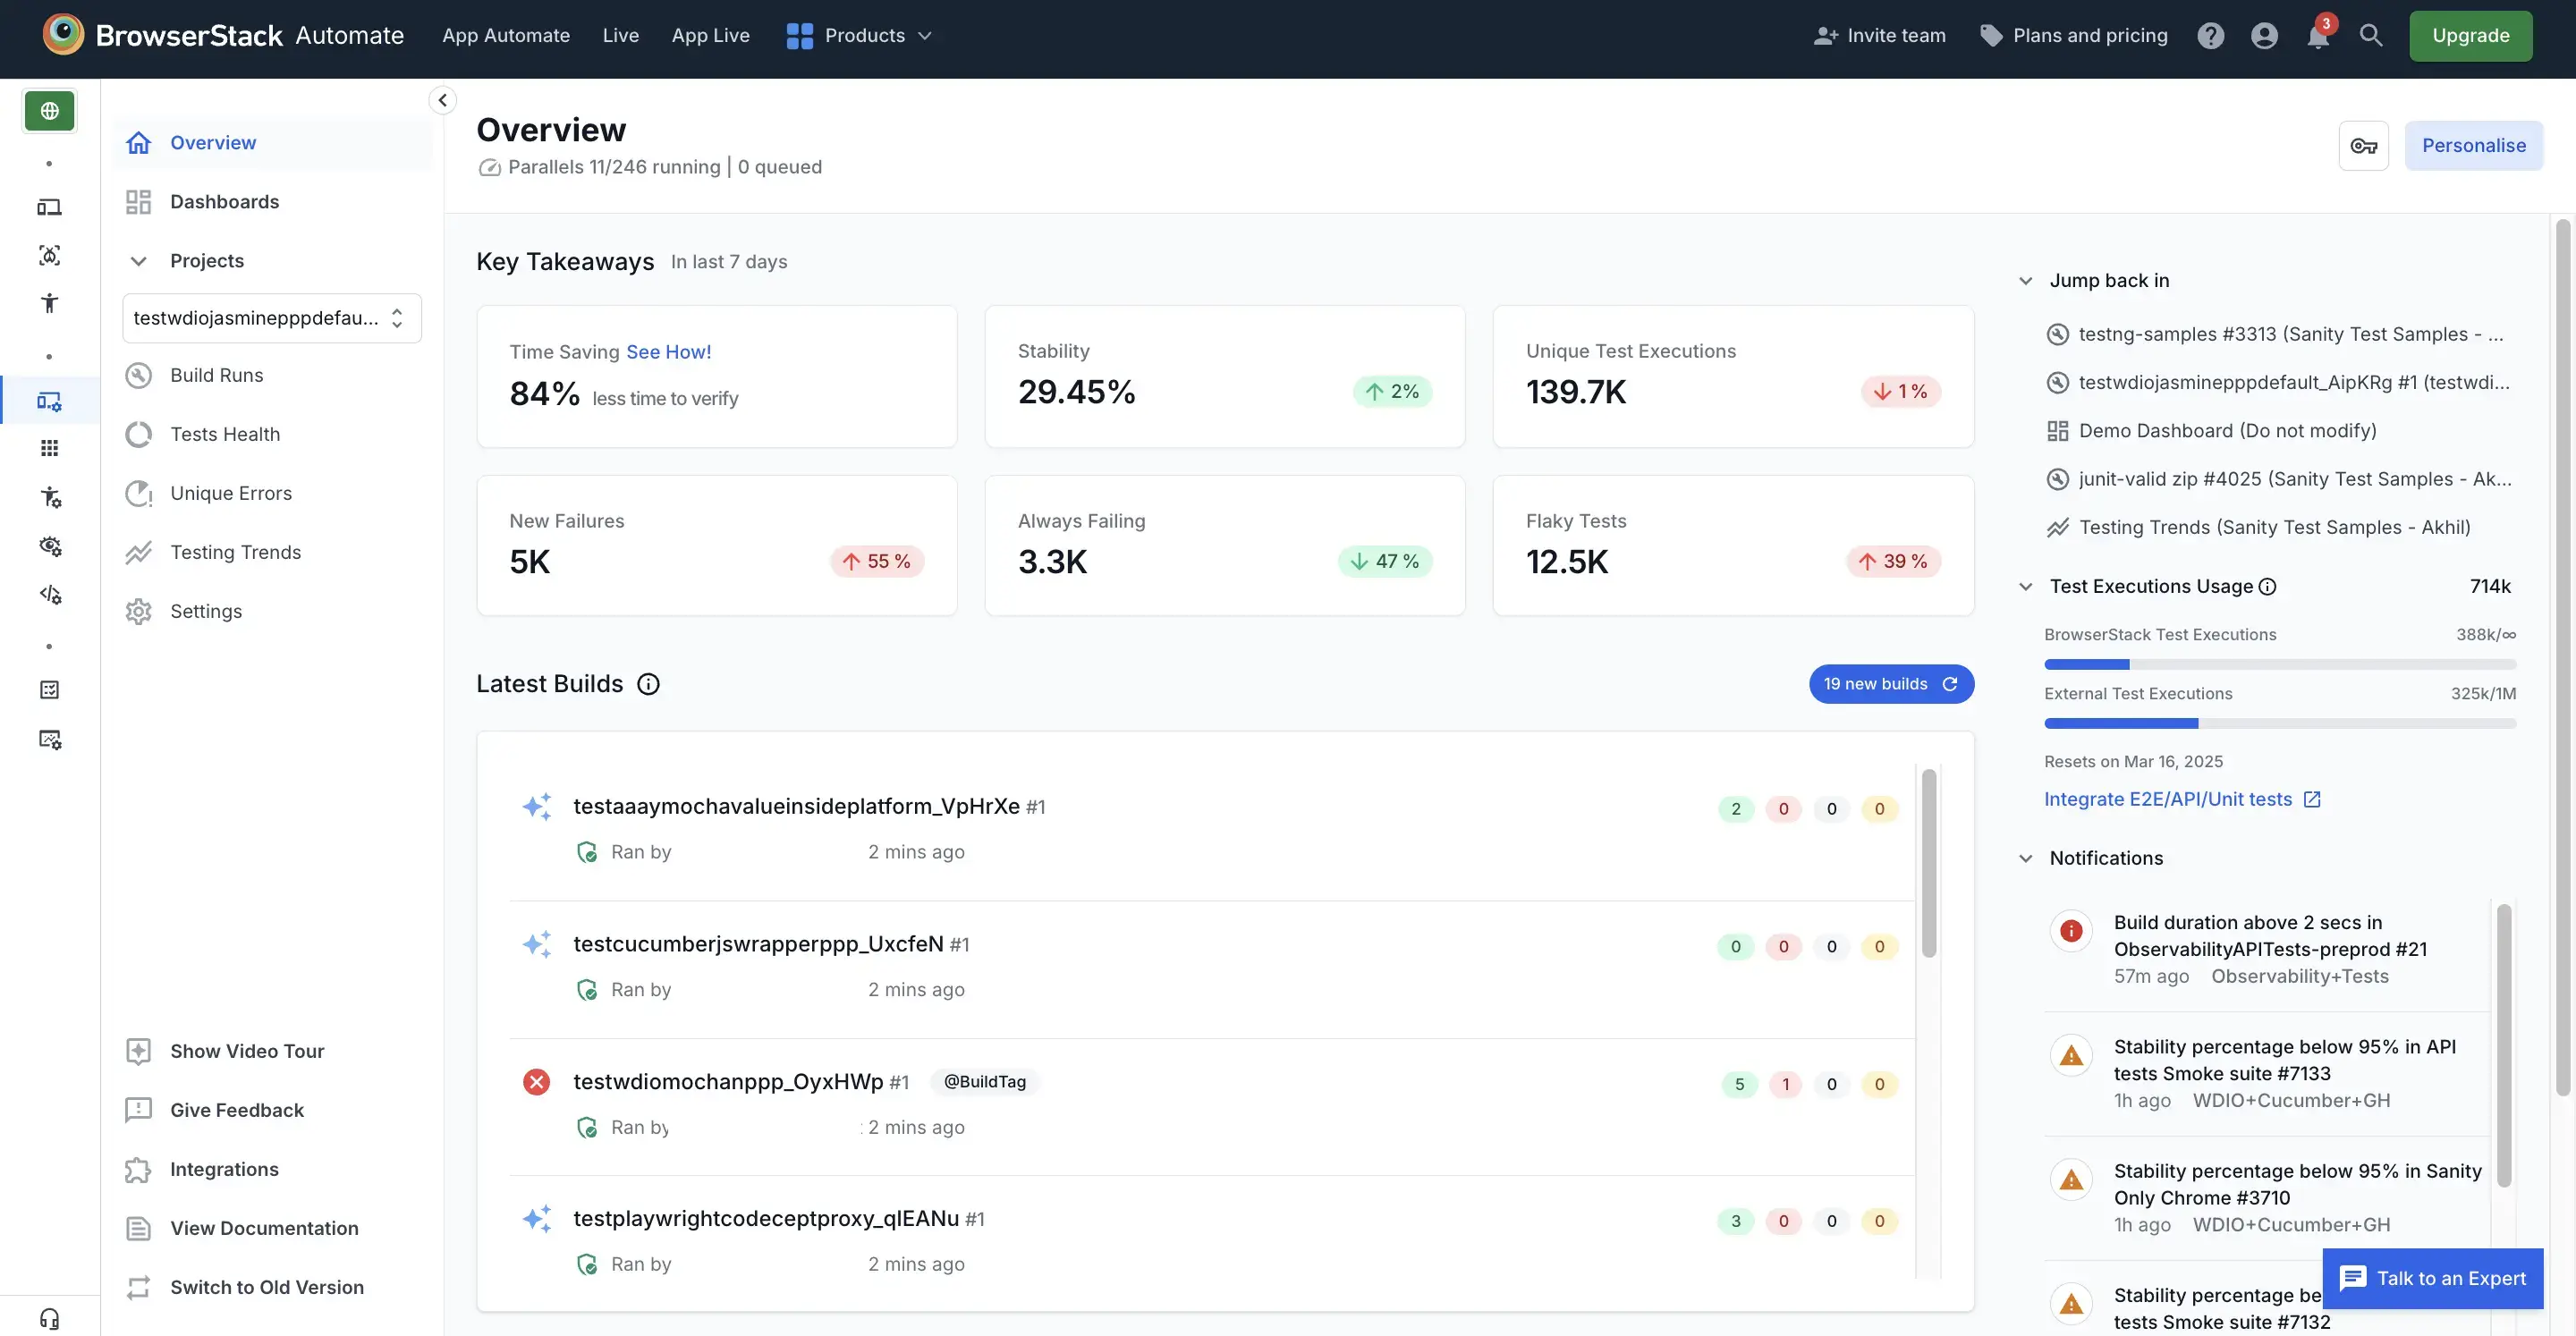
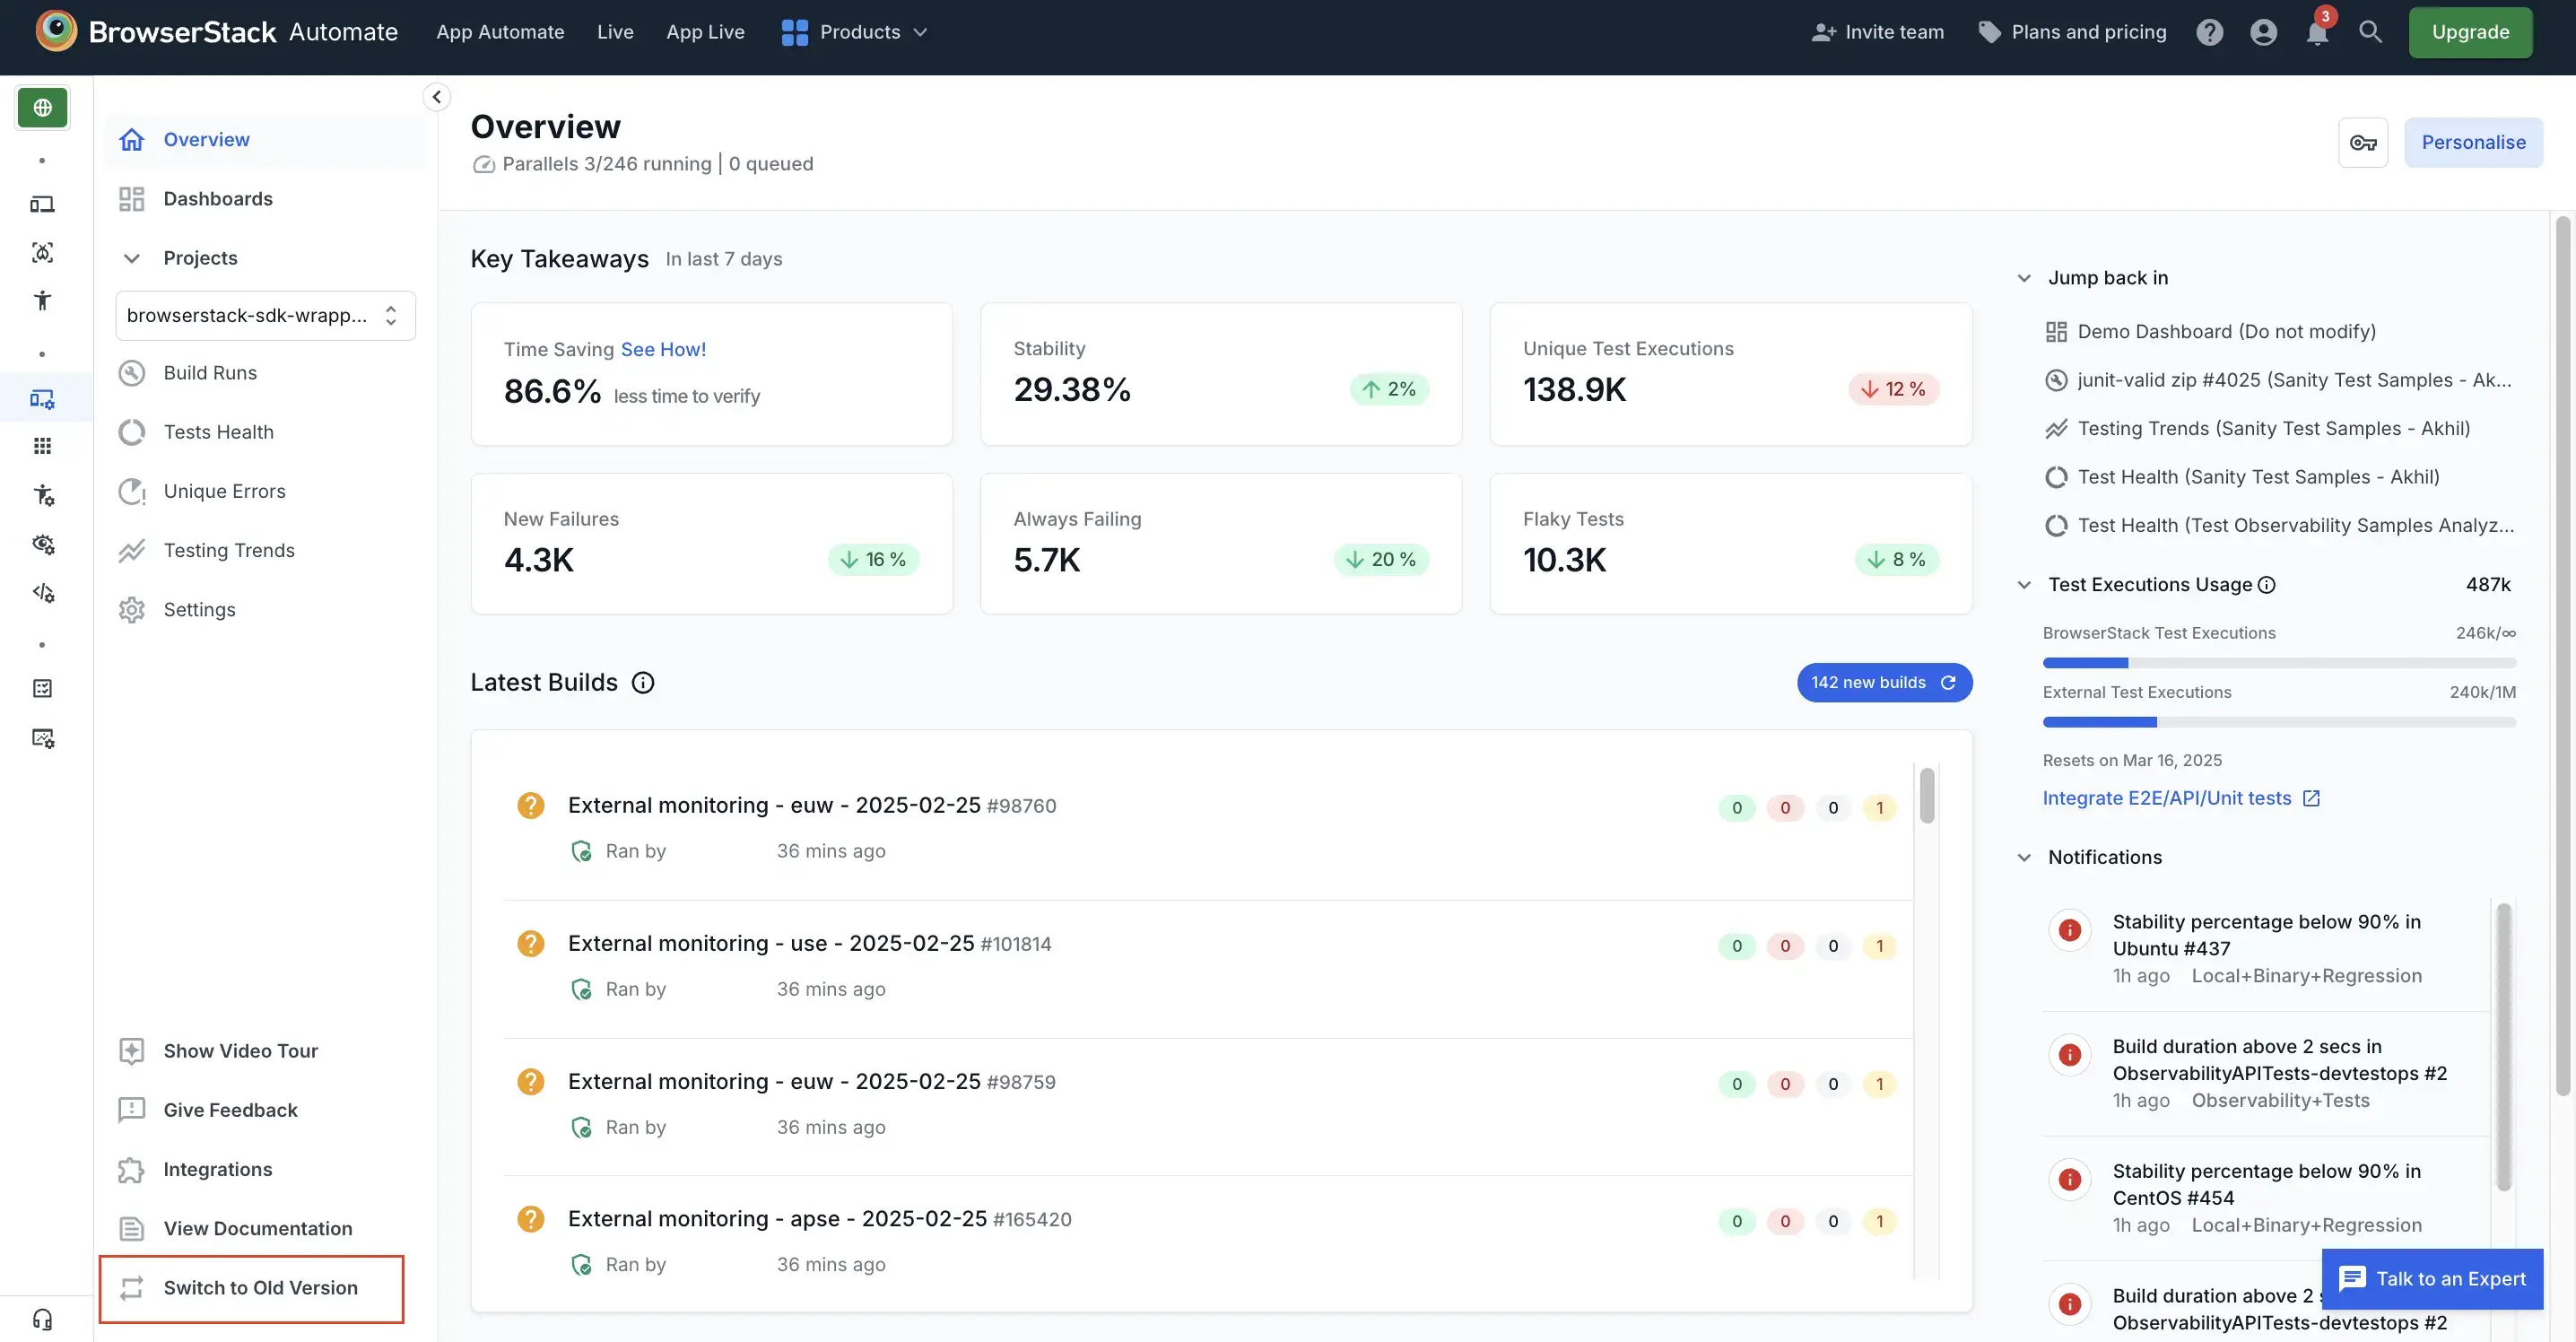
The default landing page of the new dashboard experienced is named Overview. On the Overview page, your recent builds are listed in a separate widget named Latest Builds. This widget lists your builds in the reverse-chronological order. So you can navigate to a recent build with a single click.
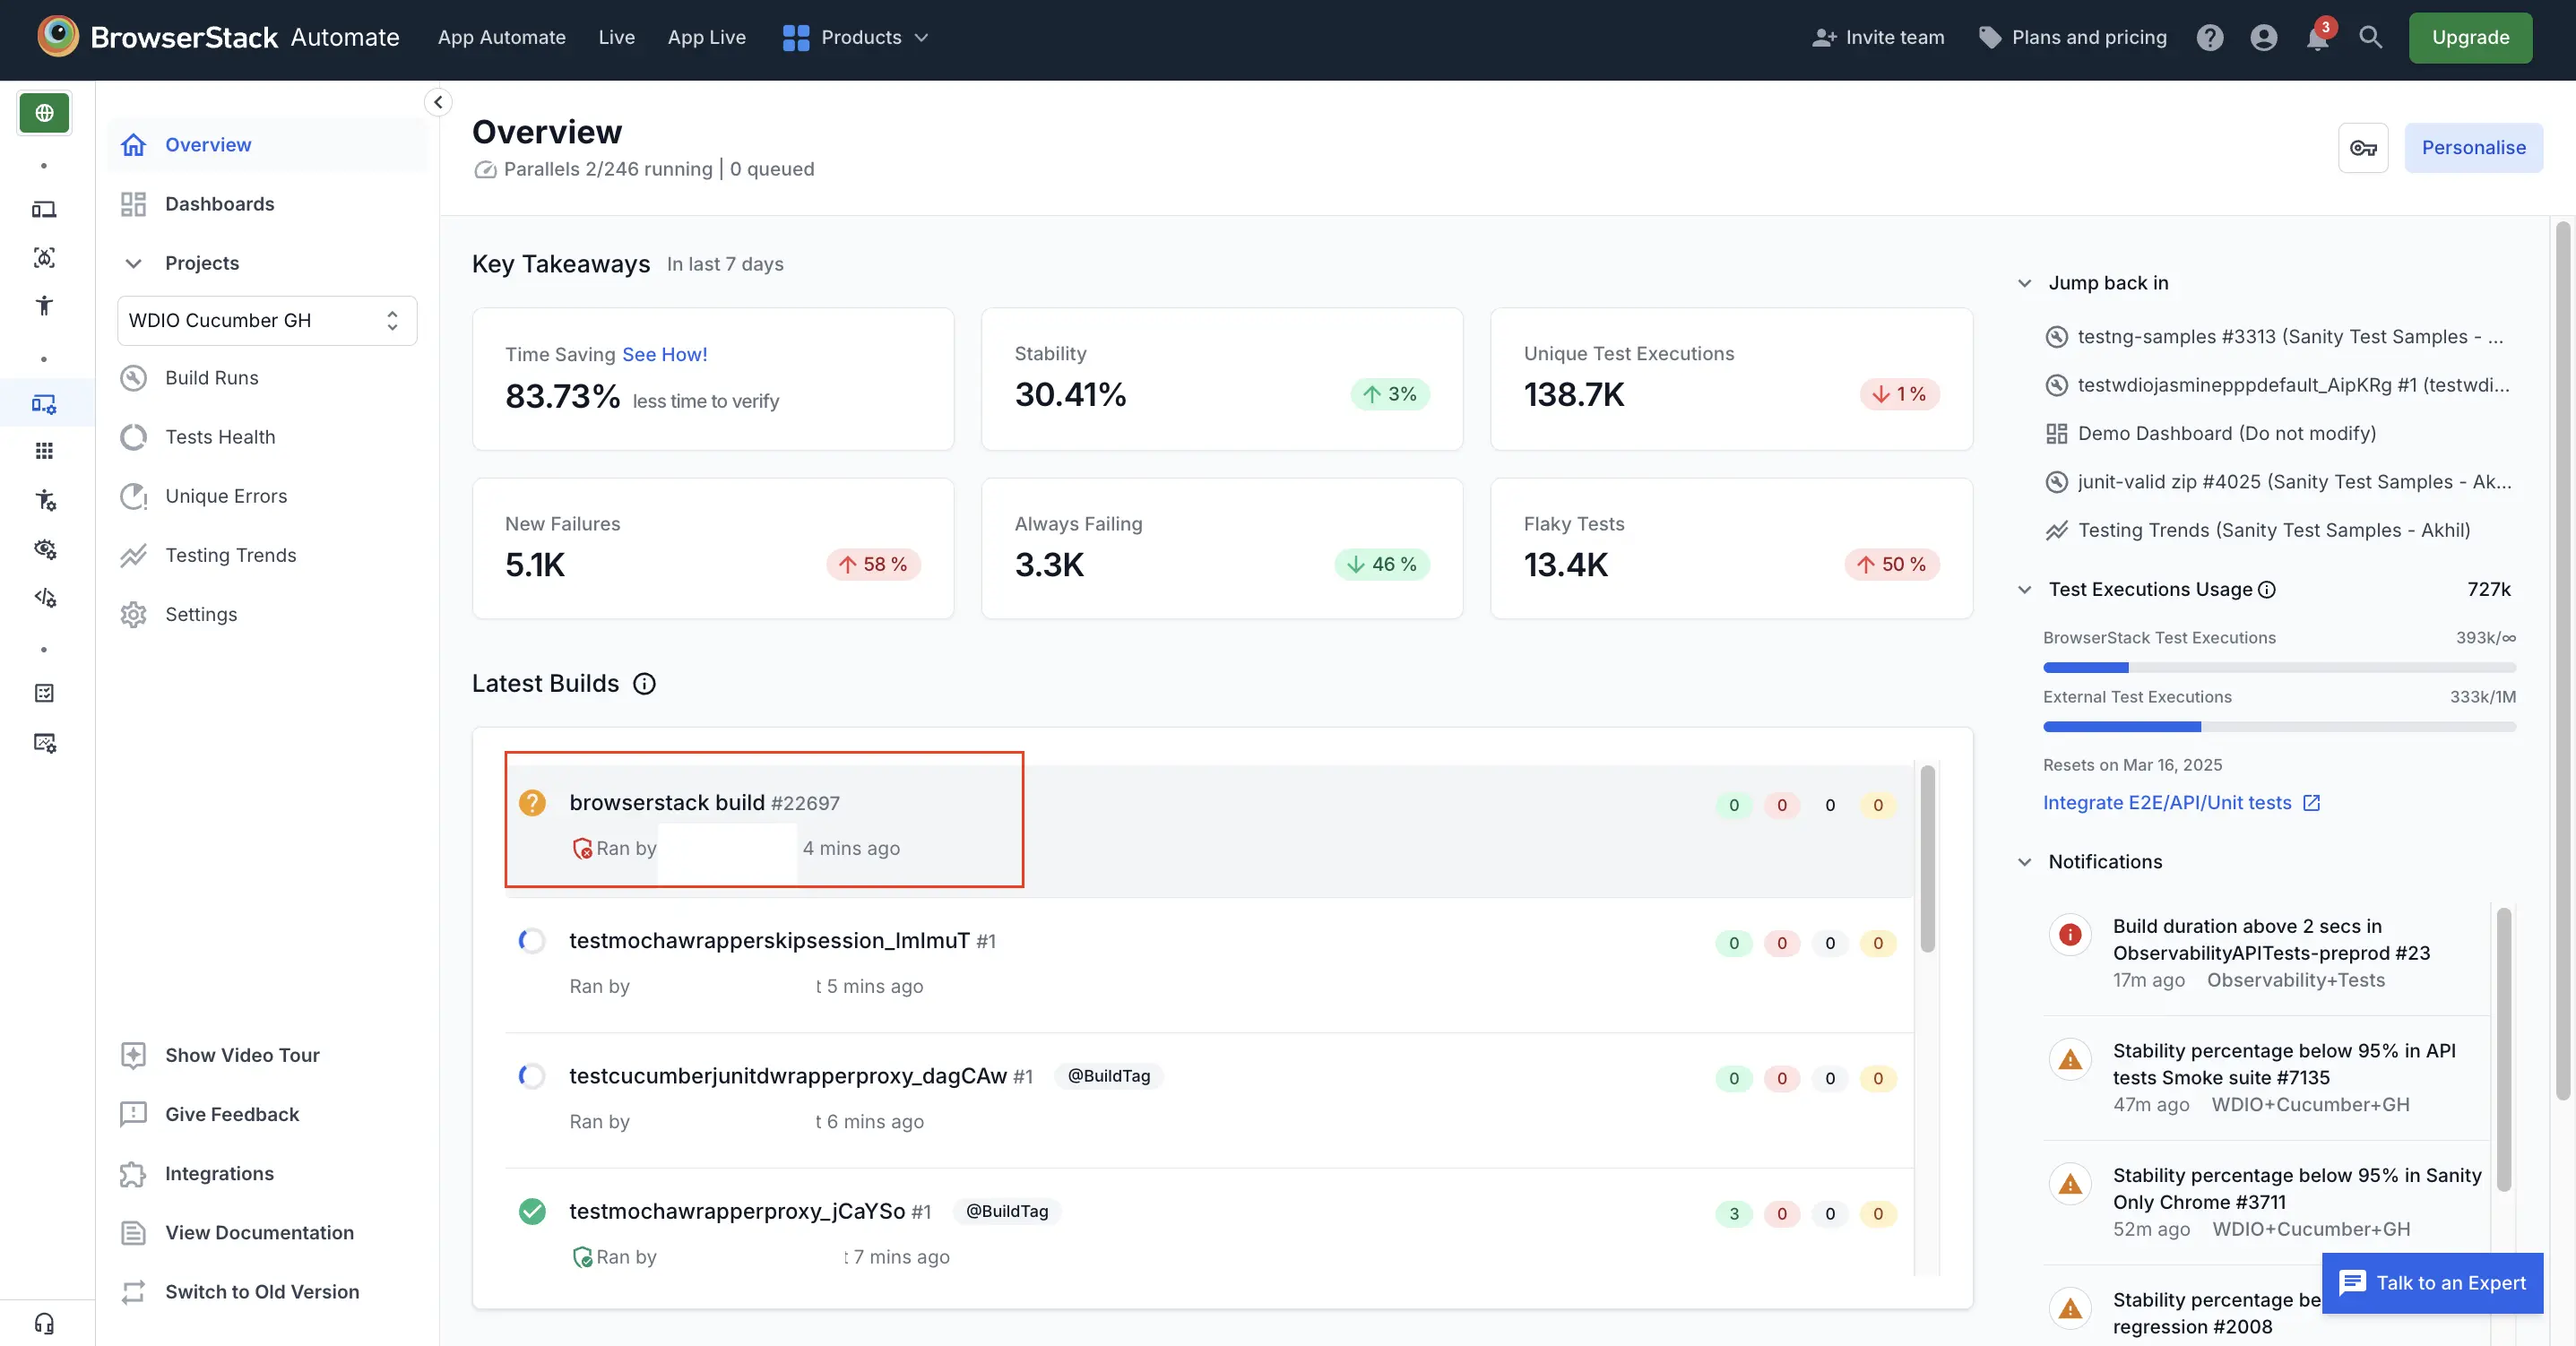
You can personalize your overview page to view only the builds you want to track.
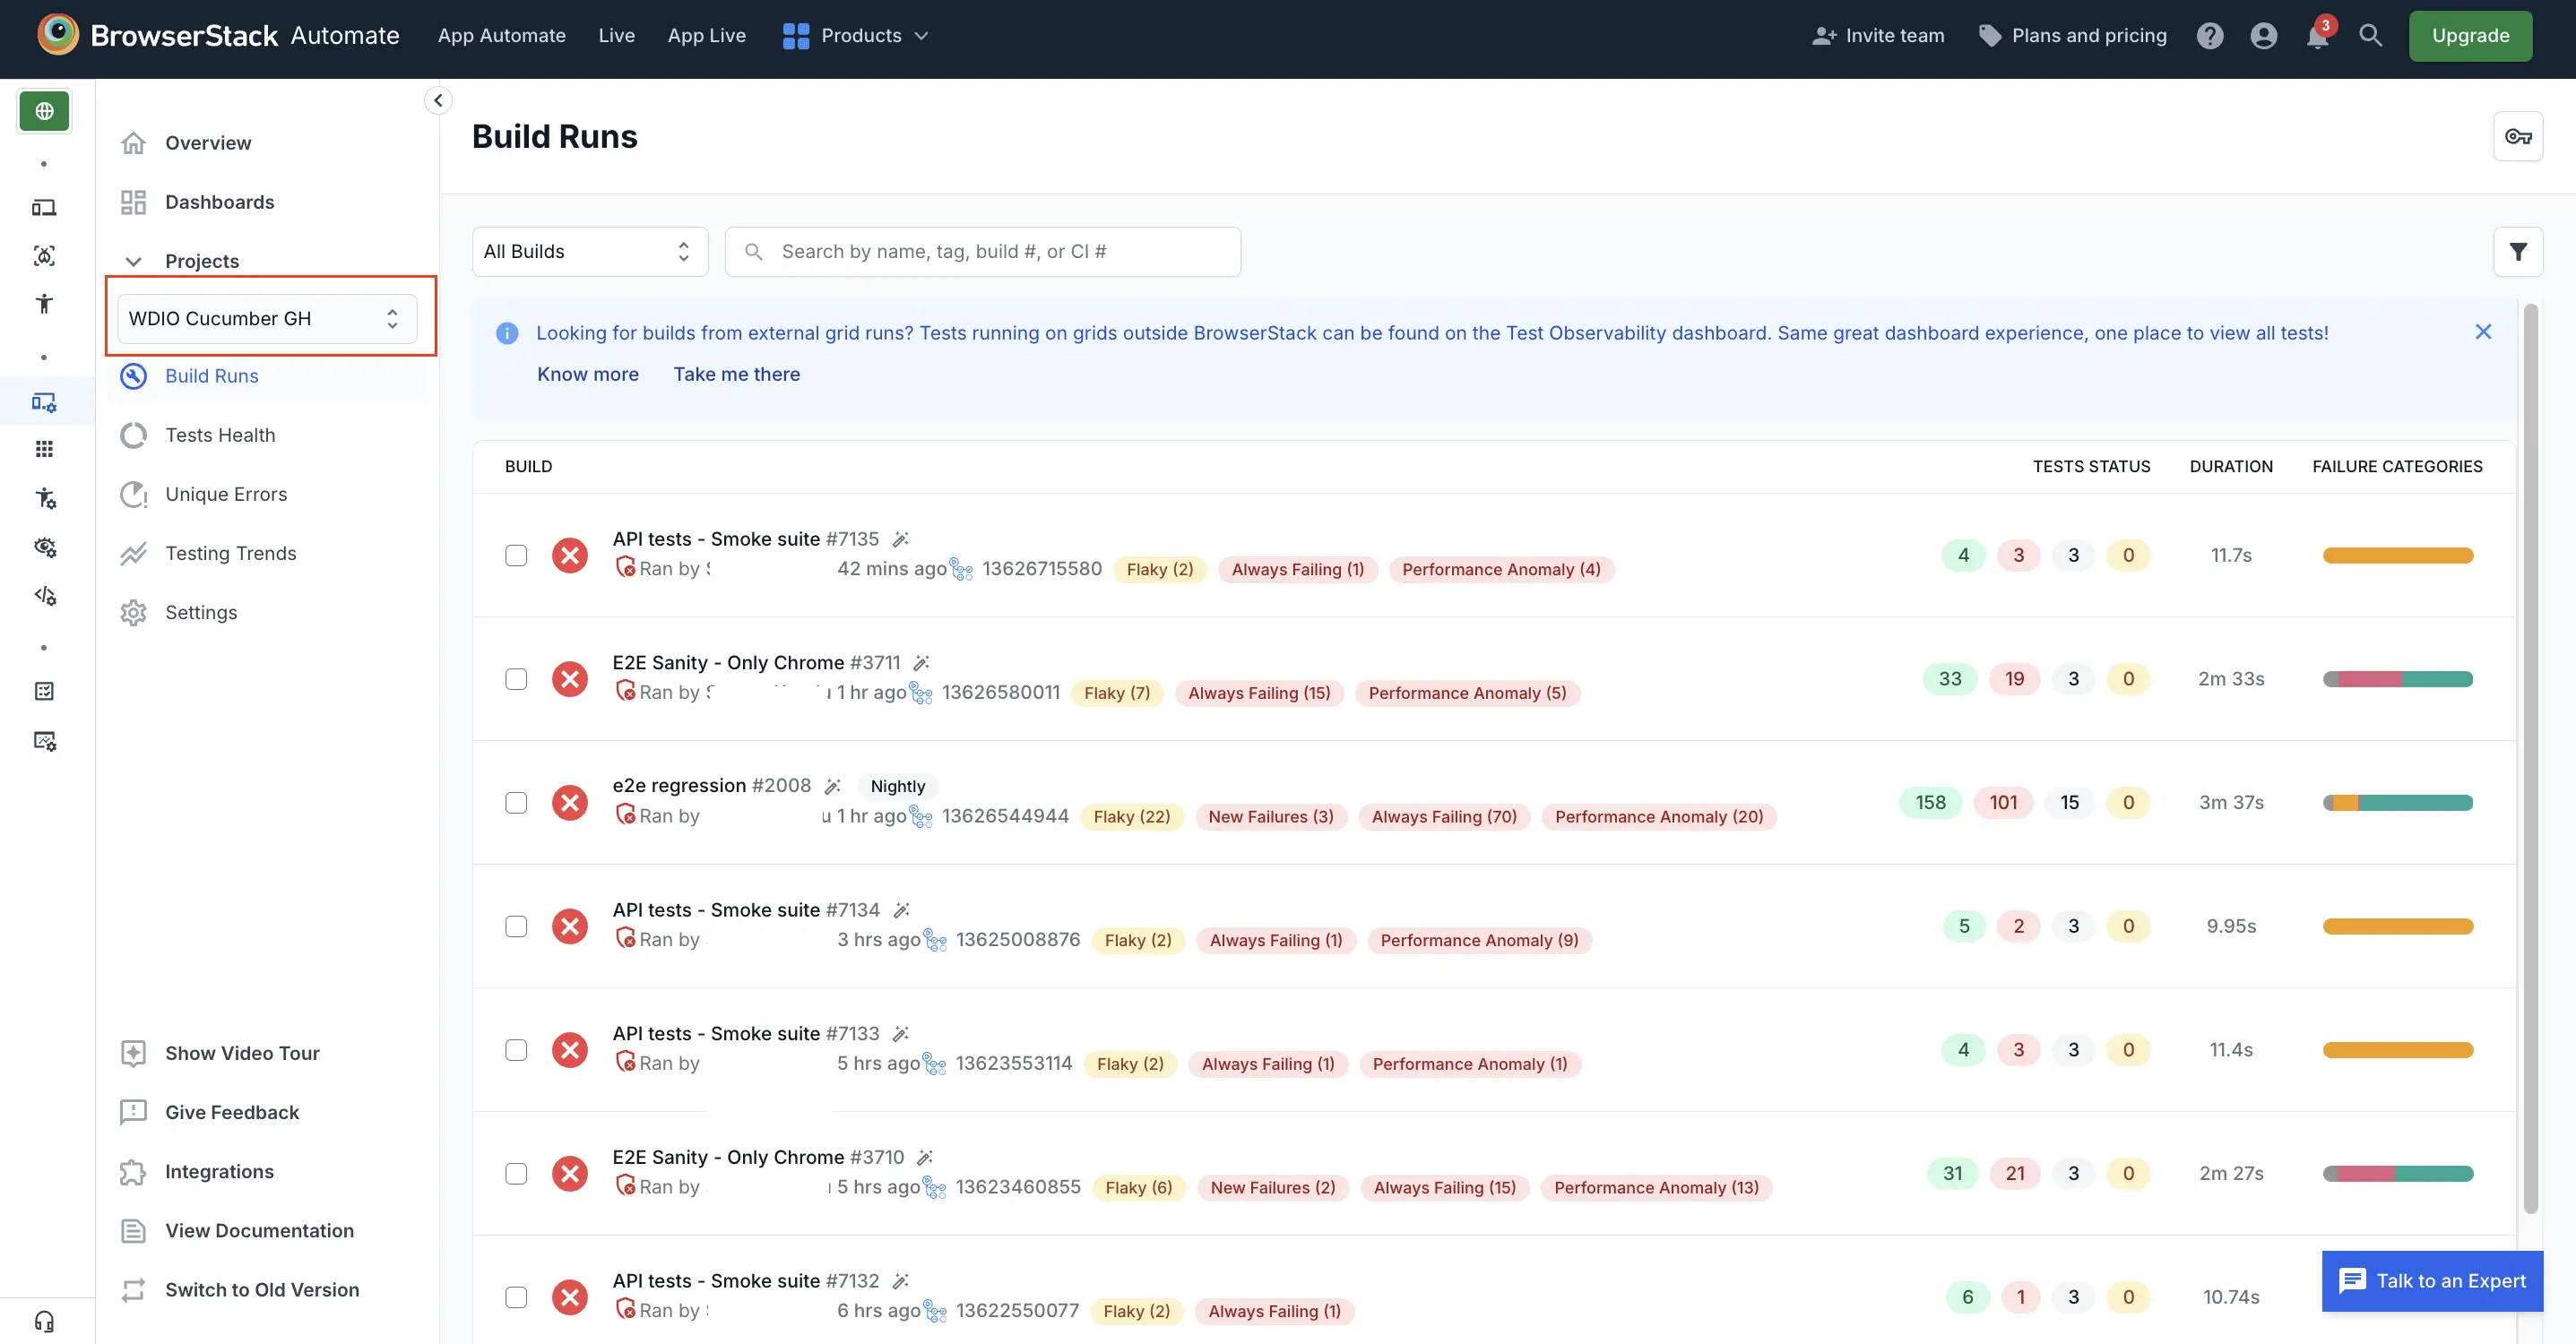
The alternate way to access builds is as follows:
- Click Build Runs on the left sidebar.
- Select your project from the menu. You will be redirected to the Build Runs page of your project. Note that this is a one-time setup. The dashboard defaults to the project name you selected, the next time you access it.
Access tests
From the Build Runs page, you can click any of the test data metrics (number of passed tests, number of failed tests, number of flaky tests, etc) to view corresponding tests.
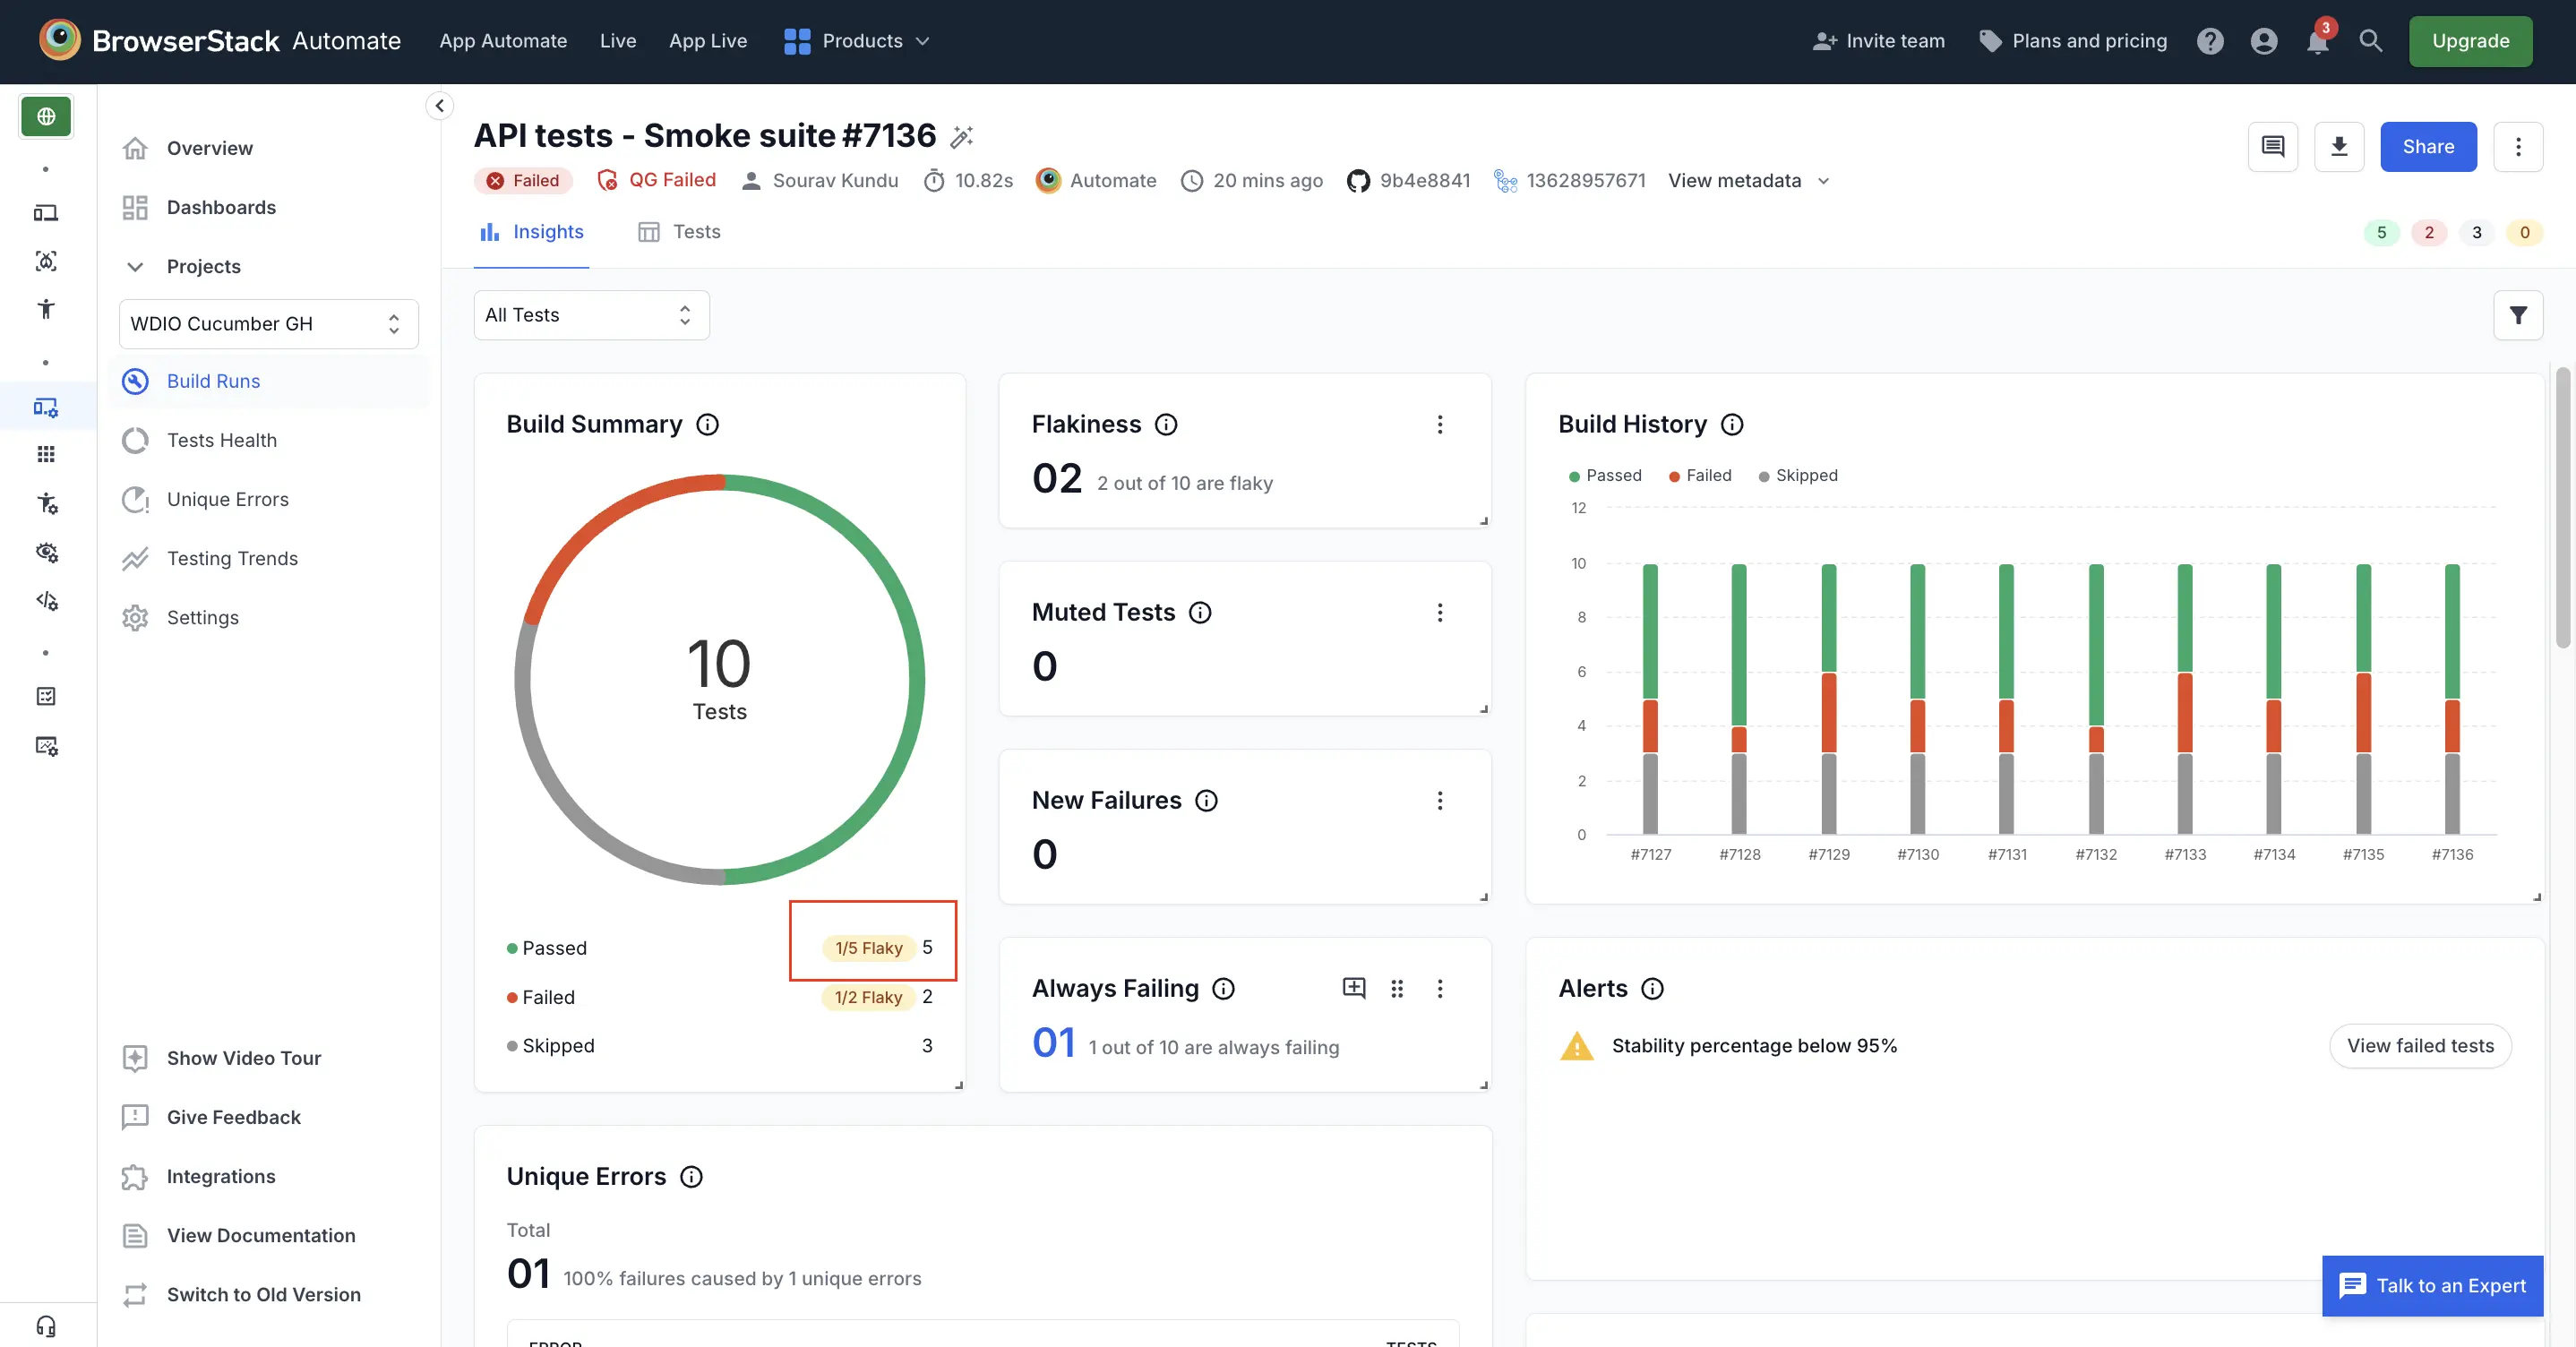
You can also view the test liosting as follows:
- Click the build you want to drill-down, as explained in the Access build runs section.
- Select the Tests tab.
Here is a sample test listing:
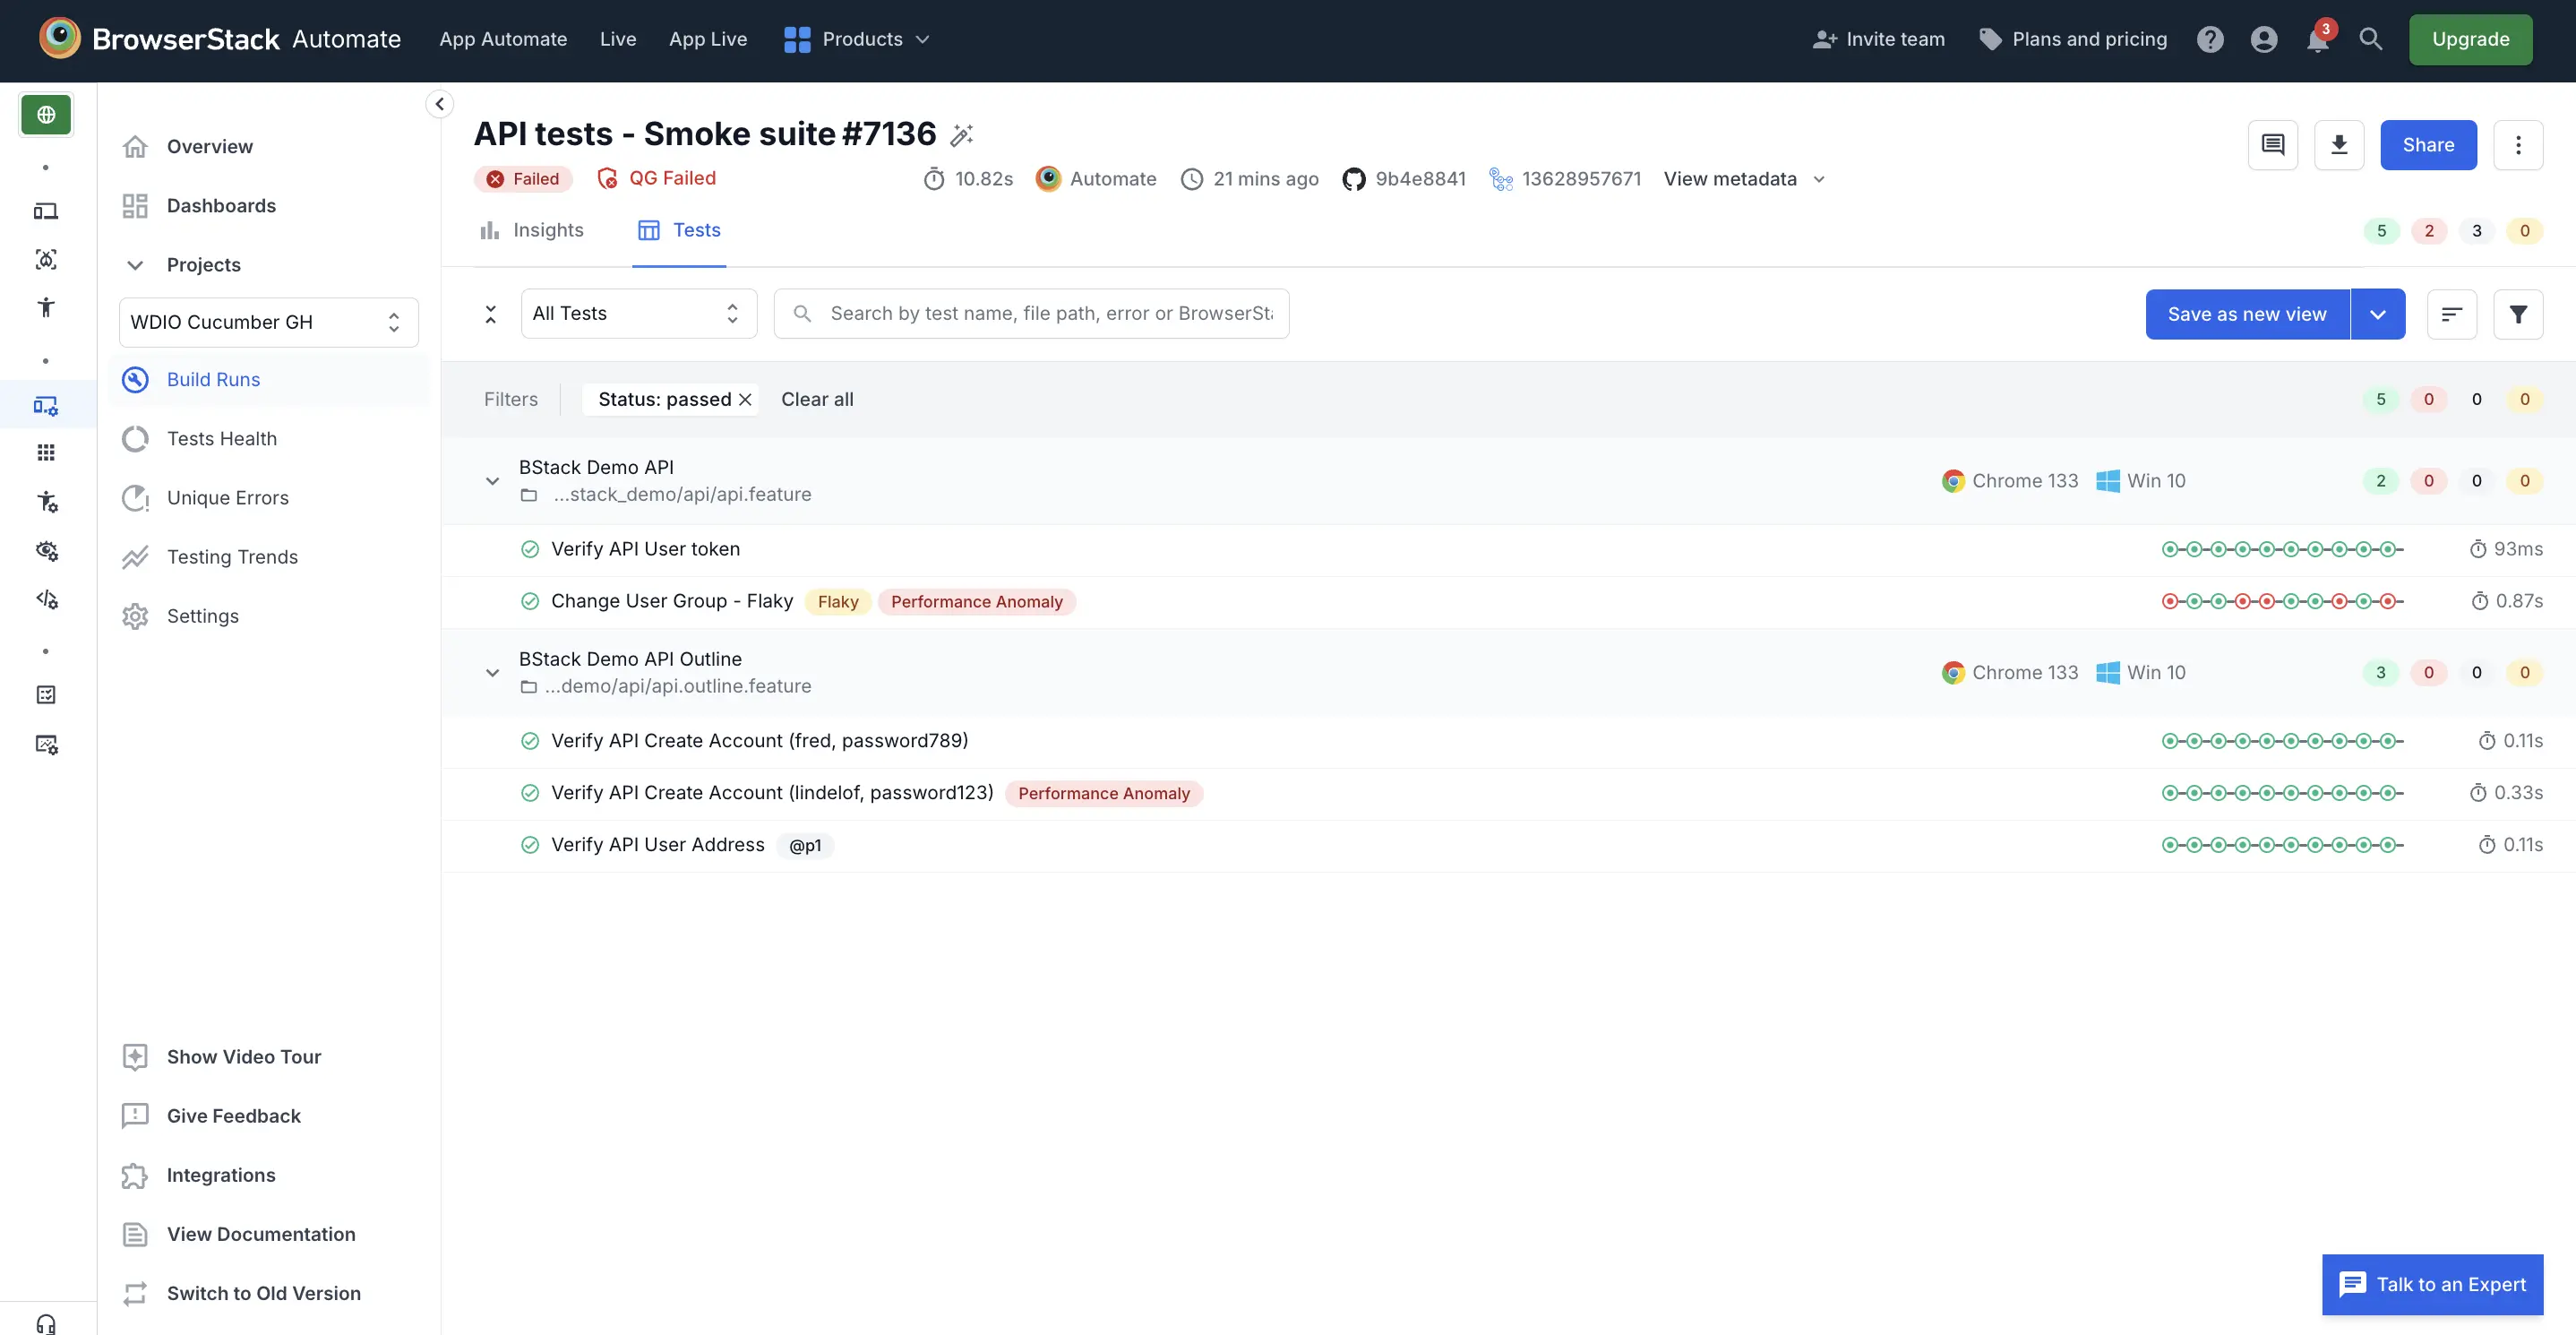
Access video recordings, inspect logs, and view sessions
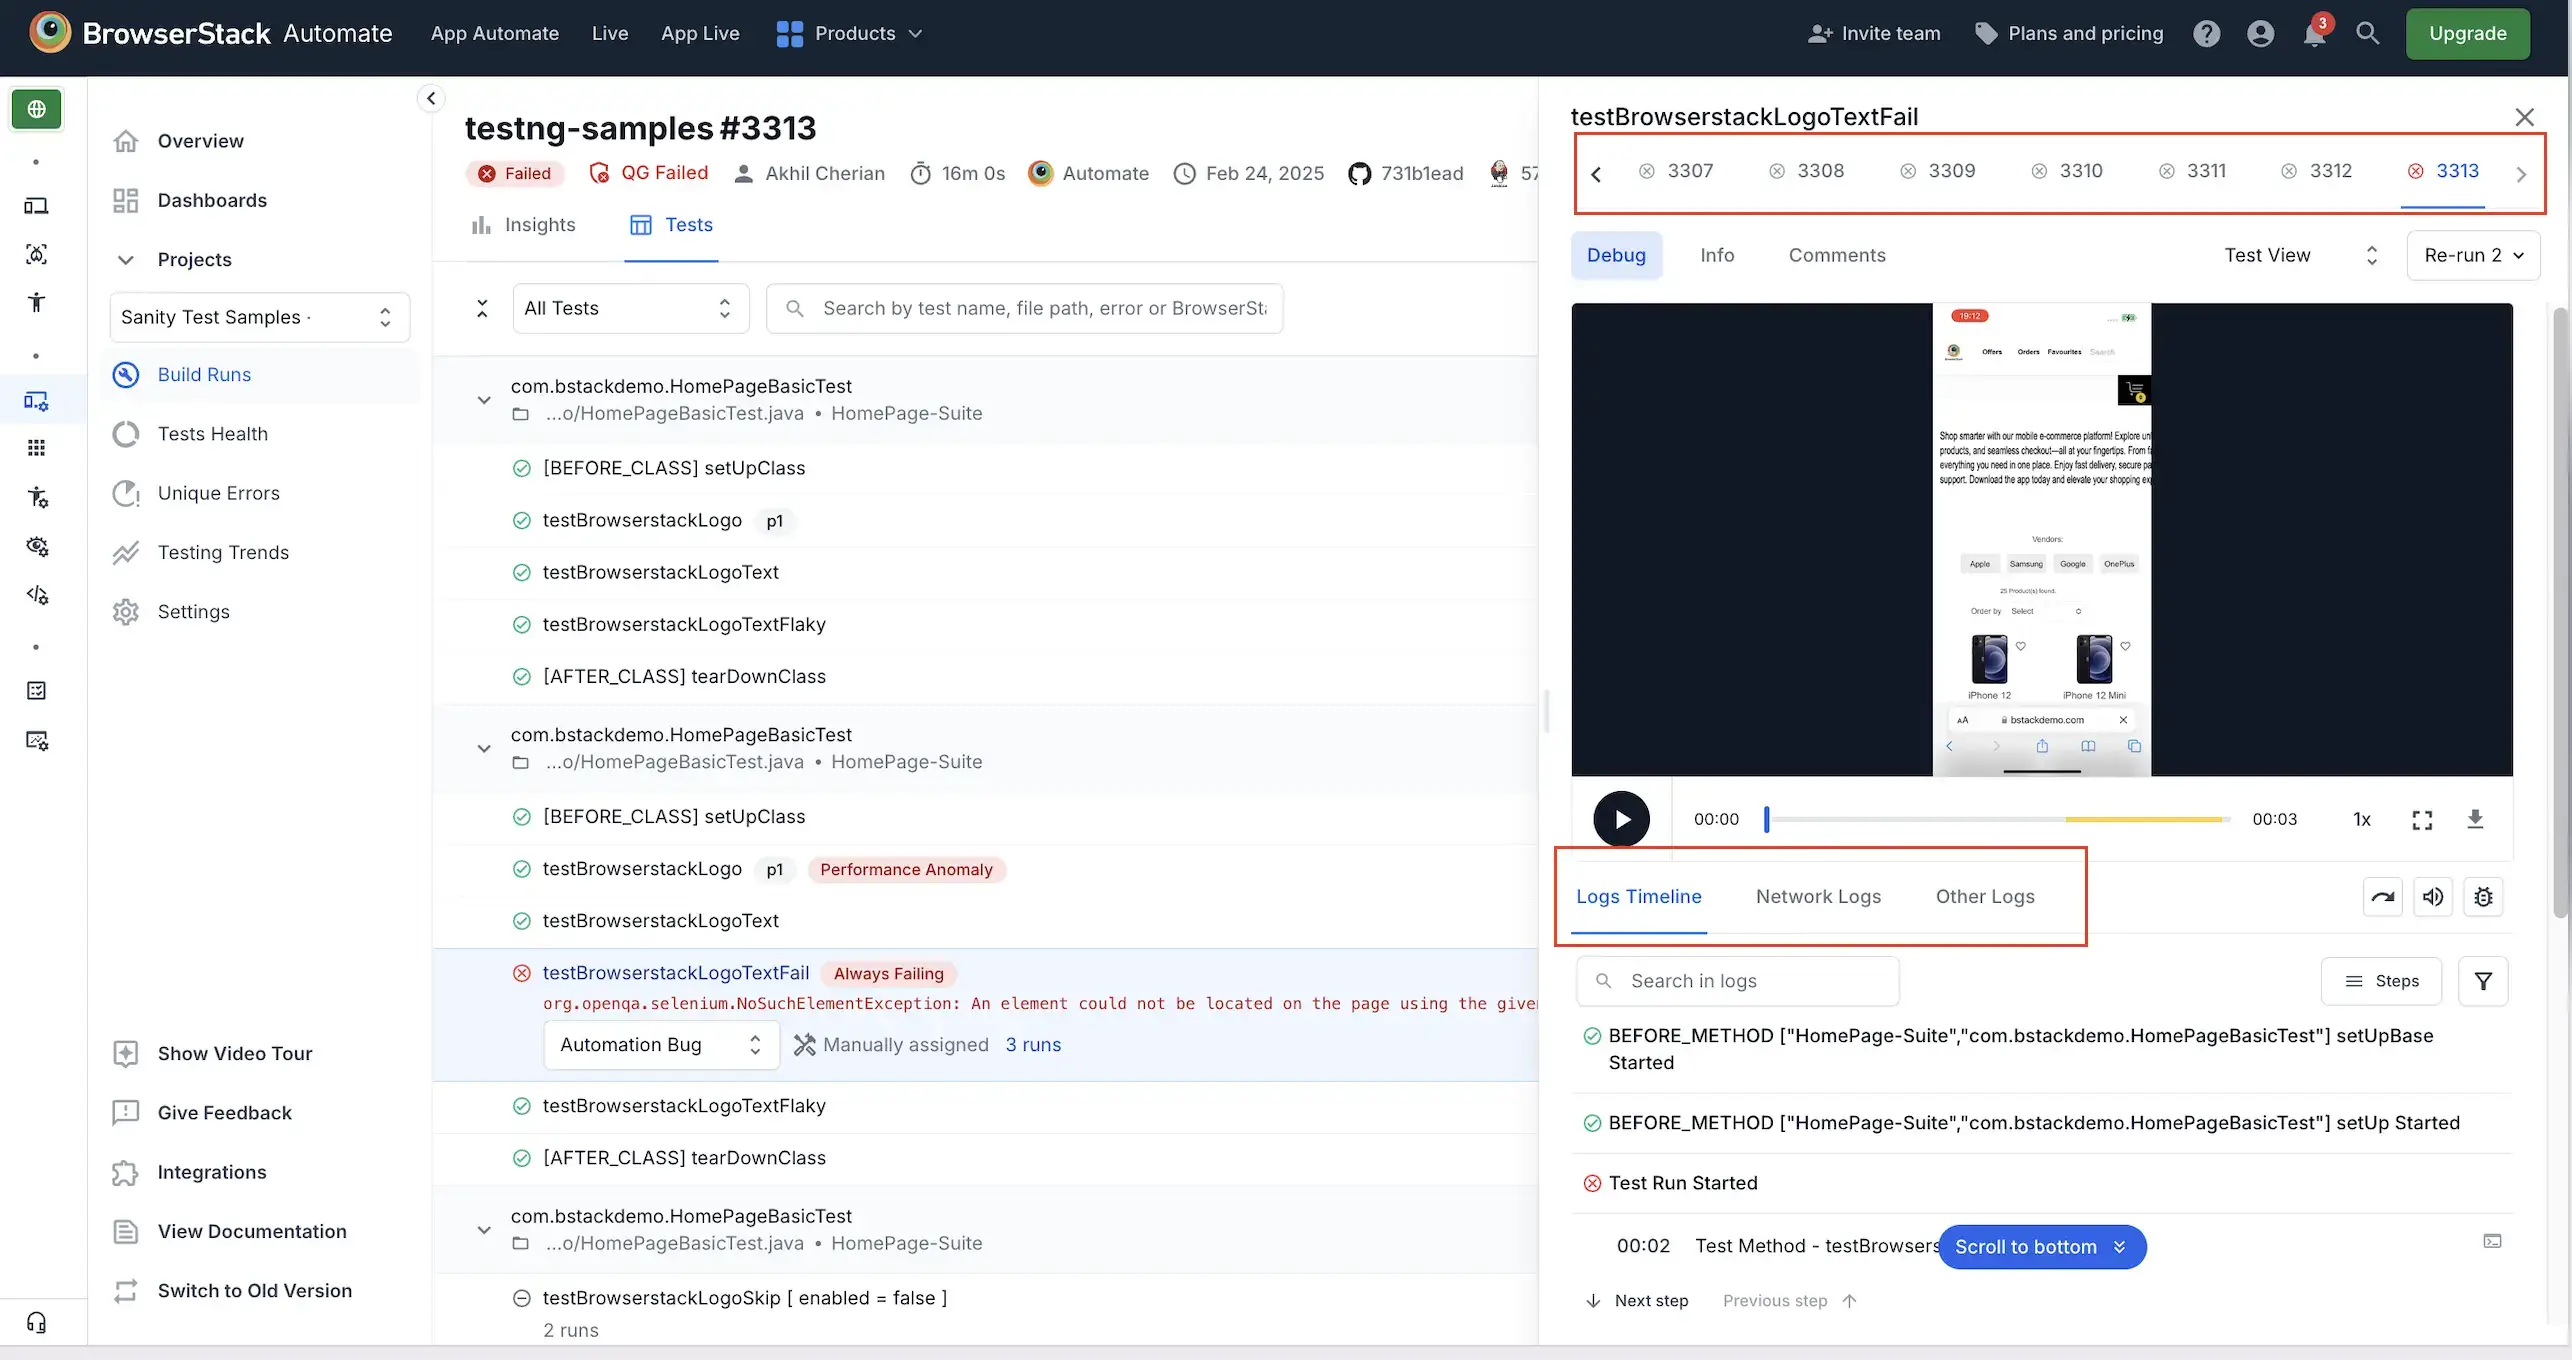
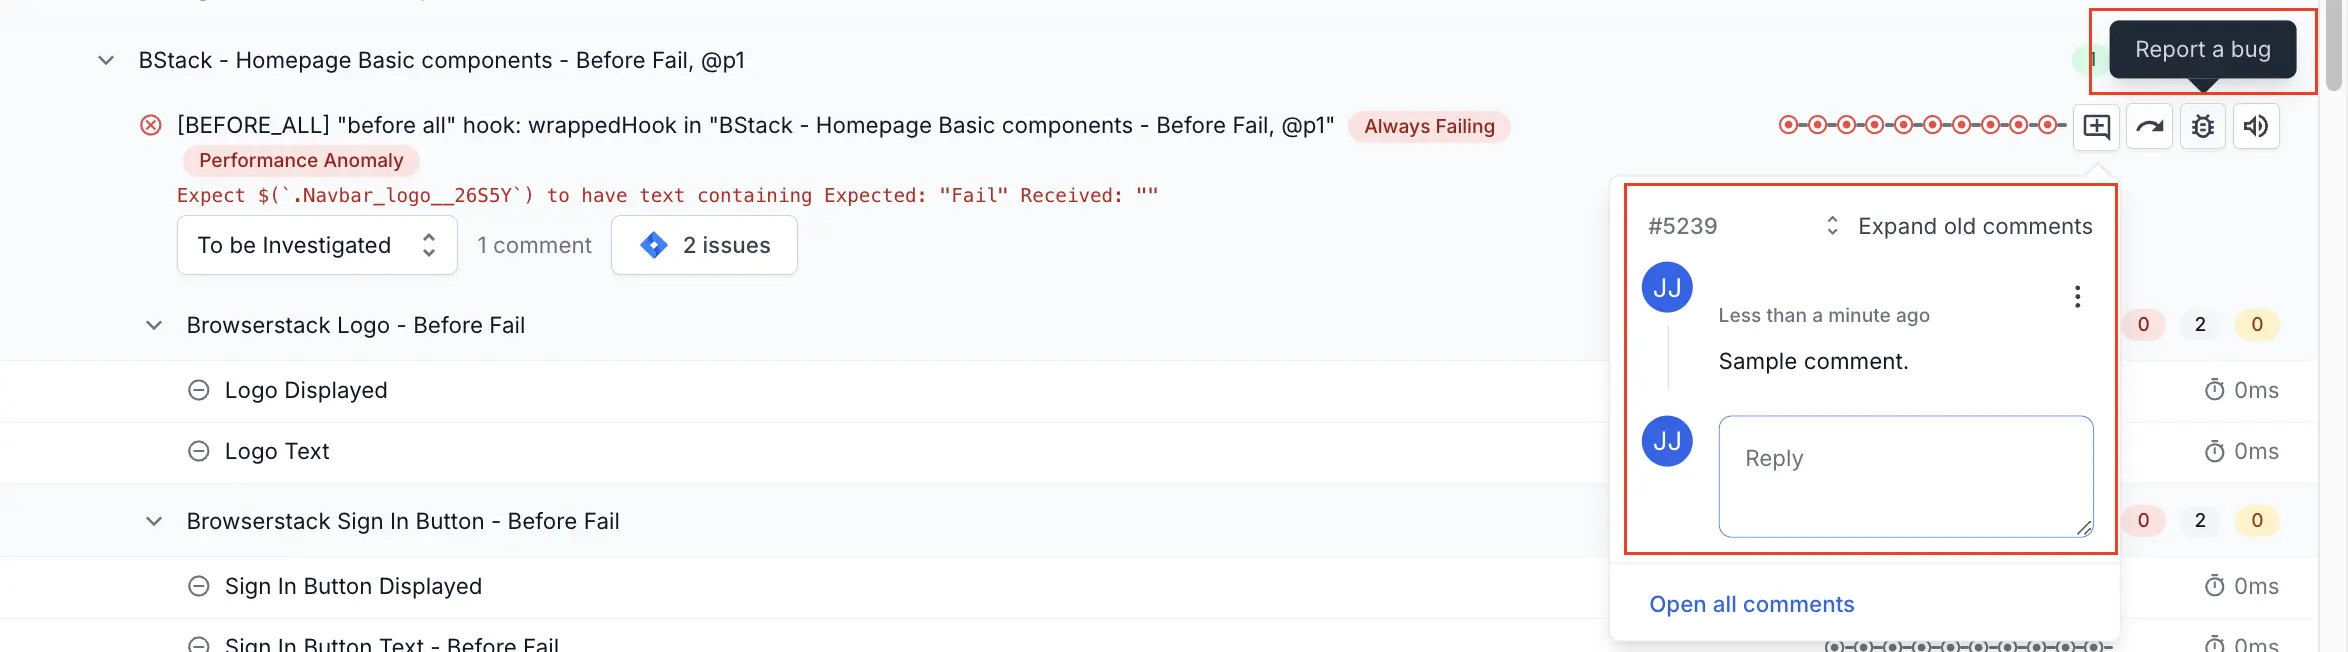
When you are accessing the test listing, you can click any test to drill-down further.
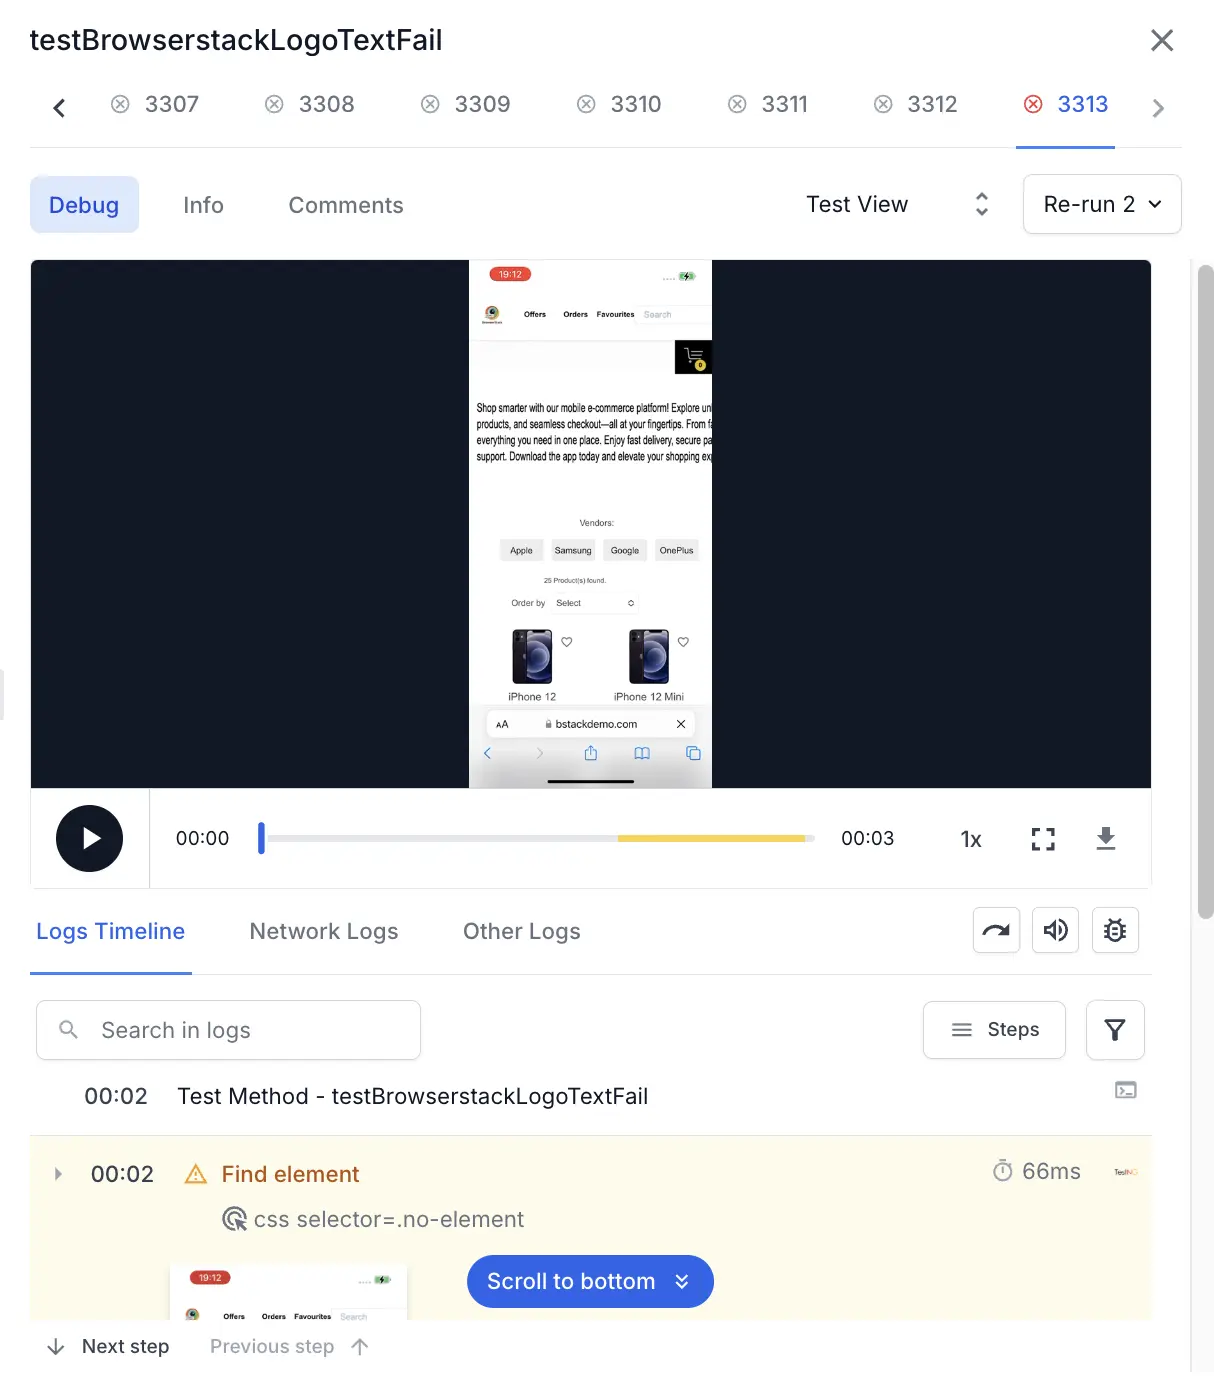
When you click a test, a Timeline Debugging view opens up on the right-hand side of your screen. Using this view, you can check current and previous failures of the same test. Video recording is also available here.
Logs are test-specific, making it easier to debug failures. Logs are classified into network logs and console logs.
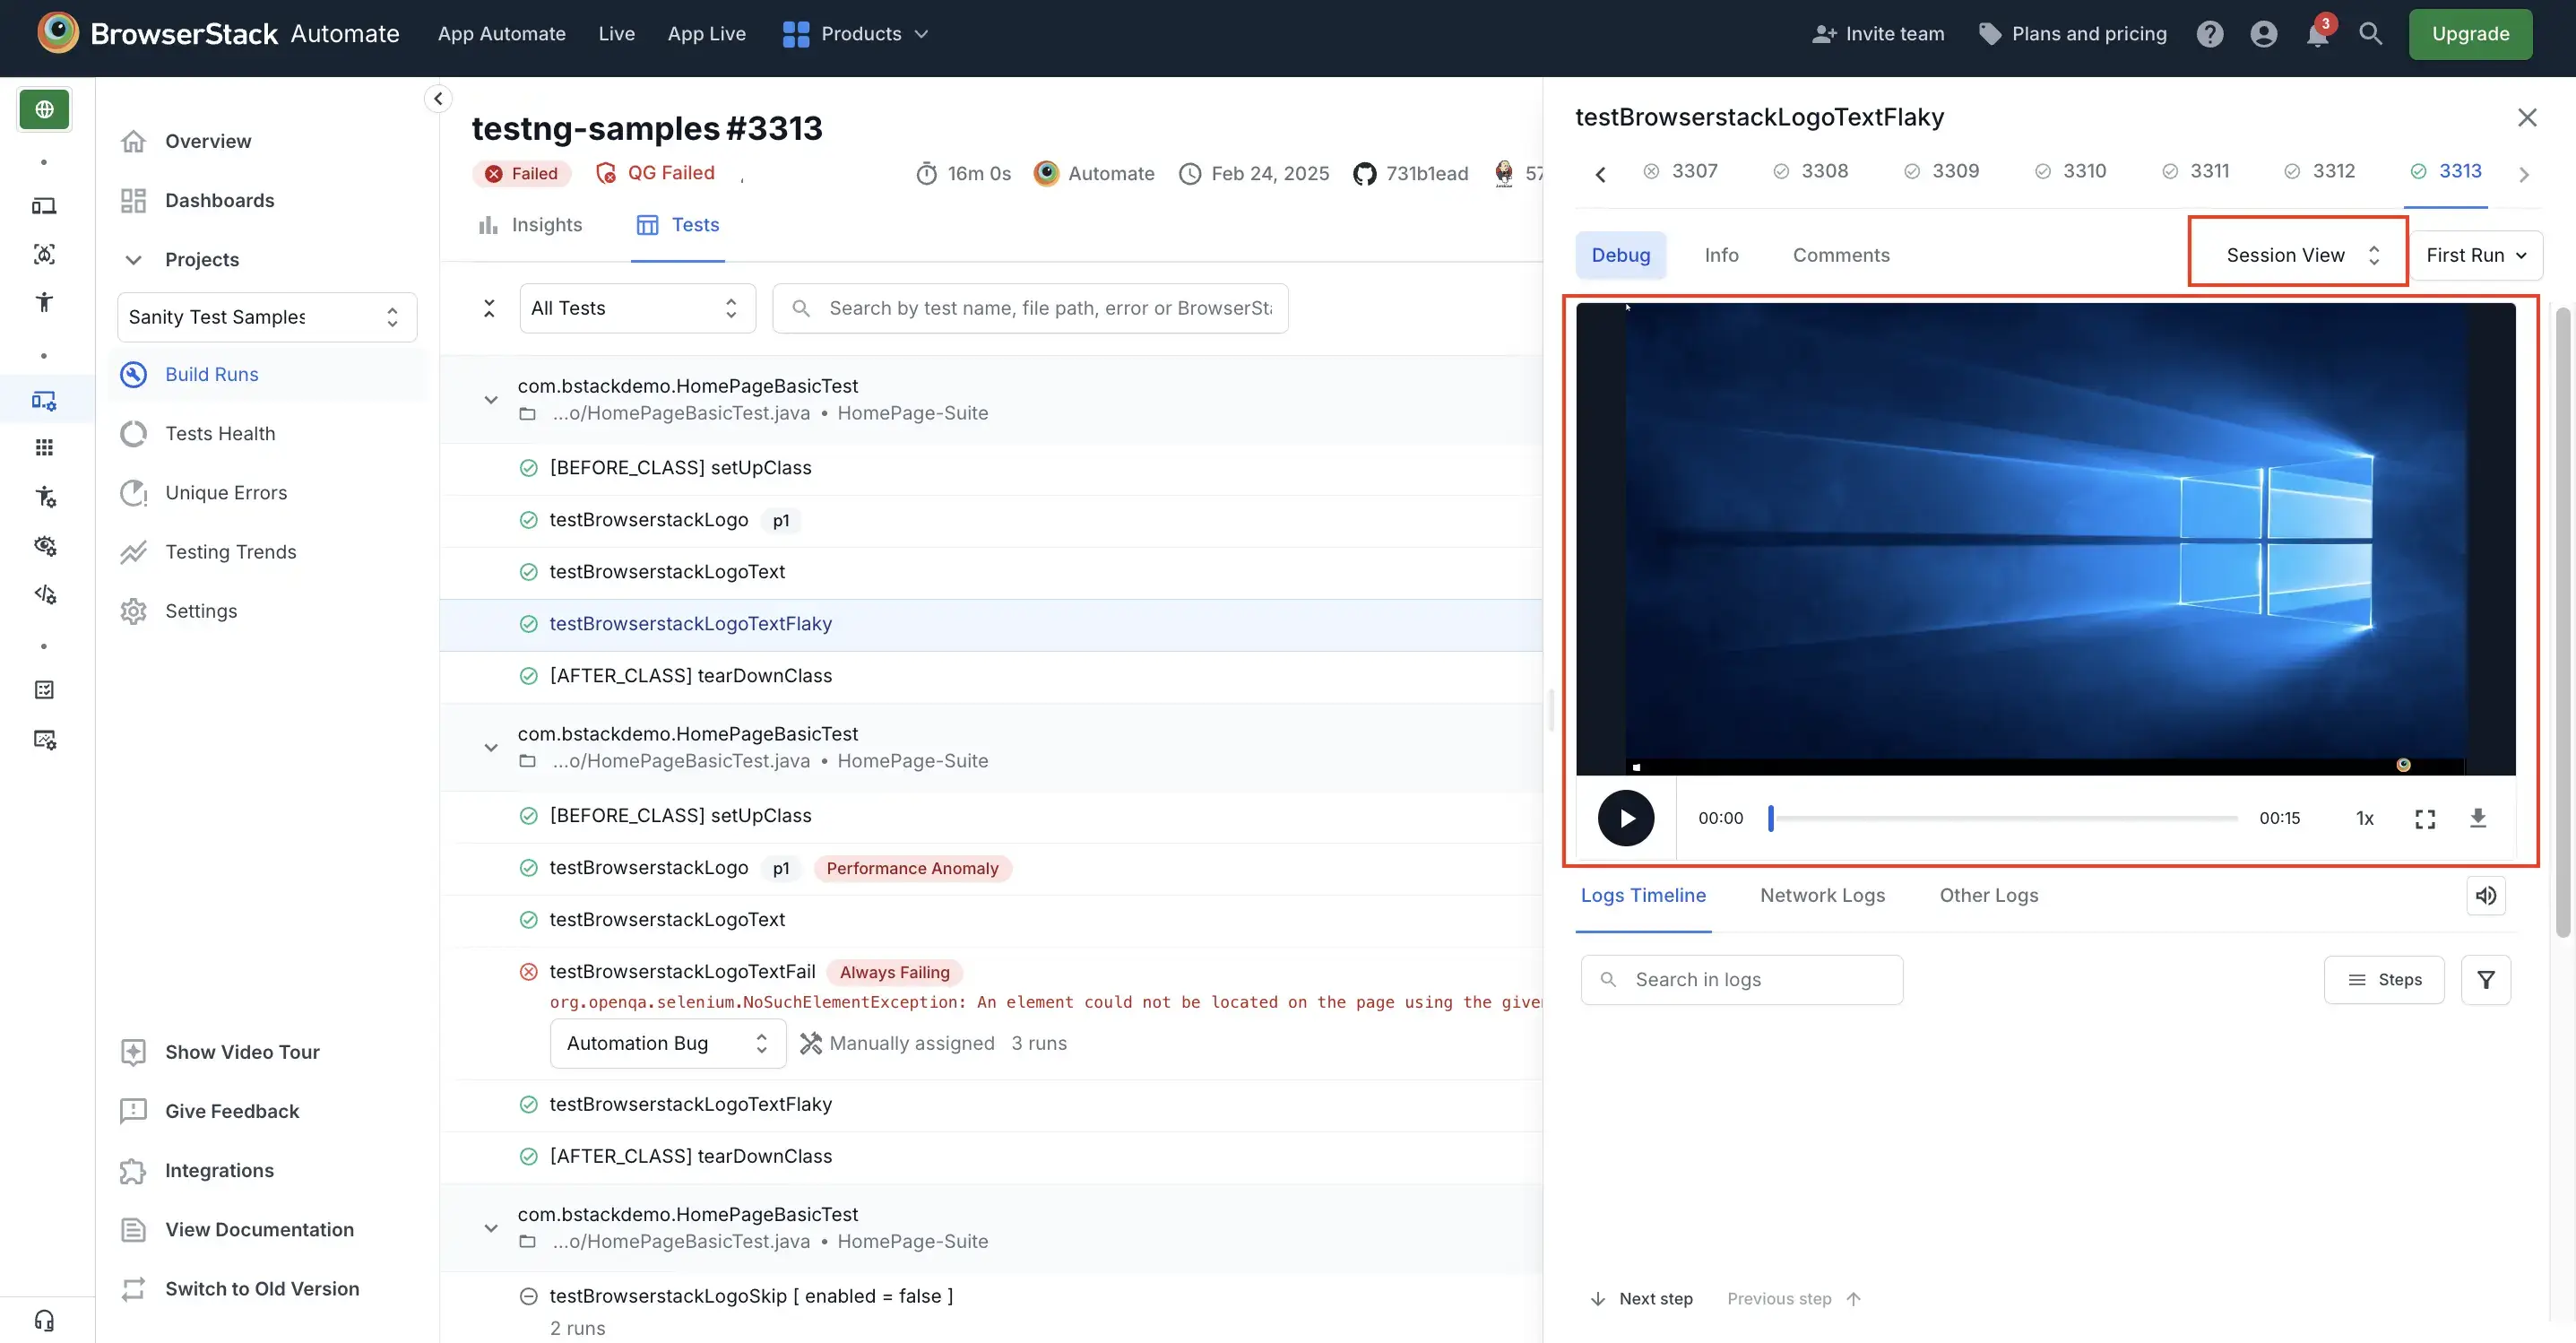
You can still access individual sessions by selecting the Session view on an individual test.
Manage your projects
The new dashboard organizes information hierarchically by projects, builds, and tests. This structure makes it easier to navigate and analyze test results.
The new dashboard automatically detects multiple runs of the same build and maintains a build run number. This was not possible in the old dashboard. The old dashboard used to group build runs entirely depending on the build names. It was upto the users to ensure that the build names are unique by appending a build identifier. In the new dashboard, you don’t need to add a build identifier. The grouping happens automatically.
In the new dashboard, build names are automatically recognized and grouped, eliminating the need for manual build identifiers.
For further information on managing your projects, you can refer to the Managing your projects page.
How to pass build names and project names
- Project Names: Project names are now a key part of the hierarchy. We recommend sending project names to organize your tests effectively.
- Build Names: Give unique build names for your builds. For this, you no longer need to pass build identifiers manually. Each individual build run will be automatically sequenced and grouped under the same build in the new dashboard.
Whenever you invoke a CI job, the build name should remain the same. You should pass a static build name for this.
Follow the guidelines in this doc to configure build names correctly.
Exciting features of the new dashboard
The new dashboard introduces several advanced features to enhance your testing experience.
To get the most out of the new dashboard, we recommend integrating the BrowserStack SDK into your test framework. The SDK automatically sends detailed test information, including project names, build names, and failure reasons, to the dashboard. This integration takes less than 5 minutes.
Following are some of the exciting new feautres:
-
Smart Tags: Automatically identifies flaky tests, new failures, performance anomalies, always failing, and other patterns based on the test history. These customizable Smart Tags help you focus on genuine test failures that need your attention.

-
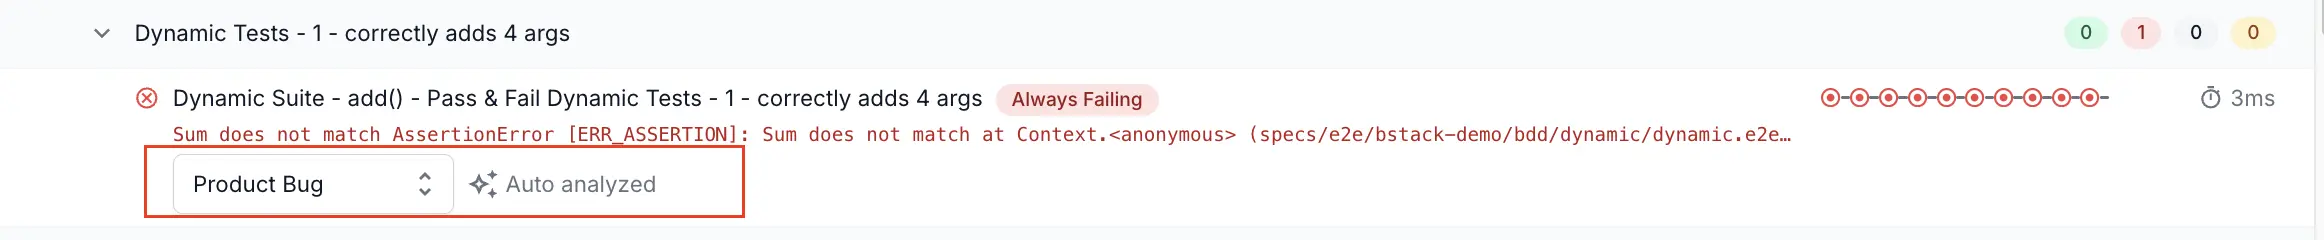
AI-based Failure Analysis: Uses AI to provide insights into the root cause of failures, such as environment issue, product bug, or automation bug. Automatic Failure Analysis helps you priotitize test failures and improve the efficiency of your QA team.
-
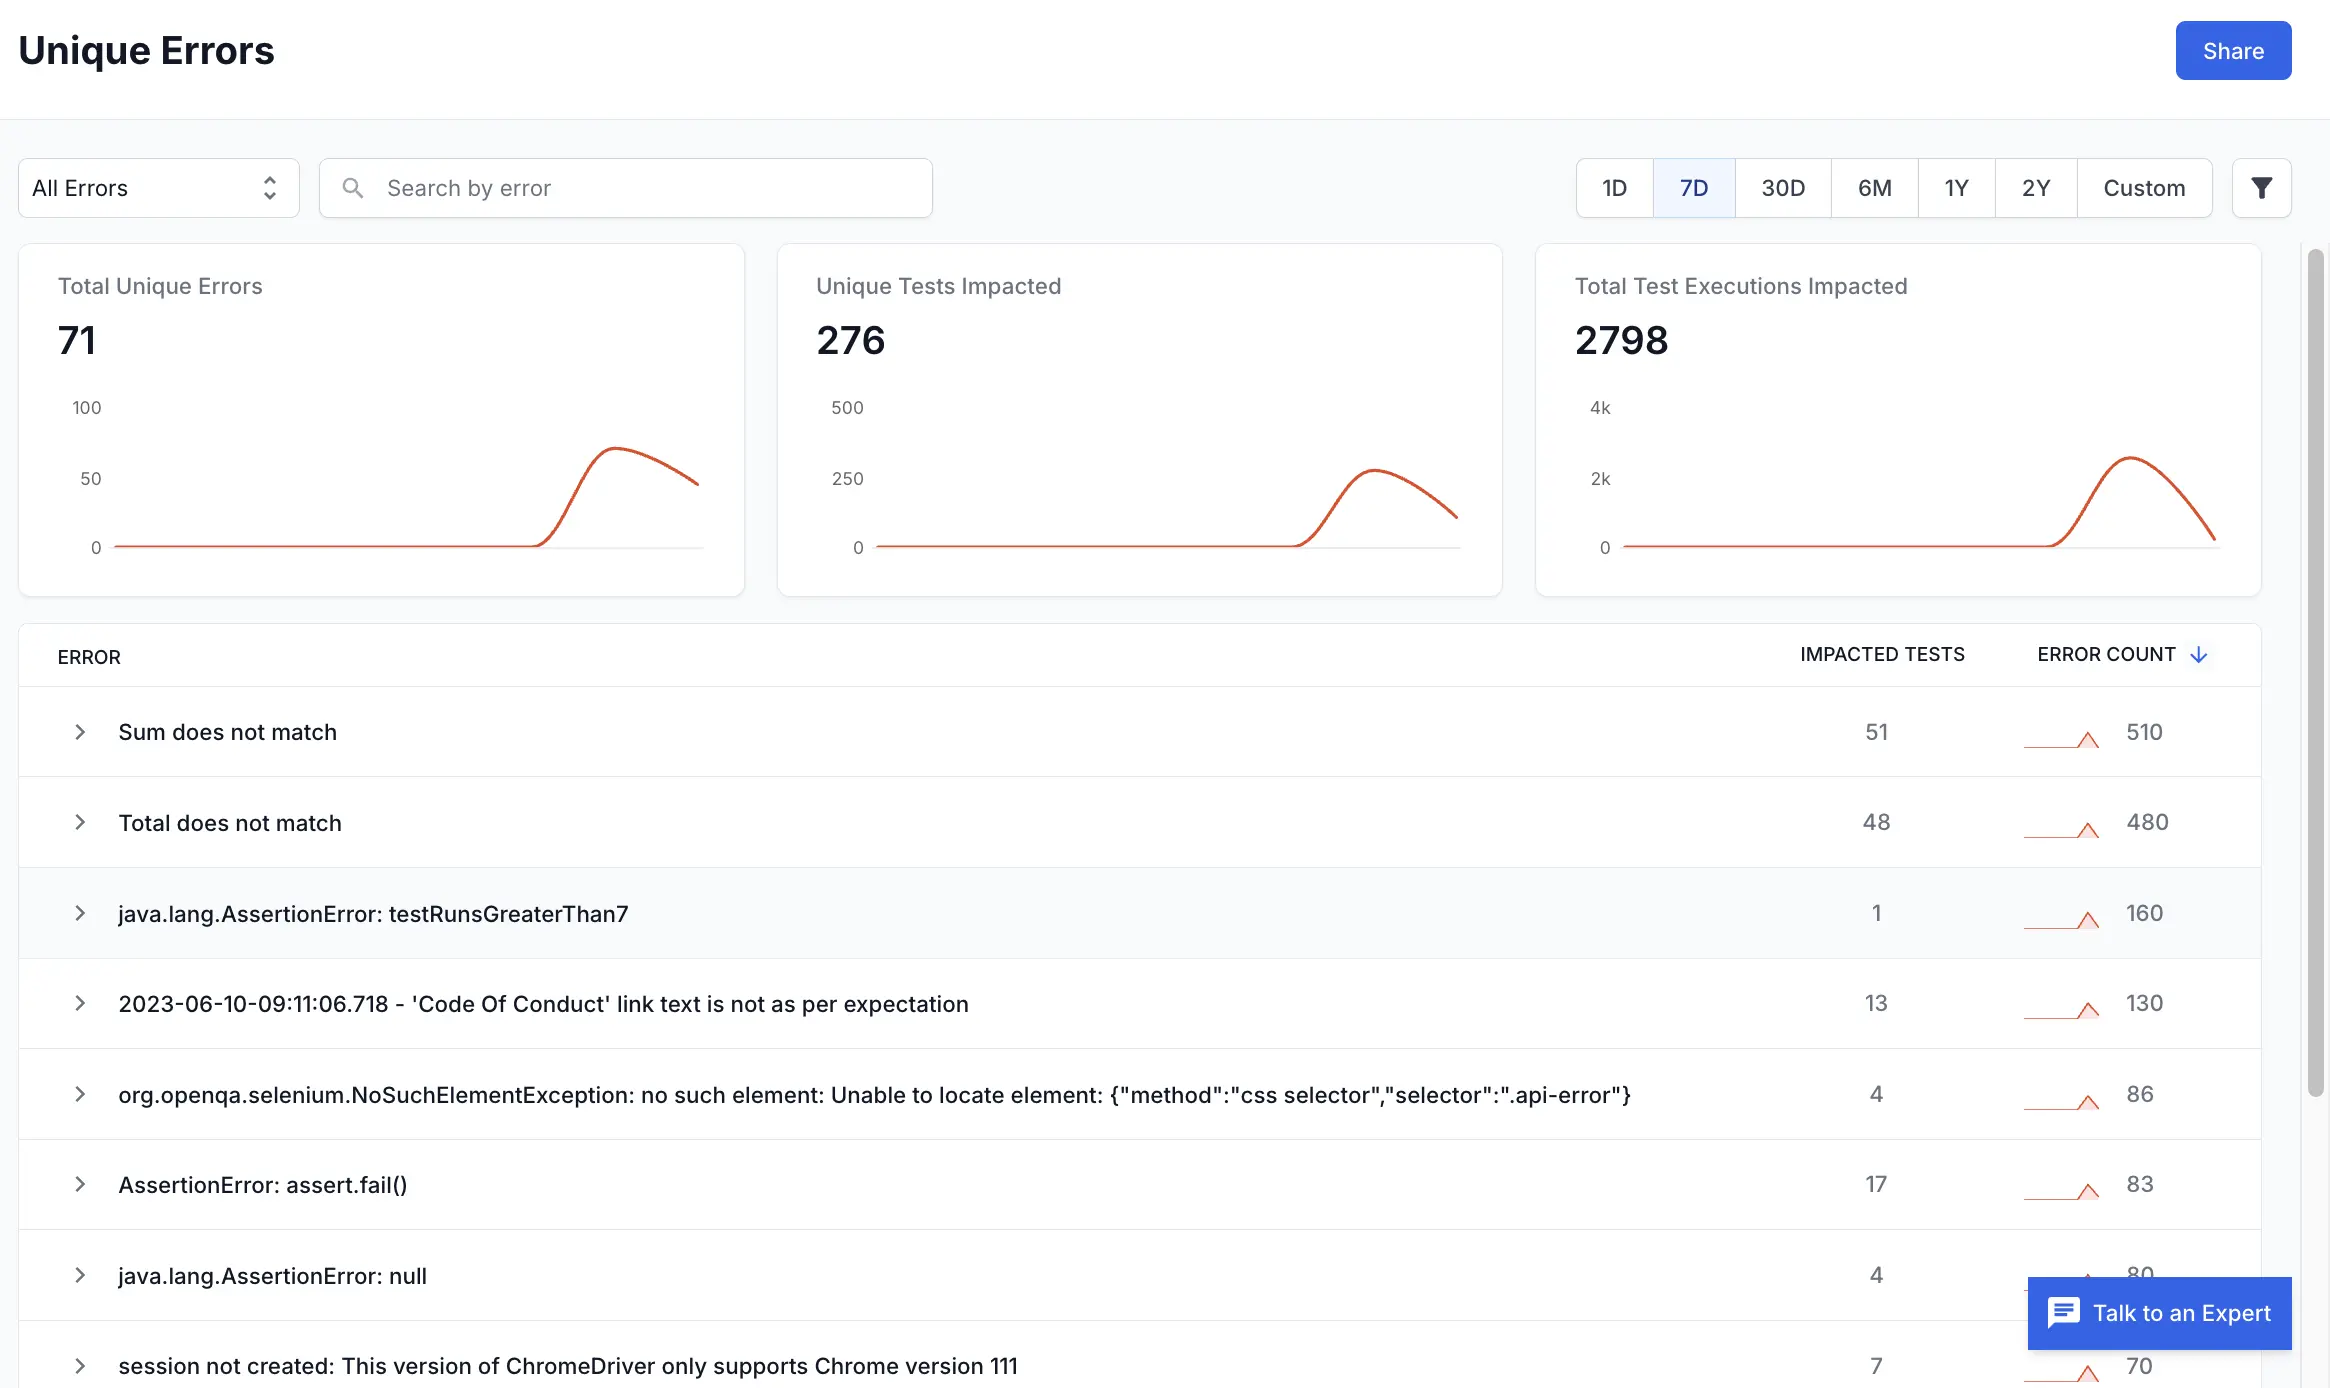
Unique Error Grouping: Groups similar errors together, reducing the time needed to debug multiple failures. When you know the unique errors that cause the maximum number of failures and how to fix them, you can apply the same fix at all places and improve your test suite.
-
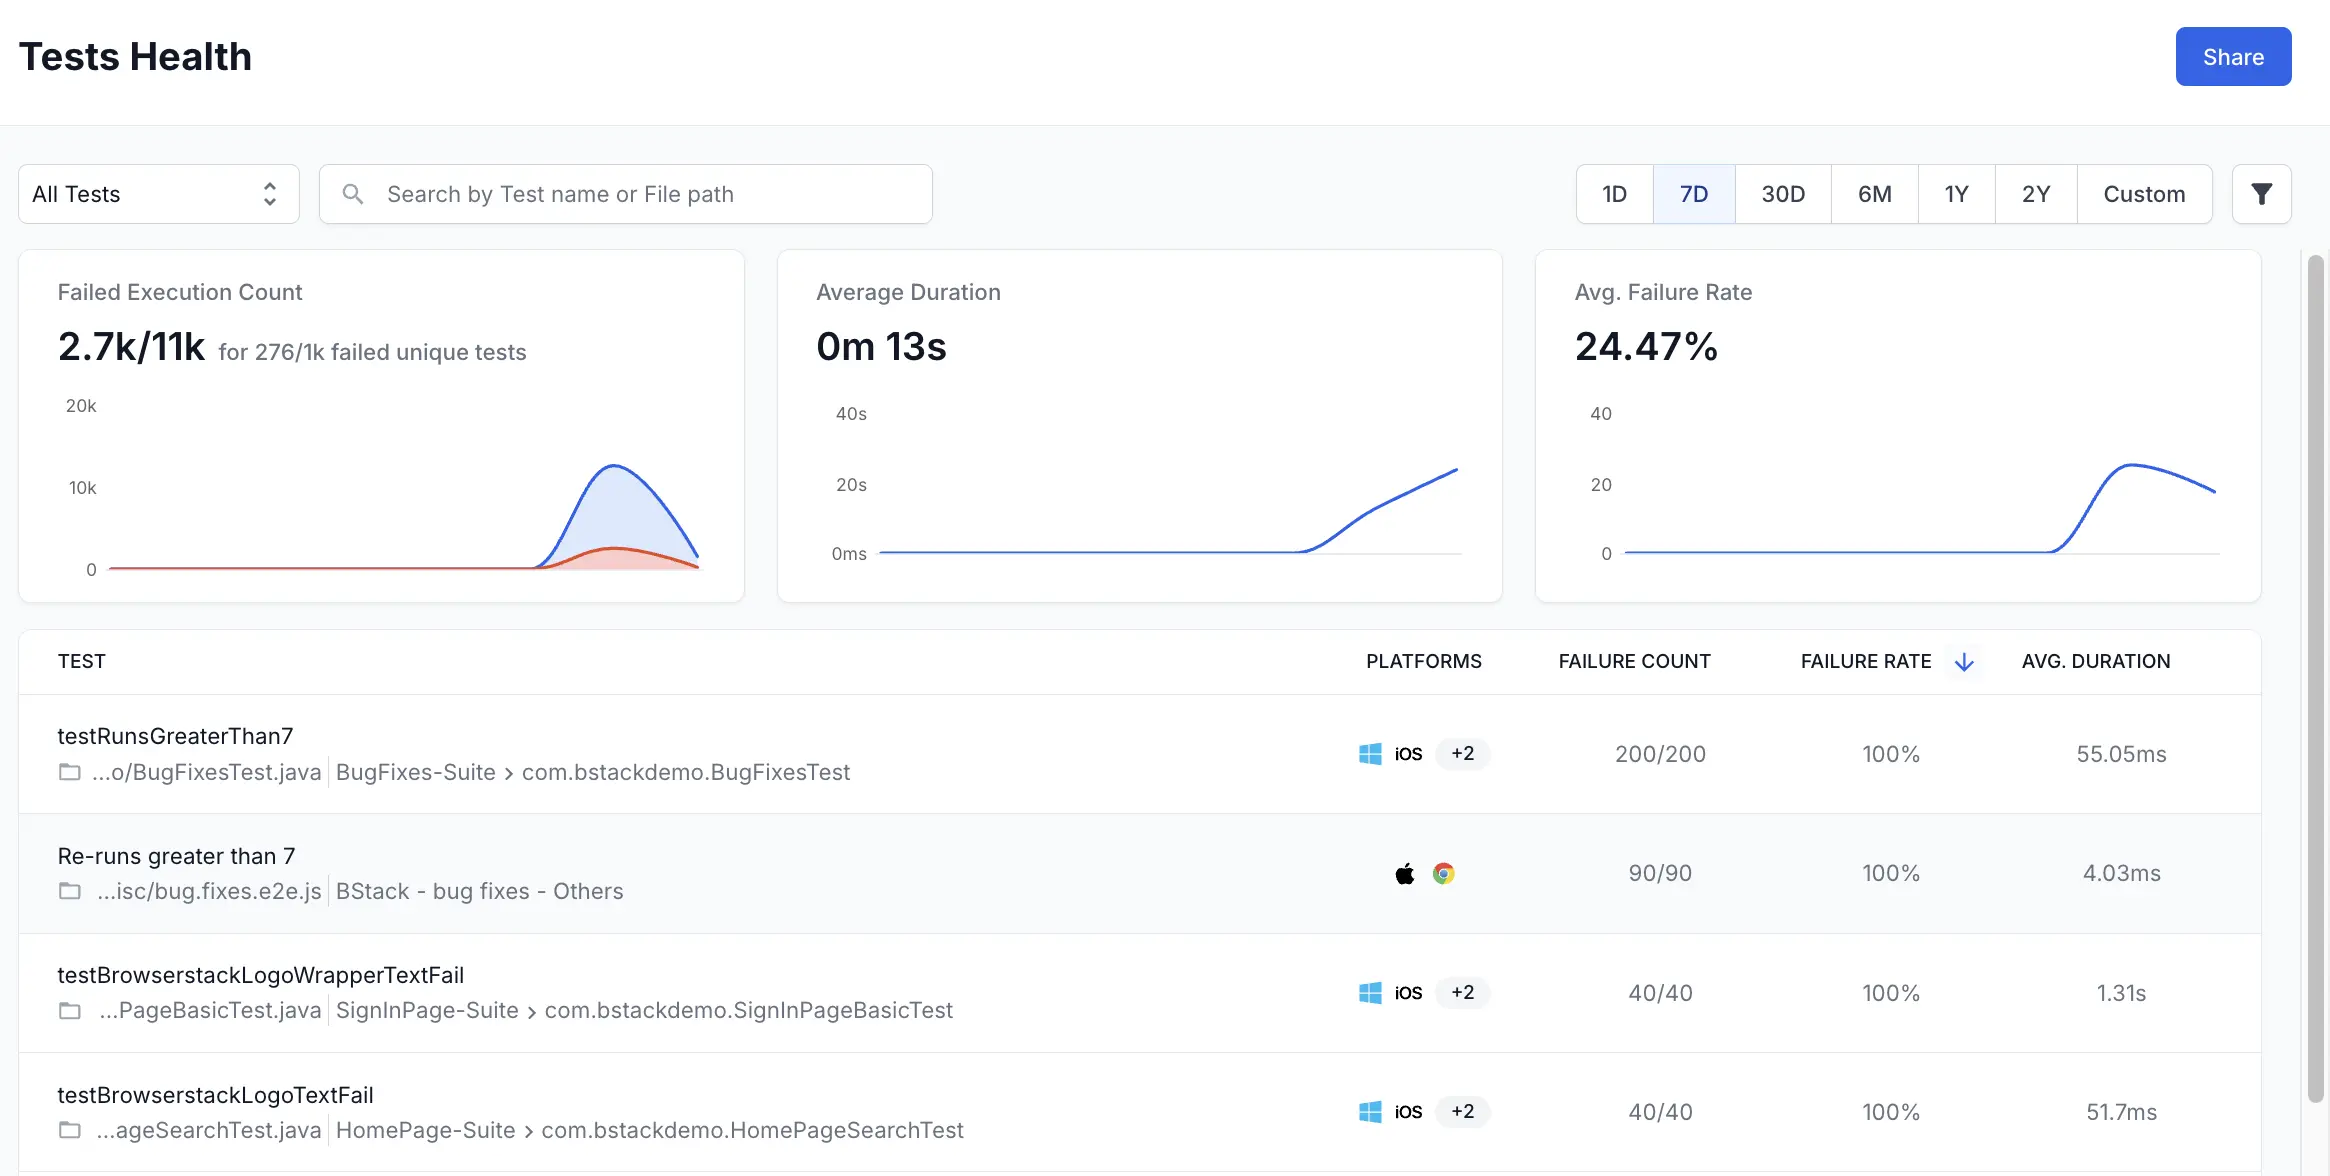
Health Dashboards: Tracks the overall health of your tests, including failure rates, flakiness, and performance. You can quickly identify which tests require attention and prioritize efforts to improve the overall health of your test suite using the Tests Health dashboard.
-
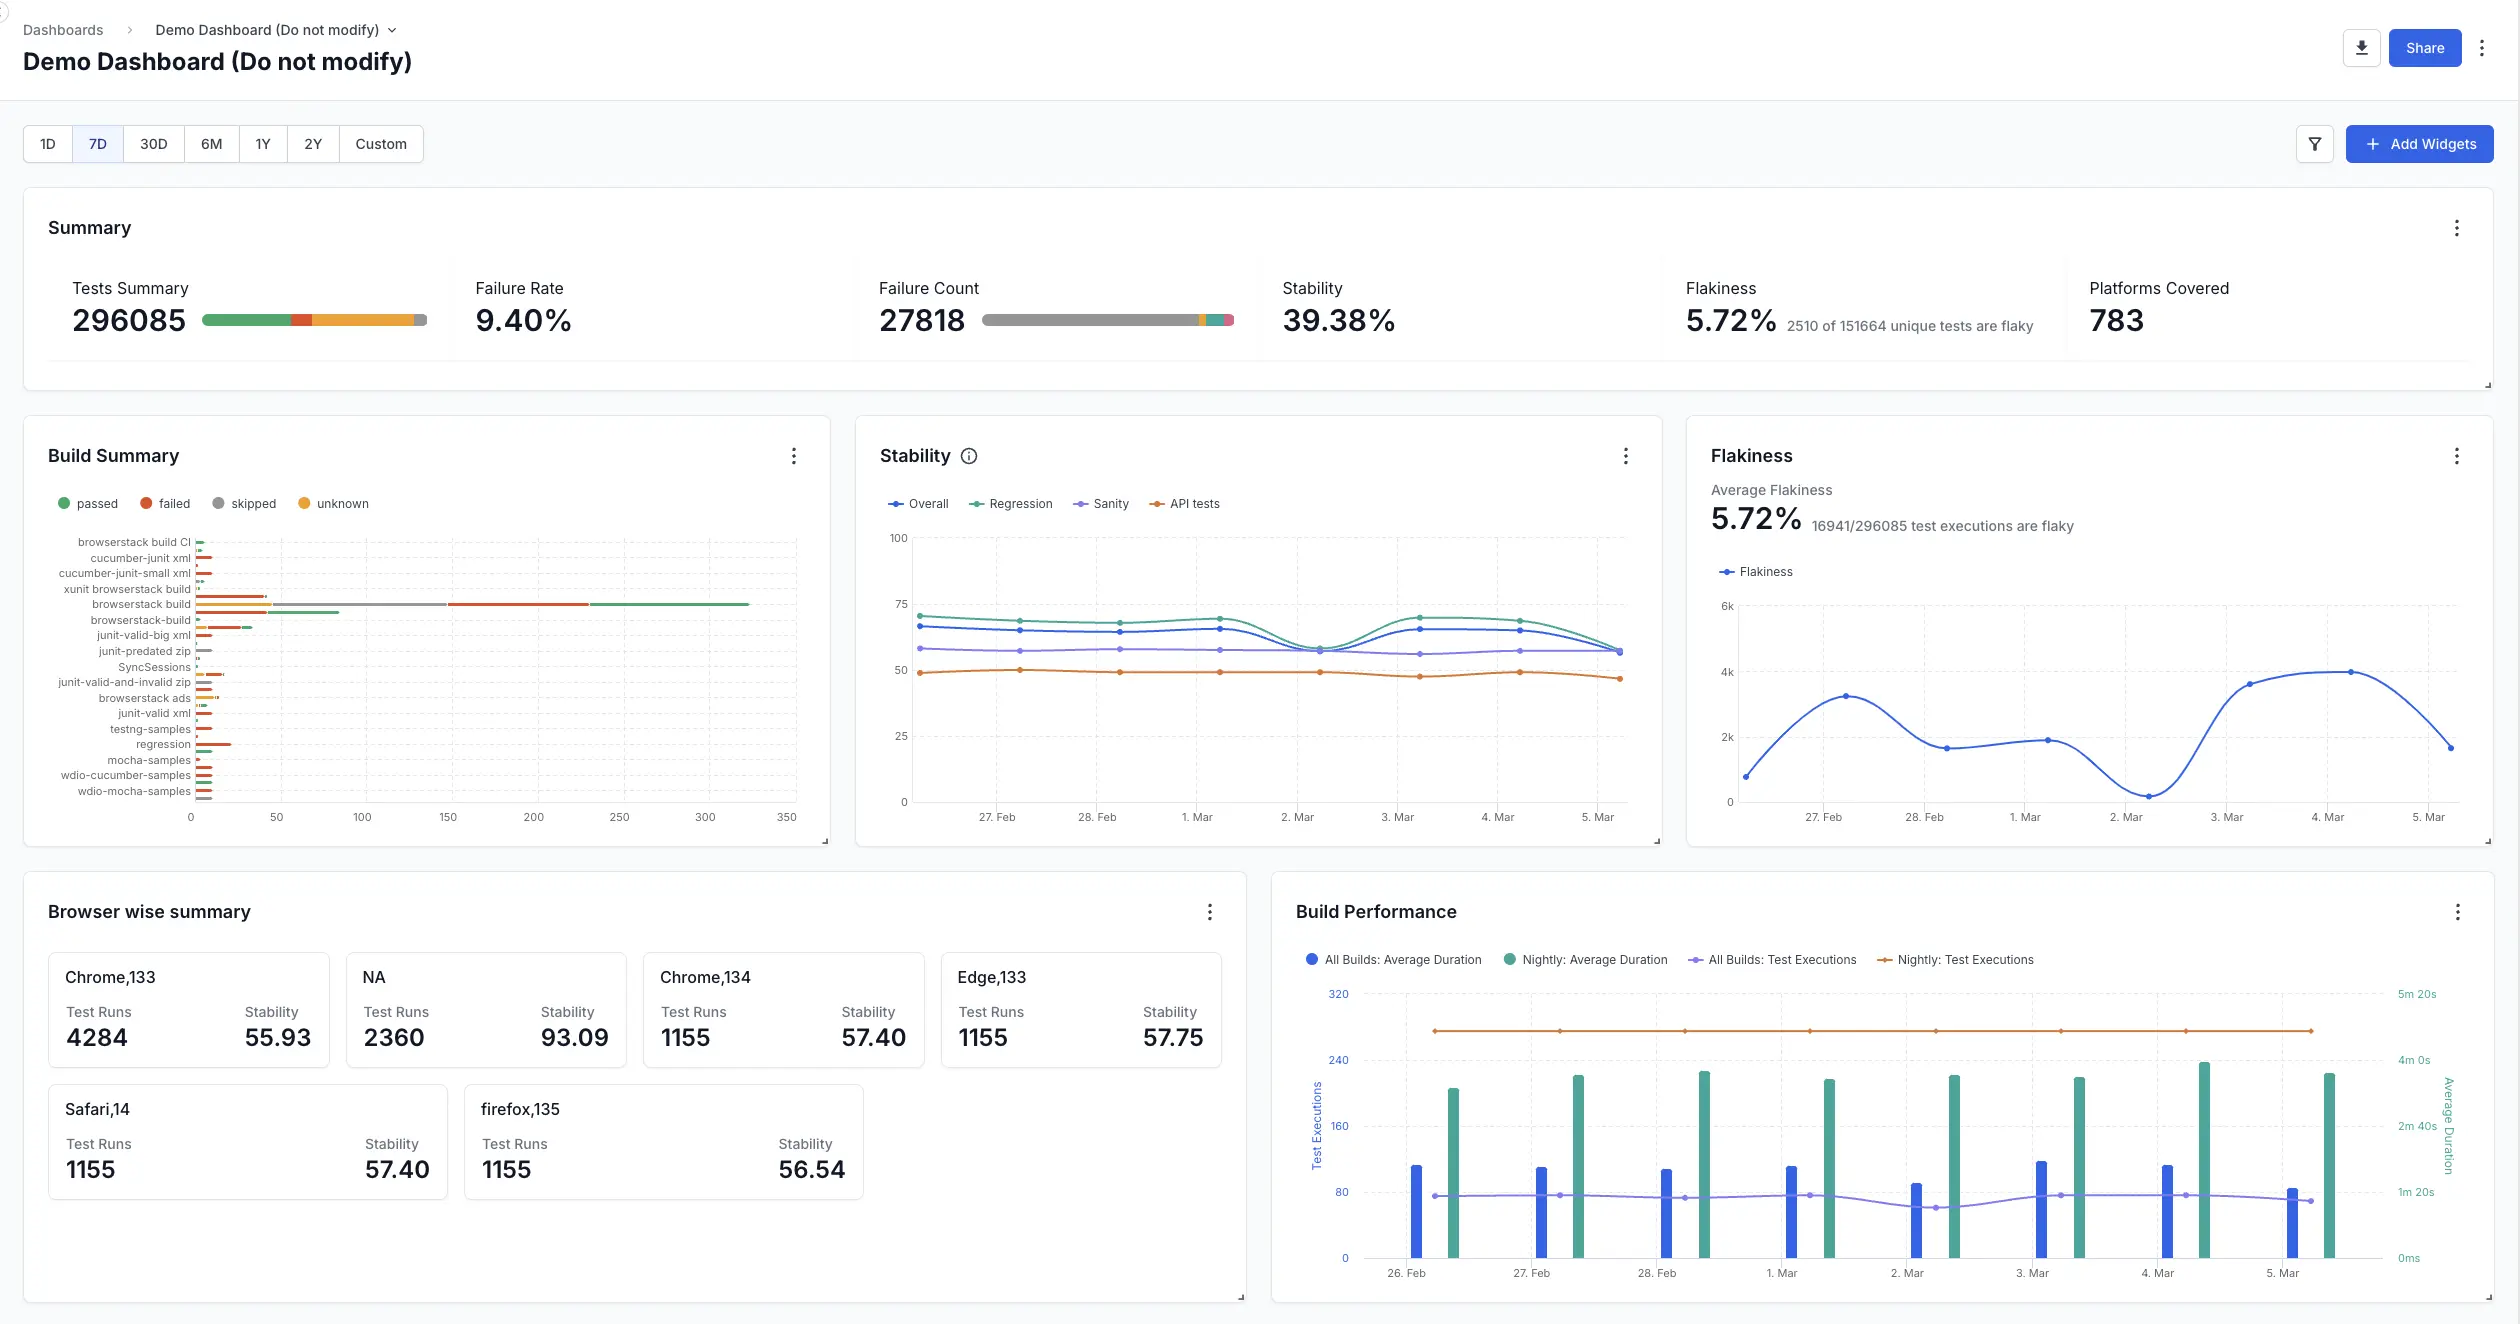
Custom Dashboards: Allows you to create personalized dashboards with pluggable widgets to track specific metrics or projects. Custom dashboards gives immense power to QAs to track everything they want to track in one single page using multiple widgets.
-
Quality Gate: Enables you to set custom quality rules for your builds, helping you automate your continuous deployment strategy. Quality Gate is designed to automate the verification of builds and help users automate PR merges and deployments, and set quality standards.

-
Rerun management: Automatically maps reruns to the same report, providing a consolidated view of test results. You can also rerun a test by the click of a button. This function addresses the common task of rerunning a failed test.

-
Timeline Debugging: Allows you to debug failures by investigating logs, videos, and stack traces in one place. The Timeline Debugging feature offers a comprehensive view of how a test performed earlier, which failures occured earlier, and what resolutions were applied.
-
Collaborative debugging: Features like user comments and integration of project management tools aid in collaborative debugging. You can improve the teamwork and leverage the collective knowledge of your team better by using these features.
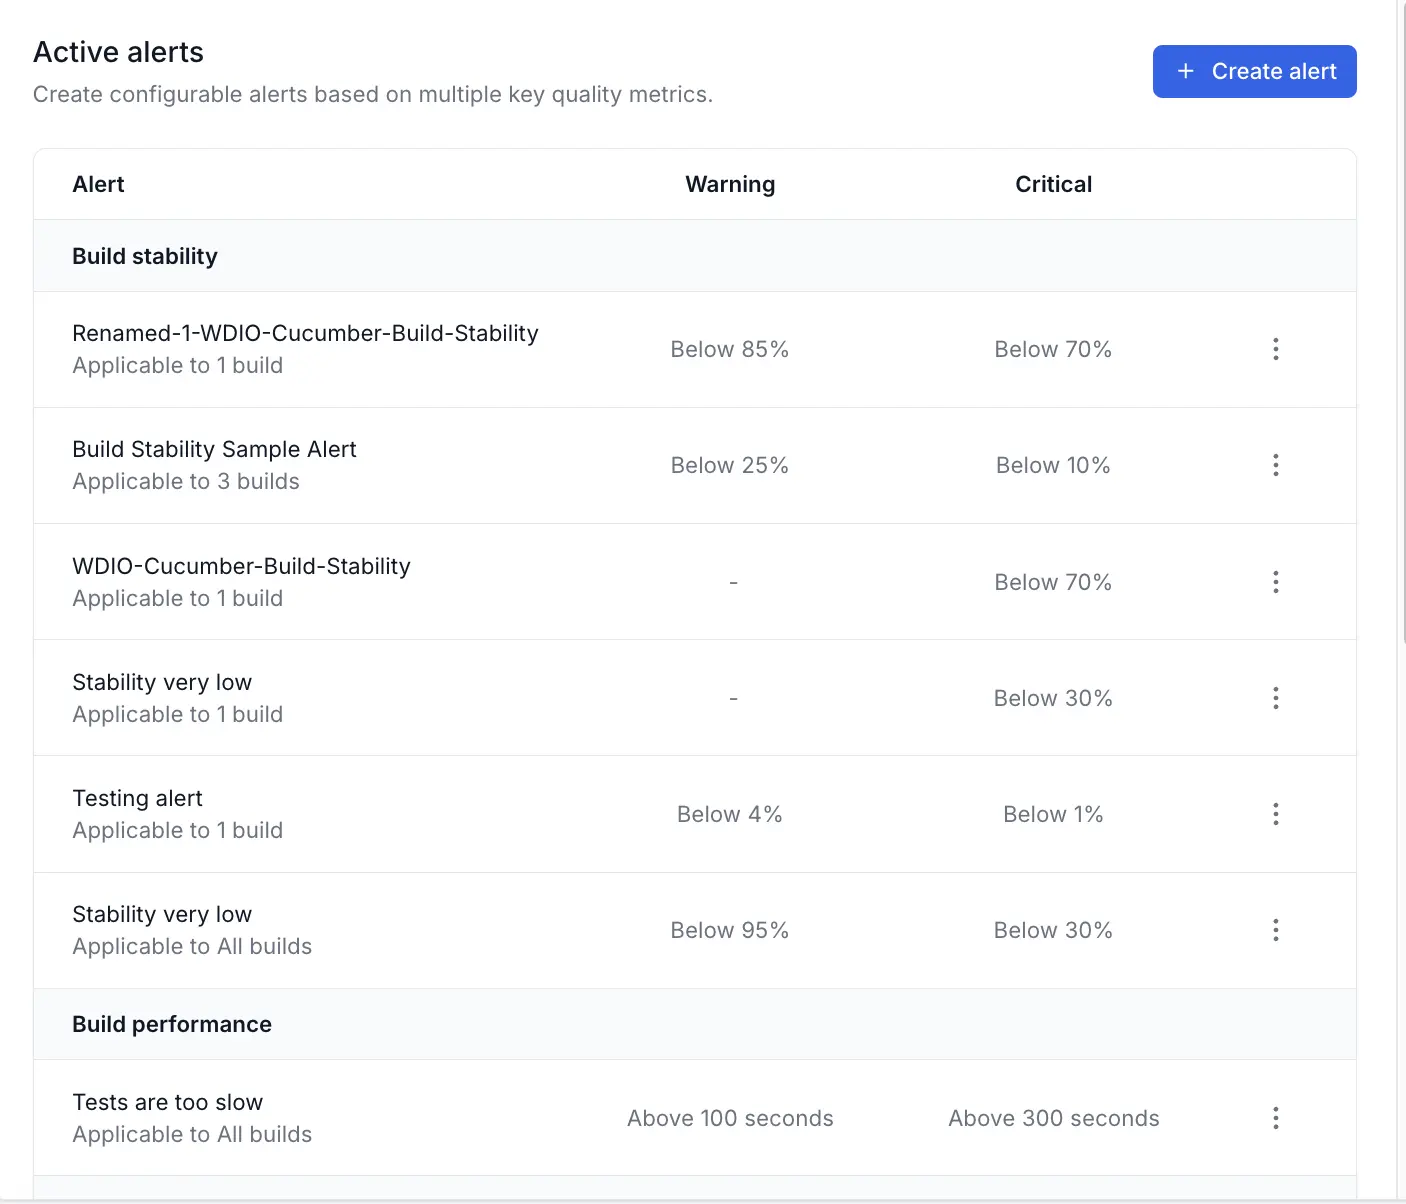
-
Alerts: Configure threshold-based alerts to get notified via email and Slack. These alerts and notifications help you stay informed if any QA thresholds you set breach.
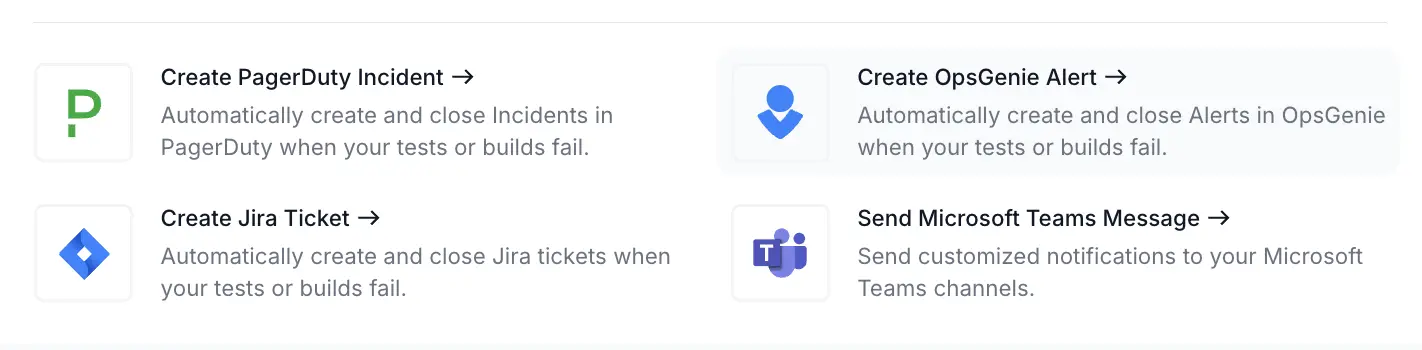
-
Ops monitoring: Configure webhooks to automate ops monitoring by integrating popular tools. You can create powerful and customizable workflows with ops monitoring / notification tools like PagerDuty, OpsGenie, Jira, and MS Teams.
How to switch to the old dashboard experience
If you prefer the old dashboard, you can toggle back to it temporarily. However, the old experience will be deprecated in the next few months, so we encourage you to transition to the new dashboard as soon as possible.
To switch to the old dashboard, click Switch to Old Version on the bottom-left of your dashboard.
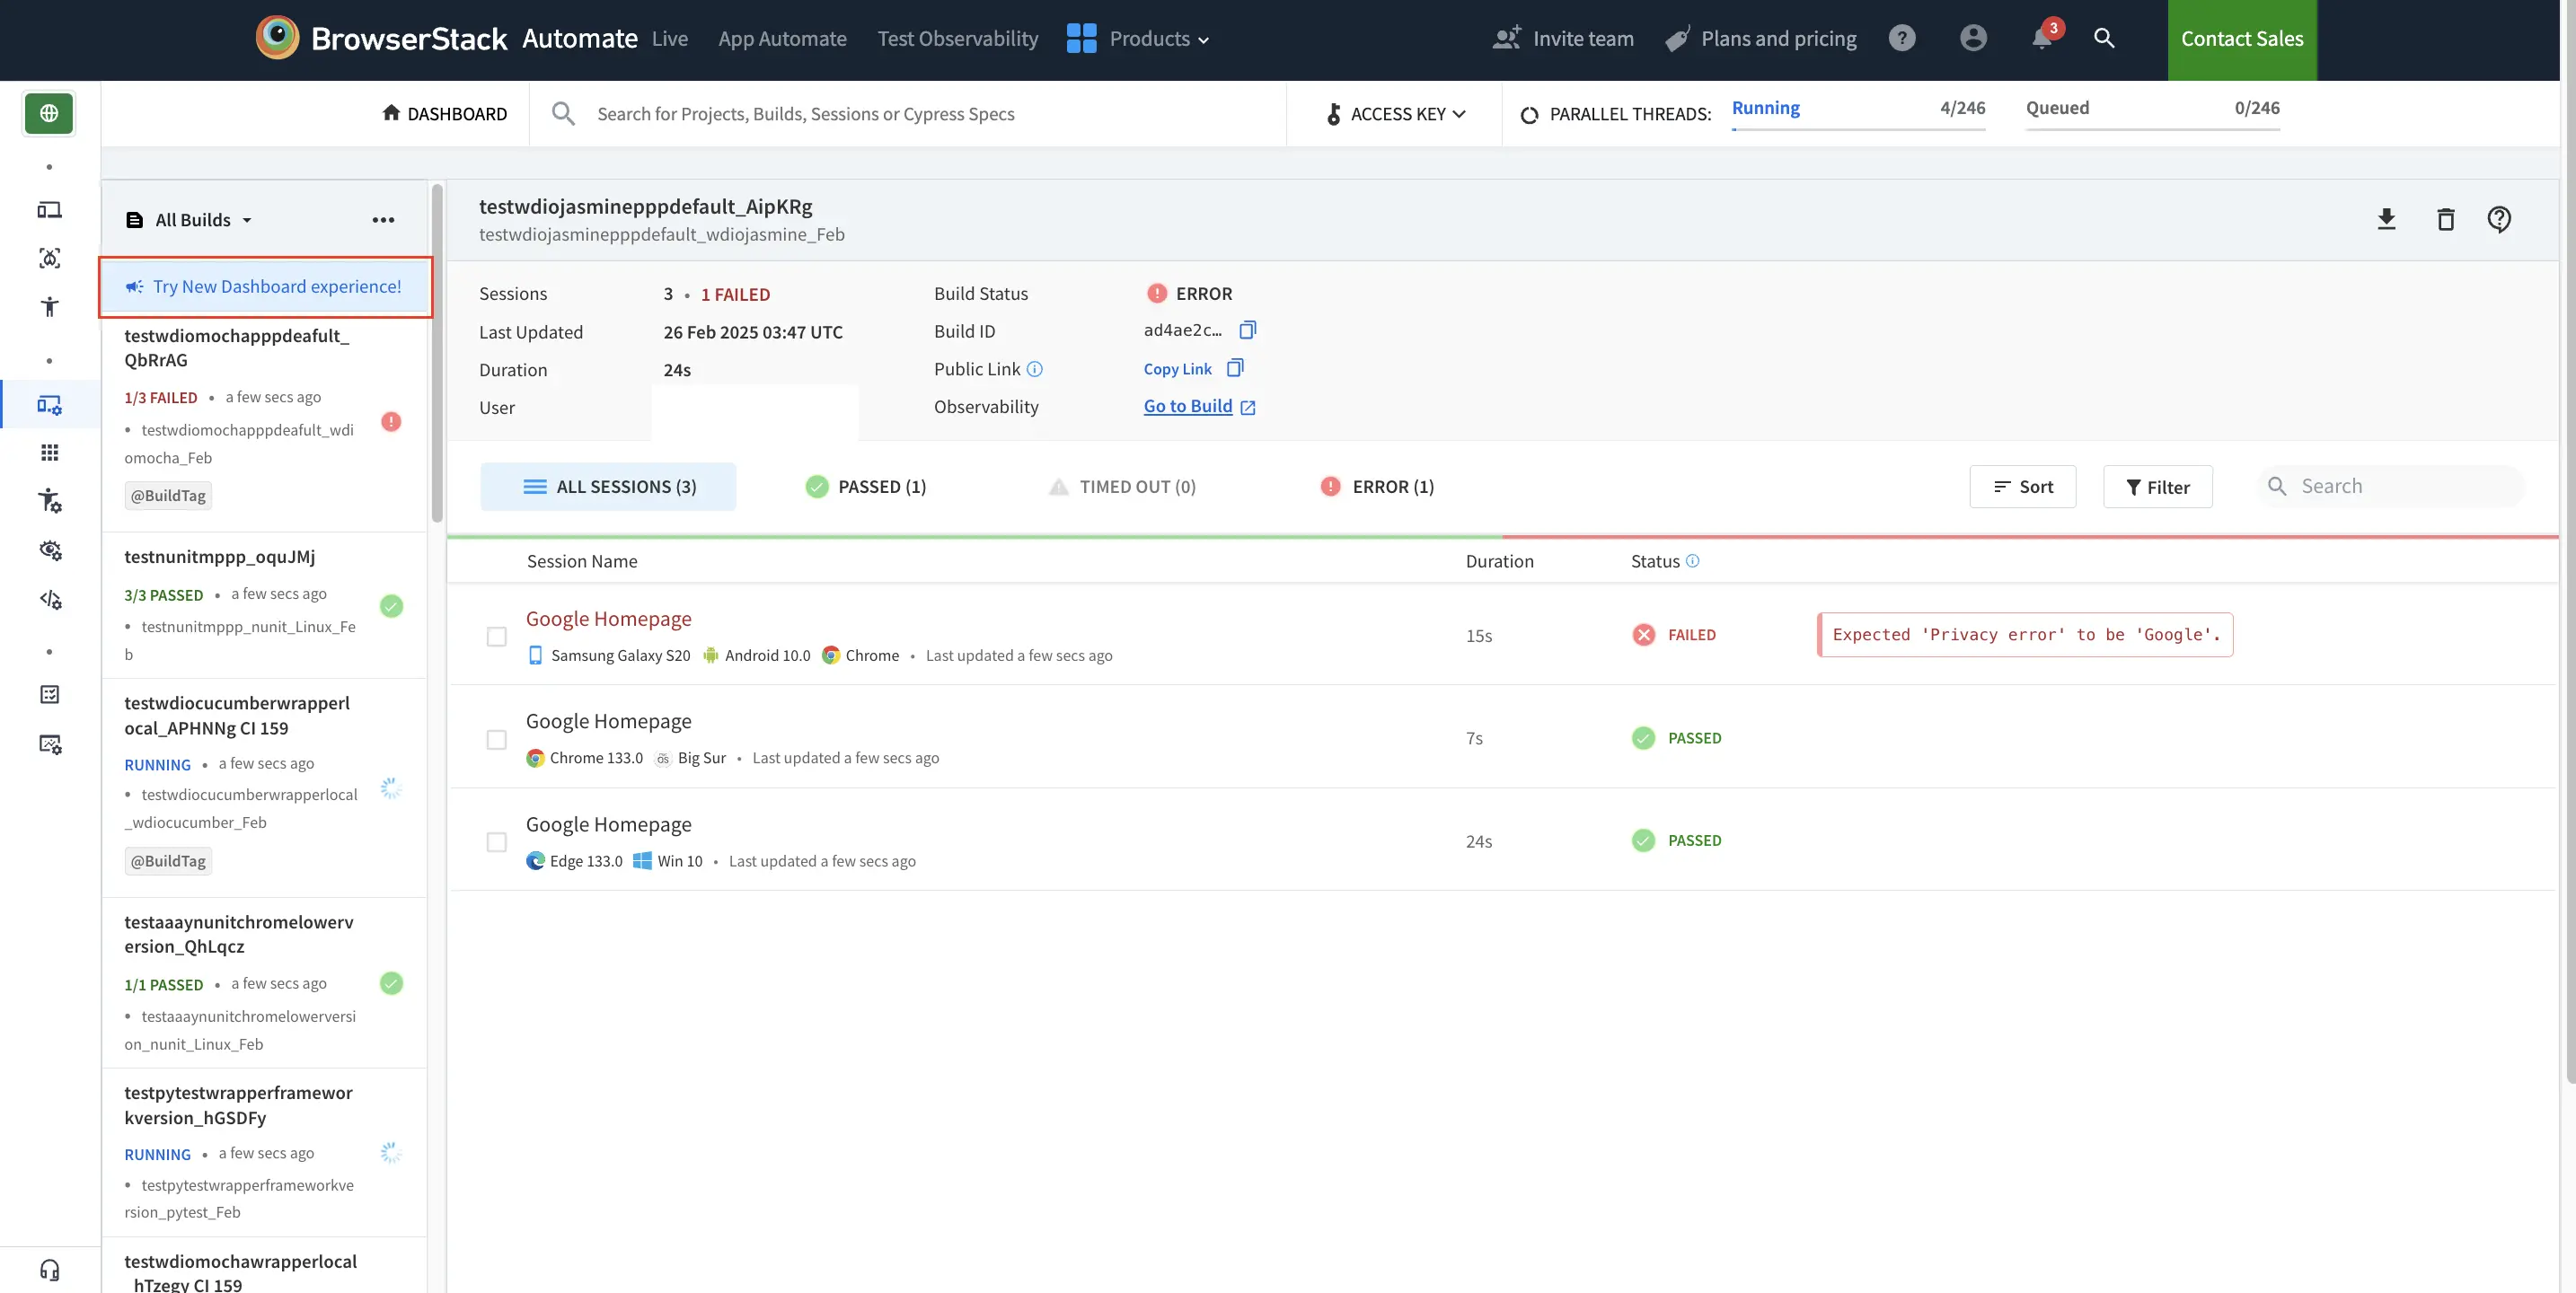
You can switch back to the new dashboard by clicking Try New Dashboard experience! on the top-left of your dashboard.
Learn more about the new dashboard
The new dashboard is a significant upgrade over the old experience, offering deeper insights, faster debugging, and better organization of test results. By transitioning to the new dashboard and integrating the SDK, you can reduce testing cycle time, improve test stability, and make more informed decisions about your builds.
For more details, visit our pricing page or explore the Test Reporting & Analytics documentation.
We're sorry to hear that. Please share your feedback so we can do better
Contact our Support team for immediate help while we work on improving our docs.
We're continuously improving our docs. We'd love to know what you liked
We're sorry to hear that. Please share your feedback so we can do better
Contact our Support team for immediate help while we work on improving our docs.
We're continuously improving our docs. We'd love to know what you liked
Thank you for your valuable feedback!