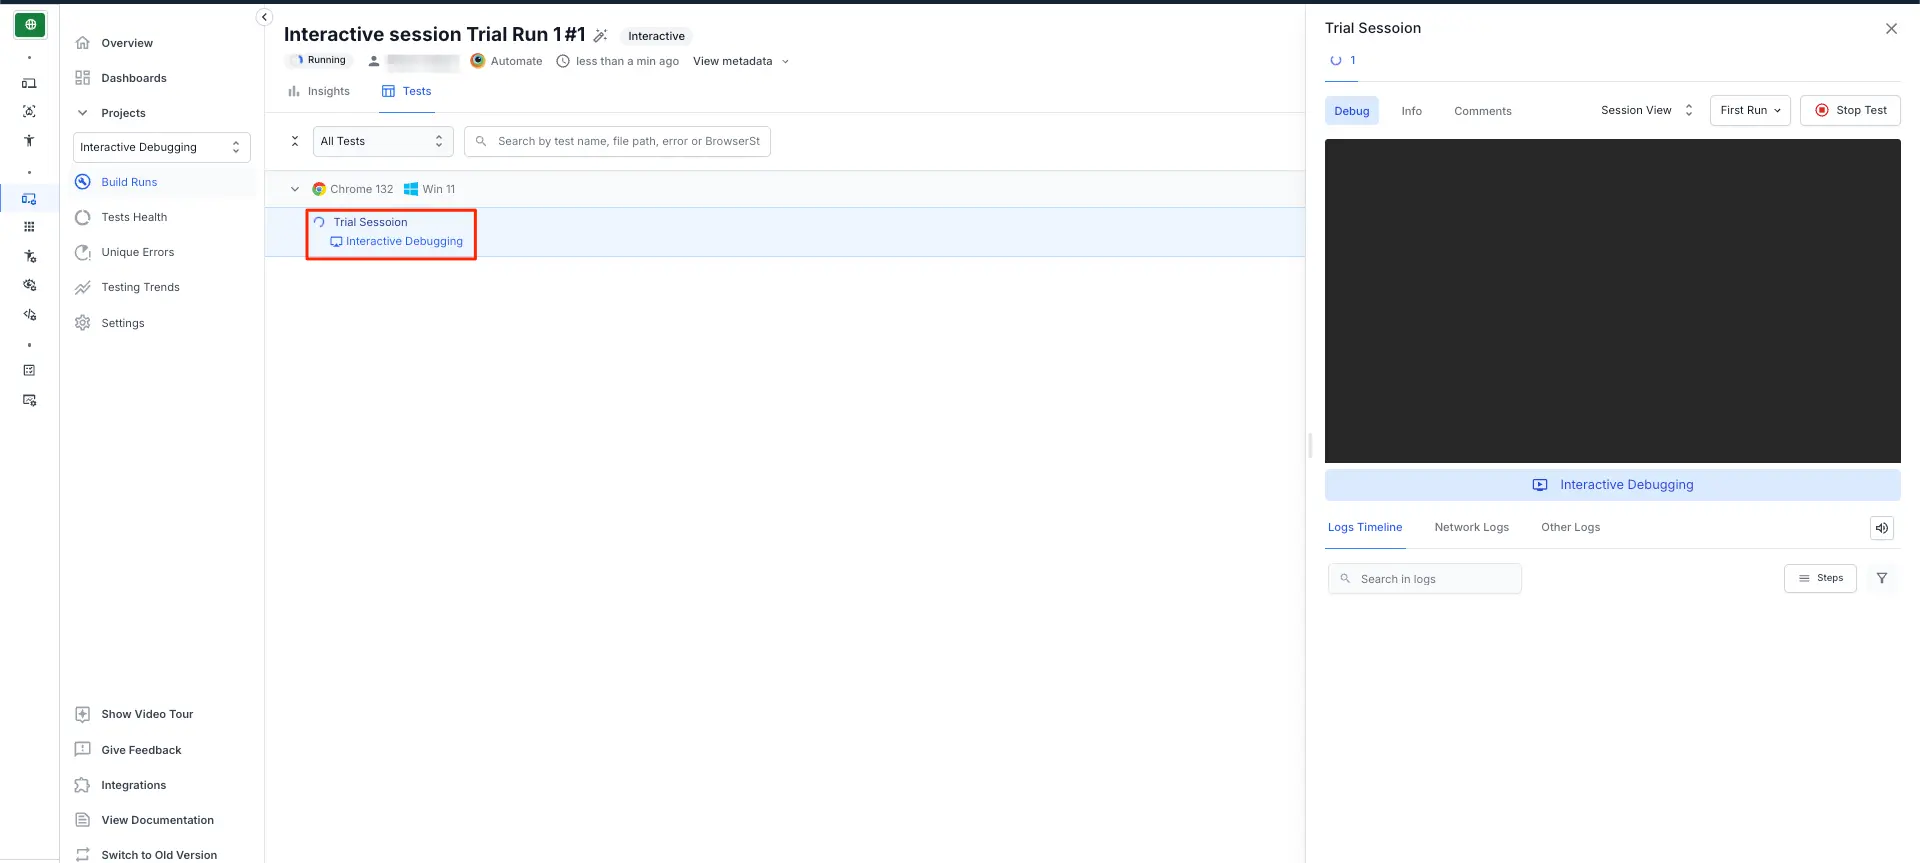
An interactive session lets you view, interact, and debug any ongoing test session on the Automate platform.
As part of running test scripts for testing websites or applications, you may encounter bugs and issues. The typical debugging process involves using verbose logging and assessing the logs for clues that might help us mitigate the issues.
Though this seems a logical approach to resolving an issue, it might not work for all kinds of issues. In some cases, where the test fails due to the presence or absence of a visual element that isn’t factored as part of the test script, the verbose logs would fail to help.
It can also happen that as part of exploratory testing, you decide to add a breakpoint in your test script and start manual testing from that point forward.
Using an interactive session, you can:
View live test execution on BrowserStack to observe how an Application Under Test (AUT) behaves during test execution. For example, viewing the Google search test execution and visually assert that your test scripts run as expected.
Interact with the application to click buttons, pop-ups, or any other application element while the test is running. For example, manually closing unexpected pop-ups encountered during automated test execution.
Inspect the source code of an AUT to view the ID of any visual element, the value of a variable, etc. For example, checking the ID of the Google Search button to update the test script.
Supported OS and Frameworks
The following table lists the supported OS and framework where you can use interactive sessions.
Component
Versions
Windows platform
All versions
macOS platform
All versions
Android platform
All versions
iOS platform
v13.4 and above
Selenium Framework
All versions
Appium Framework
- iOS: Default Appium version - Android OS: All Appium versions
Interactive debugging
The interactiveDebugging capability allows you to debug interactively while a session is in progress.
The video and interactiveDebugging capabilities both have to be set to true to enable interactive debugging.
BrowserStack does not support interactive debugging on the following devices:
Important:
Interactive session is not supported on test session that uses no-network or airplane-mode network profiles for simulating an offline network condition on the device.
On your ongoing session page, click Interactive Debugging to start an interactive session.
BrowserStack SDK is a plug-n-play solution that takes care of all the integration steps for you. Using the BrowserStack SDK is the recommended integration method for your project. To know more, visit the SDK core concepts page.
Platform
Accepted value
Desktop
Default: true. Set false to disable.
iOS
Default: true. Set false to disable.
Android
Default: false. Set true to enable.
Start an Interactive Session
To start an interactive session for any test on the Automate dashboard, you need to complete the following steps:
Run your test script in your IDE.
Navigate to your ongoing Automate session page and click Start an interactive session.
After an interactive session starts, perform any manual testing task in the interactive window on the Automate session page.
Stop the manual testing session by clicking Stop Interactive Session.
Important:
Interactive session is not supported on test session that uses no-network or airplane-mode network profiles for simulating an offline network condition on the device.
To see an example interactive session, refer to the following section.
See interactive session in action
To understand interactive session better, consider a Node.js script that opens the bstackdemo.com website, adds a product to the cart, verifies whether the product has been added to the cart, and then marks the test as passed or failed based on whether the product is available in the cart.
We will add a breakpoint using our IDE after the point in the test script flow where a product is added to a cart. When the test script execution reaches this breakpoint, we will start an interactive session that pauses the automated flow of the test script, remove the existing product from the cart, add another product to the cart, and then stop the interactive session.
A session can be debugged at a breakpoint for a default timeout of a maximum of 90 seconds. After 90 seconds, the session stops running and displays the BROWSERSTACK_IDLE_TIMEOUT error on your Automate dashboard. You can increase the timeout to a maximum of 300 seconds by adding the browserstack.idleTimeout capability in your test script. For more information, see how to resolve the BROWSERSTACK_IDLE_TIMEOUT error.
Prerequisites
Before you begin, ensure that the following prerequisites are completed:
Node.js installed on your machine.
Node.js project is created in your IDE.
IDE installed on your machine for adding breakpoint and running code in the debugger mode. Check out the following links to learn how to add breakpoints in some popular IDEs:
To start an interactive session, complete the following steps:
Open a Node.js project in the IDE, create a test script file, for example, sample.js, and add the following example code to the file:
constwebdriver=require('selenium-webdriver');const{By}=require('selenium-webdriver');constassert=require('assert');// Input capabilitiesconstcapabilities={'os_version':'11','resolution':'1920x1080','browserName':'Chrome','browser_version':'96.0','os':'Windows','interactiveDebugging':true,'name':'BStack-[NodeJS] Sample Test',// test name'build':'BStack Build Number 1'// CI/CD job or build name}asyncfunctionrunTestWithCaps(){letdriver=newwebdriver.Builder().usingServer(`https://YOUR_USERNAME:YOUR_ACCESS_KEY@hub-cloud.browserstack.com/wd/hub`).withCapabilities(capabilities).build();try{awaitdriver.get("https://bstackdemo.com/");awaitdriver.wait(webdriver.until.titleMatches(/StackDemo/i),10000);// locating product on webpageconstproductOnScreen=awaitdriver.wait(webdriver.until.elementLocated(By.xpath('//*[@id="1"]/p')),10000)// getting name of the product when the product is visibleconstproductText=awaitdriver.wait(webdriver.until.elementIsVisible(productOnScreen,10000)).getText();// clicking the 'Add to cart' buttonawaitdriver.wait(webdriver.until.elementIsVisible(driver.findElement(By.xpath('//*[@id="1"]/div[4]'),10000))).click();// Add a breakpoint here// waiting until the Cart pane has been displayed on the webpageawaitdriver.wait(webdriver.until.elementIsVisible(driver.findElement(By.className('float-cart__content'),10000)));// locating product in cartconstproductInCart=awaitdriver.wait(webdriver.until.elementLocated(By.xpath('//*[@id="__next"]/div/div/div[2]/div[2]/div[2]/div/div[3]/p[1]')),10000);// getting name of the product in cart if the product is visible on web pageconstproductCartText=awaitdriver.wait(webdriver.until.elementIsVisible(productInCart,10000)).getText();// checking whether product has been added to cart by comparing product nameassert(productText===productCartText);//marking the test as Passed if product has been added to the cartawaitdriver.executeScript('browserstack_executor: {"action": "setSessionStatus", "arguments": {"status":"passed","reason": "Product has been successfully added to the cart!"}}');}catch(e){//marking the test as Failed if product has not been added to the cartconsole.log("Error:",e.message)awaitdriver.executeScript('browserstack_executor: {"action": "setSessionStatus", "arguments": {"status":"failed","reason": "Failed to add product to the cart or some elements failed to load."}}');}awaitdriver.quit();}runTestWithCaps();
Add a breakpoint at the line commented as // Add a breakpoint here in the example code to pause the test execution after a product is added to the cart. Check out the using breakpoints guide to learn how to add a breakpoint in Visual Studio Code..
Run the code in the debugger mode of the IDE. Check out the start debugging guide to learn how to run a code in a debugger code in Visual Studio code.
Note: A session can be debugged at a breakpoint for a default timeout of a maximum of 90 seconds. After 90 seconds, the session stops running and displays the BROWSERSTACK_IDLE_TIMEOUT error on your Automate dashboard. You can increase the timeout to a maximum of 300 seconds by adding the browserstack.idleTimeout capability in your test script. For more information, see how to resolve the BROWSERSTACK_IDLE_TIMEOUT error.
Go to your Automate dashboard and navigate to the ongoing session.
On your ongoing session page, click Interactive Debugging.
After the interactive session starts, remove the existing product from the cart, add another product to the cart, and click Stop Interactive Session to exit the interactive mode.
In the IDE, click the Continue icon on the Debug toolbar to resume the test script execution.
The test script resumes its execution and displays the test result as FAILED in the build details on BrowserStack. This is expected behavior since we deviated from the test script assertions.
Inspecting website’s elements using Developer Tools is only supported on desktop operating systems.
Did this page help you?
We're sorry to hear that. Please share your feedback so we can do better
Contact our Support team for immediate help while we work on improving our docs.
We're continuously improving our docs. We'd love to know what you liked
Thank you for your valuable feedback
Is this page helping you?
Yes
No
We're sorry to hear that. Please share your feedback so we can do better
Contact our Support team for immediate help while we work on improving our docs.
We're continuously improving our docs. We'd love to know what you liked

 Join our Discord