Engine Health tab
Check whether BrowserStack load-generator engines stayed healthy during a hybrid run so you can tell client-side from server-side issues.
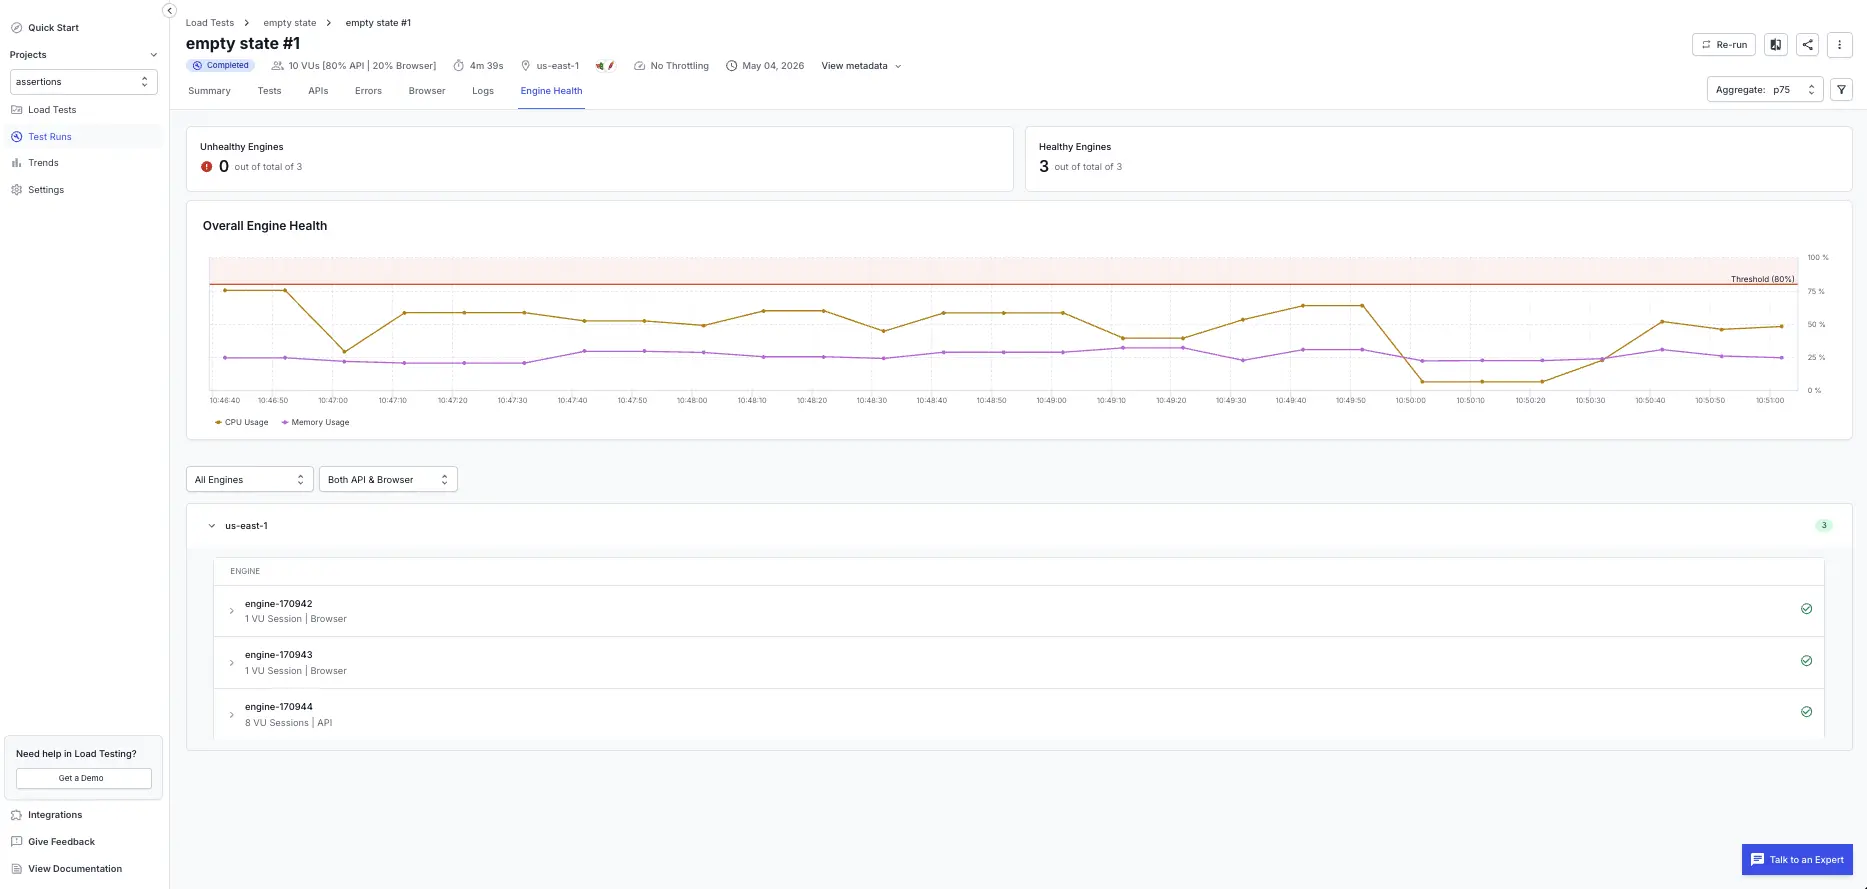
The Engine Health tab reports the health of the BrowserStack load-generator engines that drove the run (these are the machines that BrowserStack uses to generate virtual user load, not your application servers). High resource usage on any engine can skew results, cause sampling delays, or introduce bottlenecks unrelated to your application. This tab helps you identify those issues and rule them out before you investigate your application.
On this tab, you can:
- View the count of unhealthy engines at the top of the page. An engine that crosses 80% CPU or memory usage at any point during the test is flagged as Unhealthy.
- Expand any engine panel to inspect details. Each panel shows the engine identifier (for example,
engine-95815), the region (for example,us-east-1), and the number of VUs executed on that engine (for example,10 VUs). - Review the CPU and memory usage chart over time. The time-series chart plots virtual users (actual load), CPU usage (%), and memory usage (%) against time, with a dashed red threshold line at 80% to highlight when usage exceeds limits.
- Toggle between API Engines and Browser Engines to see health metrics for the API portion and browser portion of your hybrid test separately.
Use Engine Health to tell client from server issues
Engine Health is the fastest way to decide whether a failure spike originated on BrowserStack’s side or on your application’s side. When you see the error rate fluctuate during a run:
- Open the Engine Health tab and overlay the time of the spike on the CPU and memory chart.
- If one or more engines crossed the 80% threshold or were flagged as Unhealthy at that time, the failure was driven by the load-generator side (virtual users on that engine could not push load reliably). This is a server-side issue on BrowserStack’s load generators, not in your application.
- If every engine stayed healthy through the spike, the failure originated in your application or its dependencies. Continue debugging in the Tests, API, Errors, or Logs tabs.
This separation lets you avoid spending debugging time on your application when the root cause was on the load-generator side.
Filter engines
Use the controls at the top of the engine list to narrow the view:
- Health filter: show all engines, only Unhealthy engines, or only Healthy engines. Use the unhealthy filter when you only want to triage the engines that crossed the threshold.
-
Region filter: show engines from a single region (for example,
us-east-1,ap-south-1). Use this to confirm a regional pattern before deciding whether to redistribute the run across regions. - Engine type toggle: switch between API Engines and Browser Engines to see health metrics specific to each portion of your hybrid run.
Common causes of high engine usage
- Scripts that perform heavy computation or contain infinite or tight loops.
- High number of timeouts, exceptions, or unhandled errors.
- Lack of pacing (add
sleepto model realistic user behavior). - Large response payloads causing high memory consumption and garbage collection.
- Reading or processing large files from disk.
If engines continue to hit high usage after addressing these causes, reach out to us.
We're sorry to hear that. Please share your feedback so we can do better
Contact our Support team for immediate help while we work on improving our docs.
We're continuously improving our docs. We'd love to know what you liked
We're sorry to hear that. Please share your feedback so we can do better
Contact our Support team for immediate help while we work on improving our docs.
We're continuously improving our docs. We'd love to know what you liked
Thank you for your valuable feedback!