
 Join our Discord
Measure automation coverage
Measure test case coverage in Test Companion. Find the product behaviors that no test case in a Test Management folder or a CSV file covers.
Test case coverage answers one question: do your test cases cover what your product does? Test Companion first reads a source that describes your product, such as a requirements document or your workspace code. From that source it writes a list of product behaviors. It then checks each behavior against the test cases in a Test Management folder or a CSV file. The report shows the share of behaviors that your test cases cover, with the test cases cited as evidence. From the report, you can add a missing test case to Test Management. You can also exclude a behavior you do not plan to test.
Coverage verdicts come from an AI model, not from a test run. Review the cited evidence before you rely on a figure.
Test case coverage and Automation coverage start from the same card. Automation coverage checks whether your automation scripts cover the test cases in a Test Management folder. It has its own report and its own gap action, and this page does not describe it.
Prerequisites
You need the following before you start:
- Test Companion 1.38.0 or later in Visual Studio Code. The other IDEs and the CLI do not offer Test case coverage. A reply that coverage analysis is not available in this build means your account does not have the feature yet.
- A folder open in Visual Studio Code. Test Companion stores the behavior list and the report in that folder.
- A source that describes your product. The Product sources section lists them.
- Your test cases, in one of the following places:
- A folder in a BrowserStack Test Management project that your account can read.
- A CSV file with a header row and a column that holds each test case title. Any test management tool can export this file.
Measure coverage
The analysis starts from a card in the chat. Fill in the three rows on the card, then start the check:
- Open the Test Companion panel and click New Task. On a narrow panel, the button reads New.
- Confirm that Web mode is selected at the bottom of the panel.
- Start the analysis in one of the following ways:
- In the chat box, type a request that names test case coverage, such as
Measure test case coverage against the Checkout folder, and press Enter. - On the home screen, when it shows the workflow tabs, click the Quality tab and then Check coverage. Press Enter to send the prompt that Test Companion fills in.
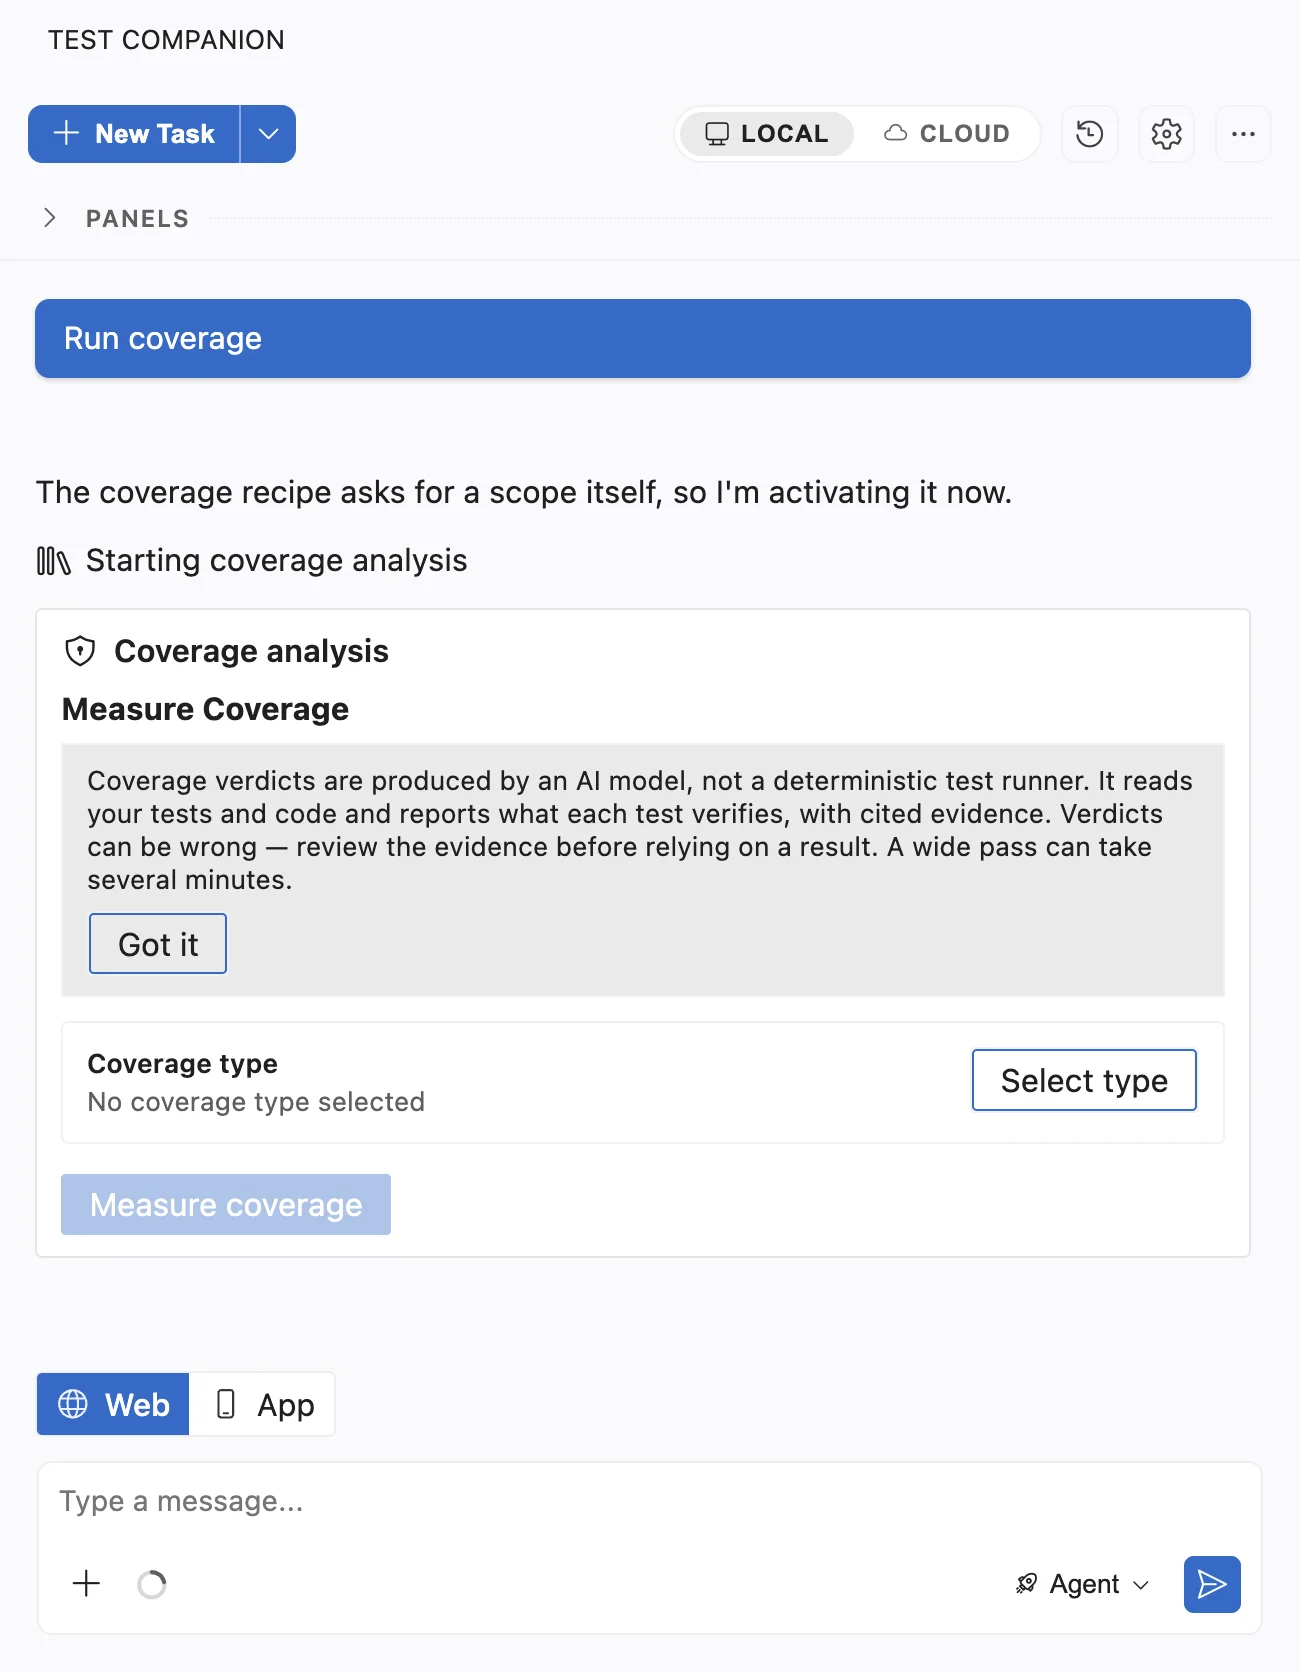
Test Companion posts a Coverage analysis card in the chat. The card opens with a notice that an AI model produces the verdicts, and with the Coverage type row.
- In the chat box, type a request that names test case coverage, such as
-
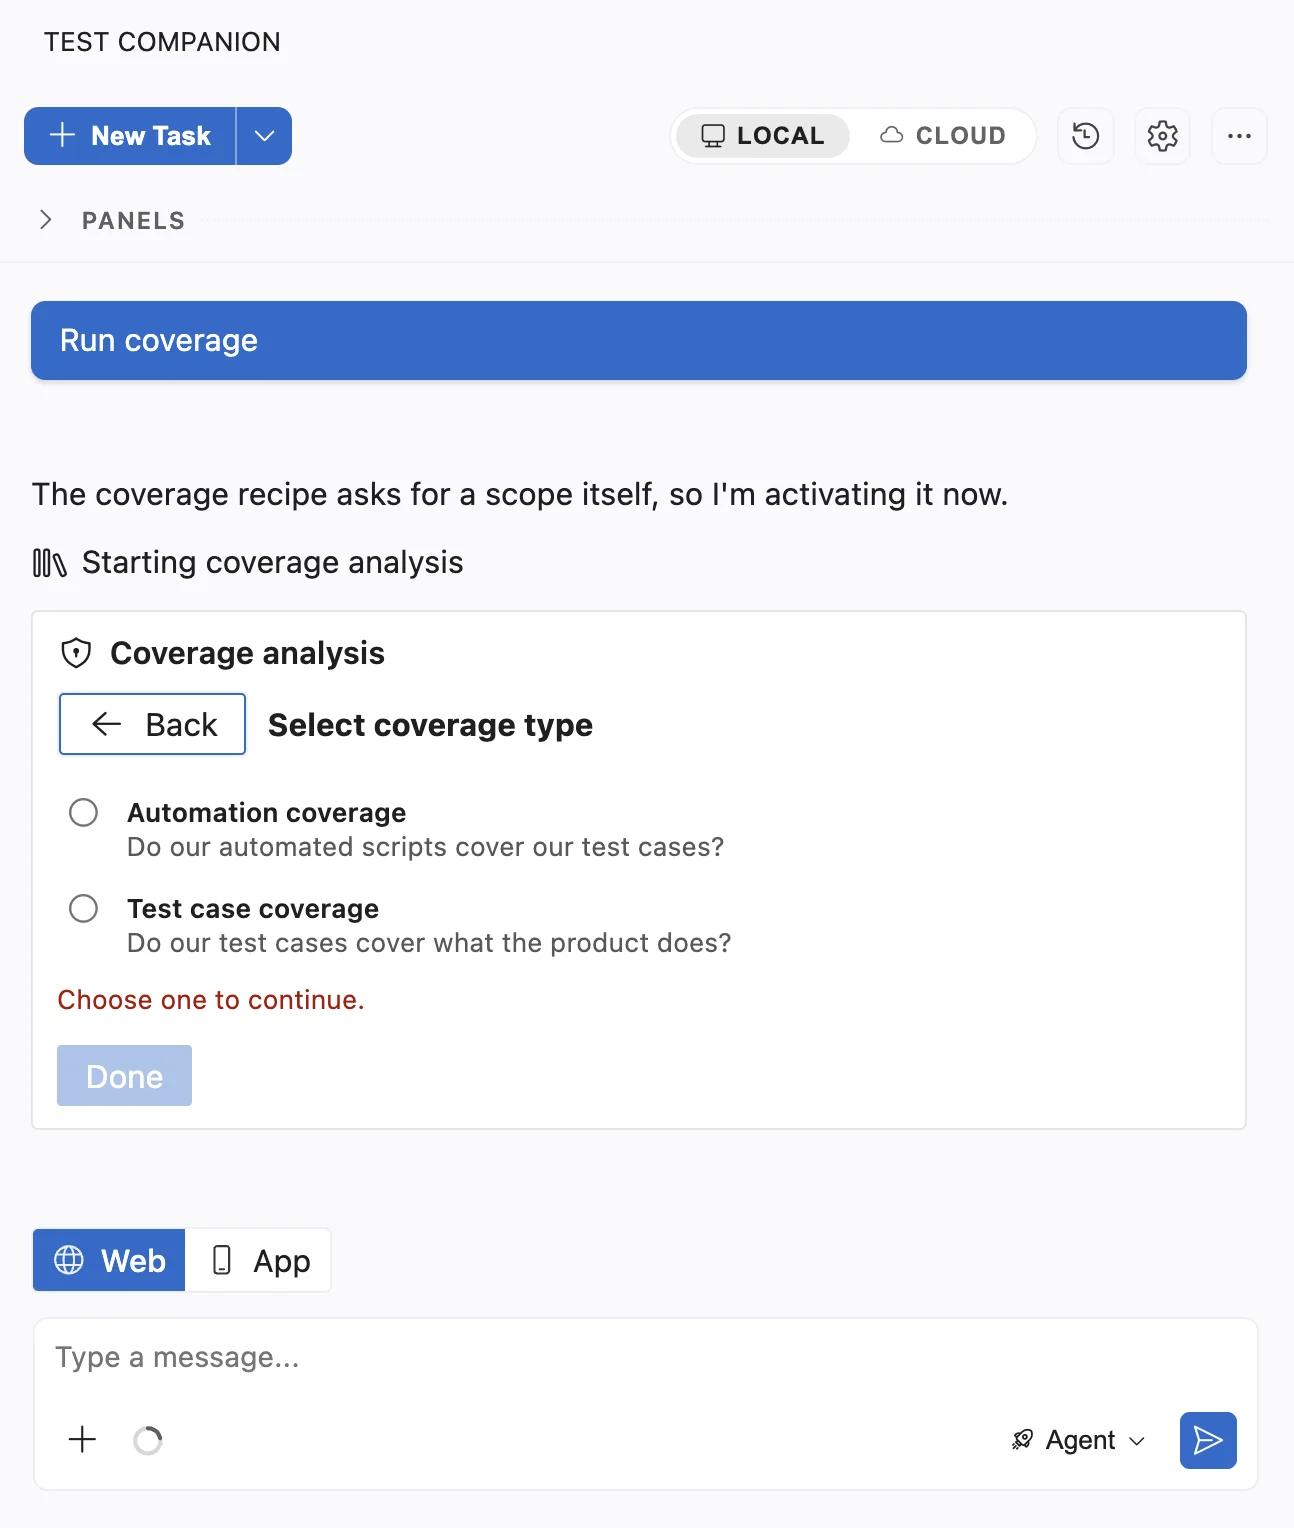
In the Coverage type row, click Select type. Select Test case coverage and click Done. If your prompt named test case coverage, this row is already filled in.
The card now shows the Product source and Measured against rows under the coverage type.
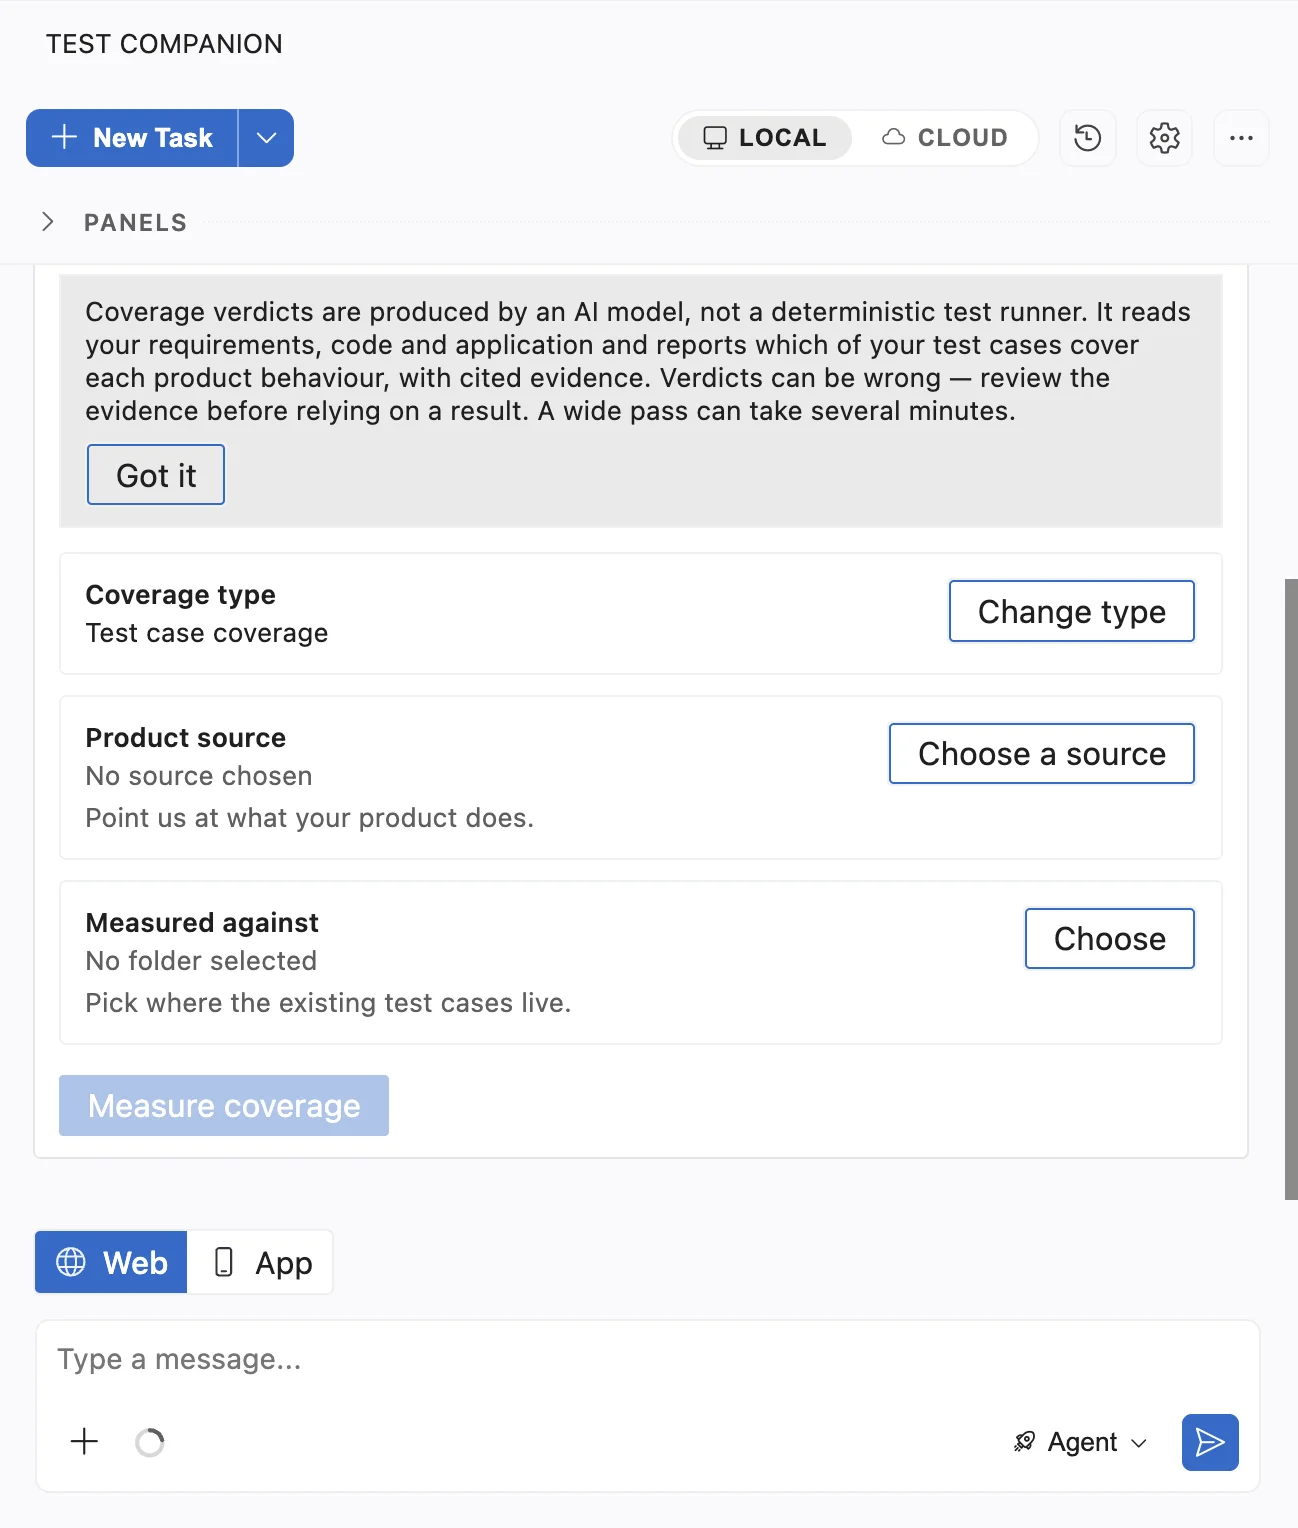
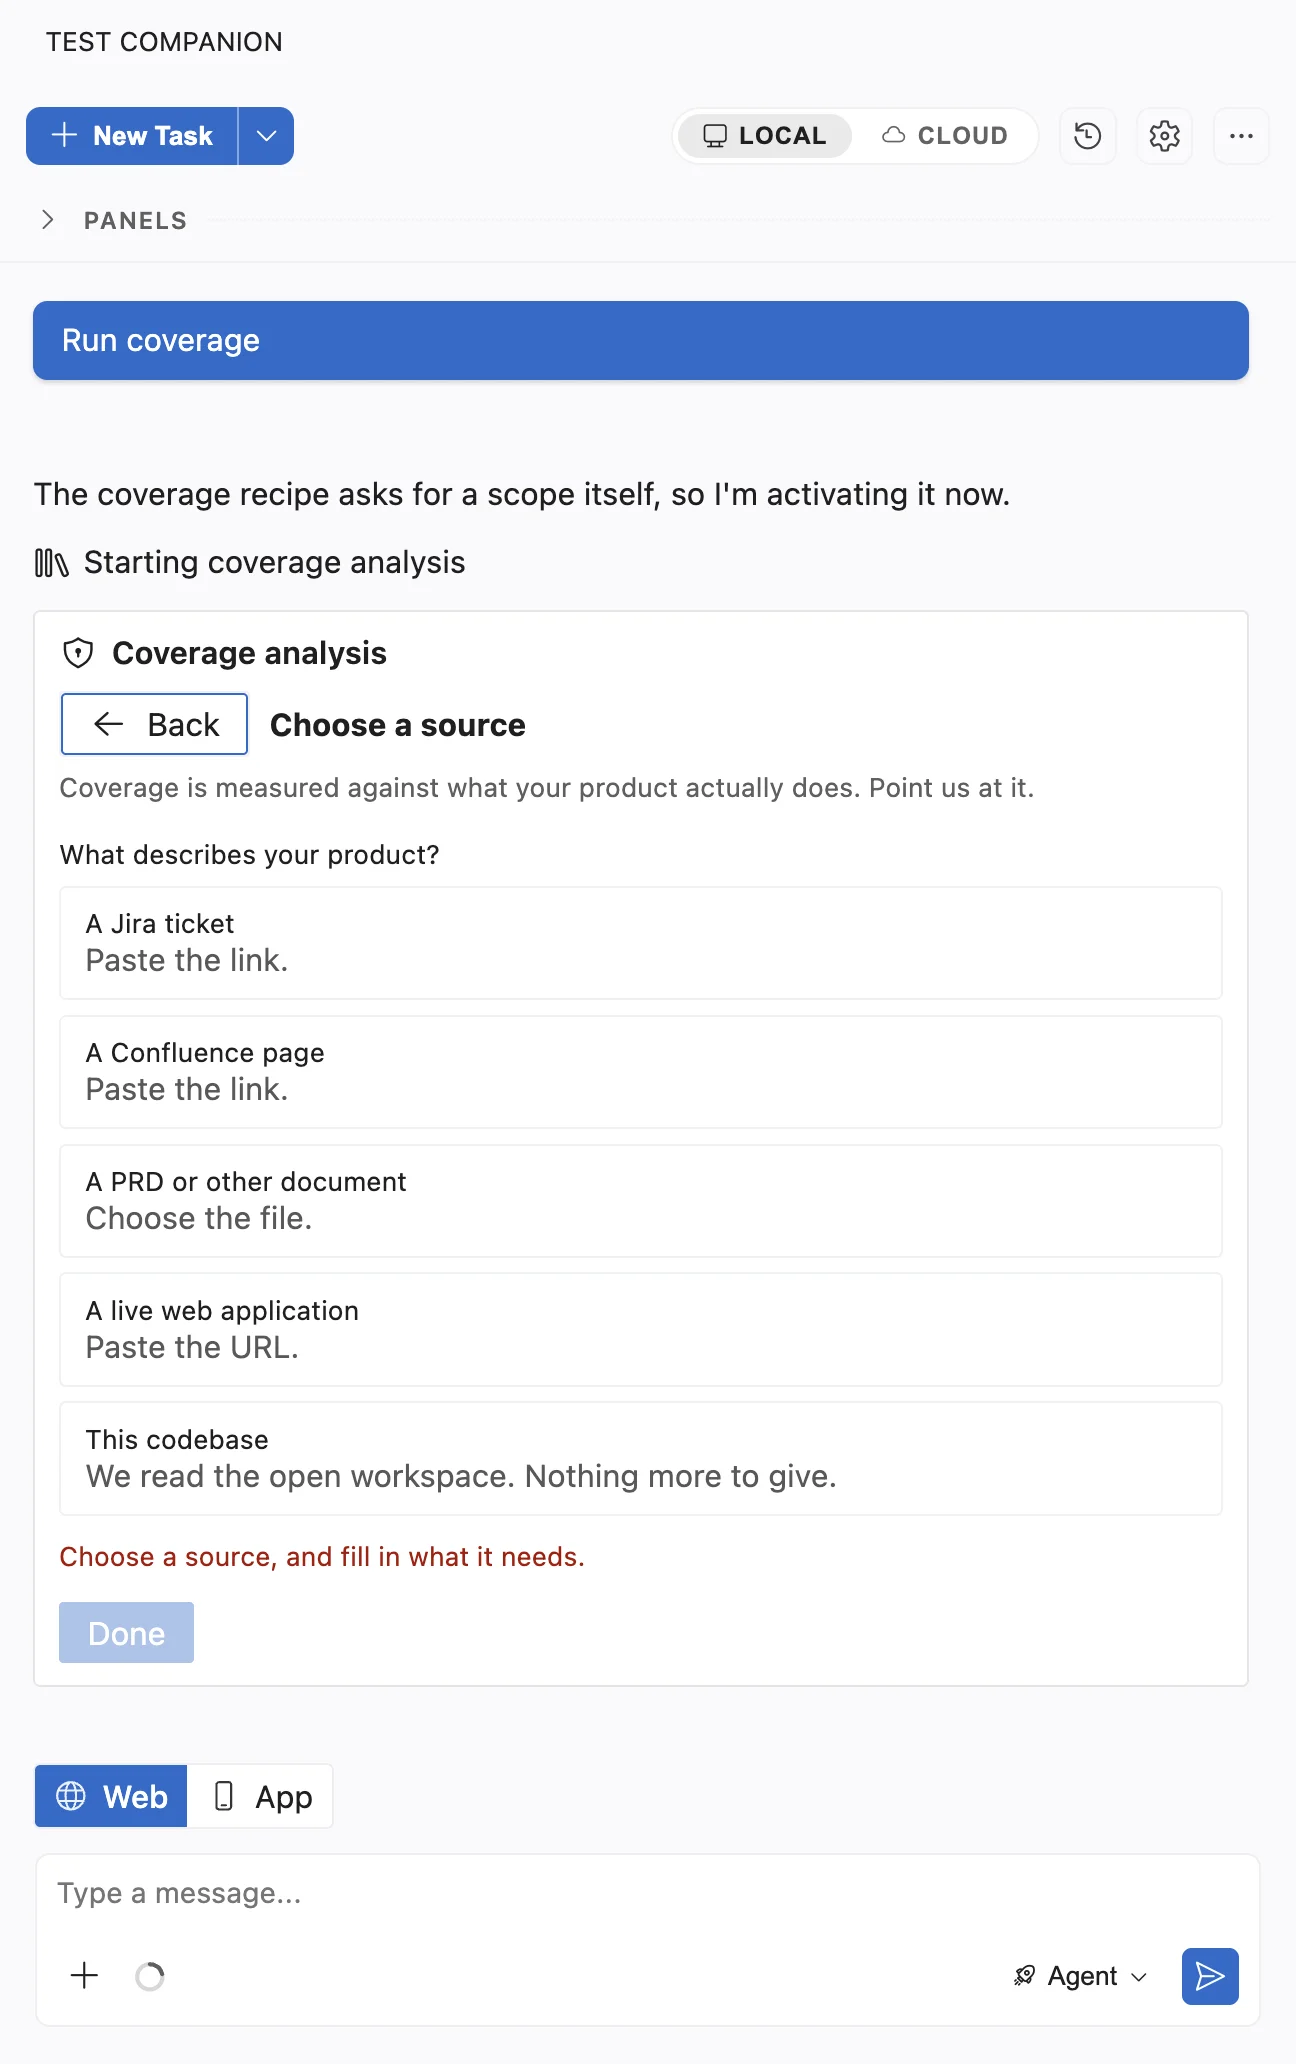
- In the Product source row, click Choose a source and select the source that describes your product. Then add the input that the source needs and click Done:
- For a document, pick the file in the dialog that opens.
- For a Jira ticket, a Confluence page, or a web application, paste the link in the field.
- For this codebase, add nothing.
The Product sources section has the full list.
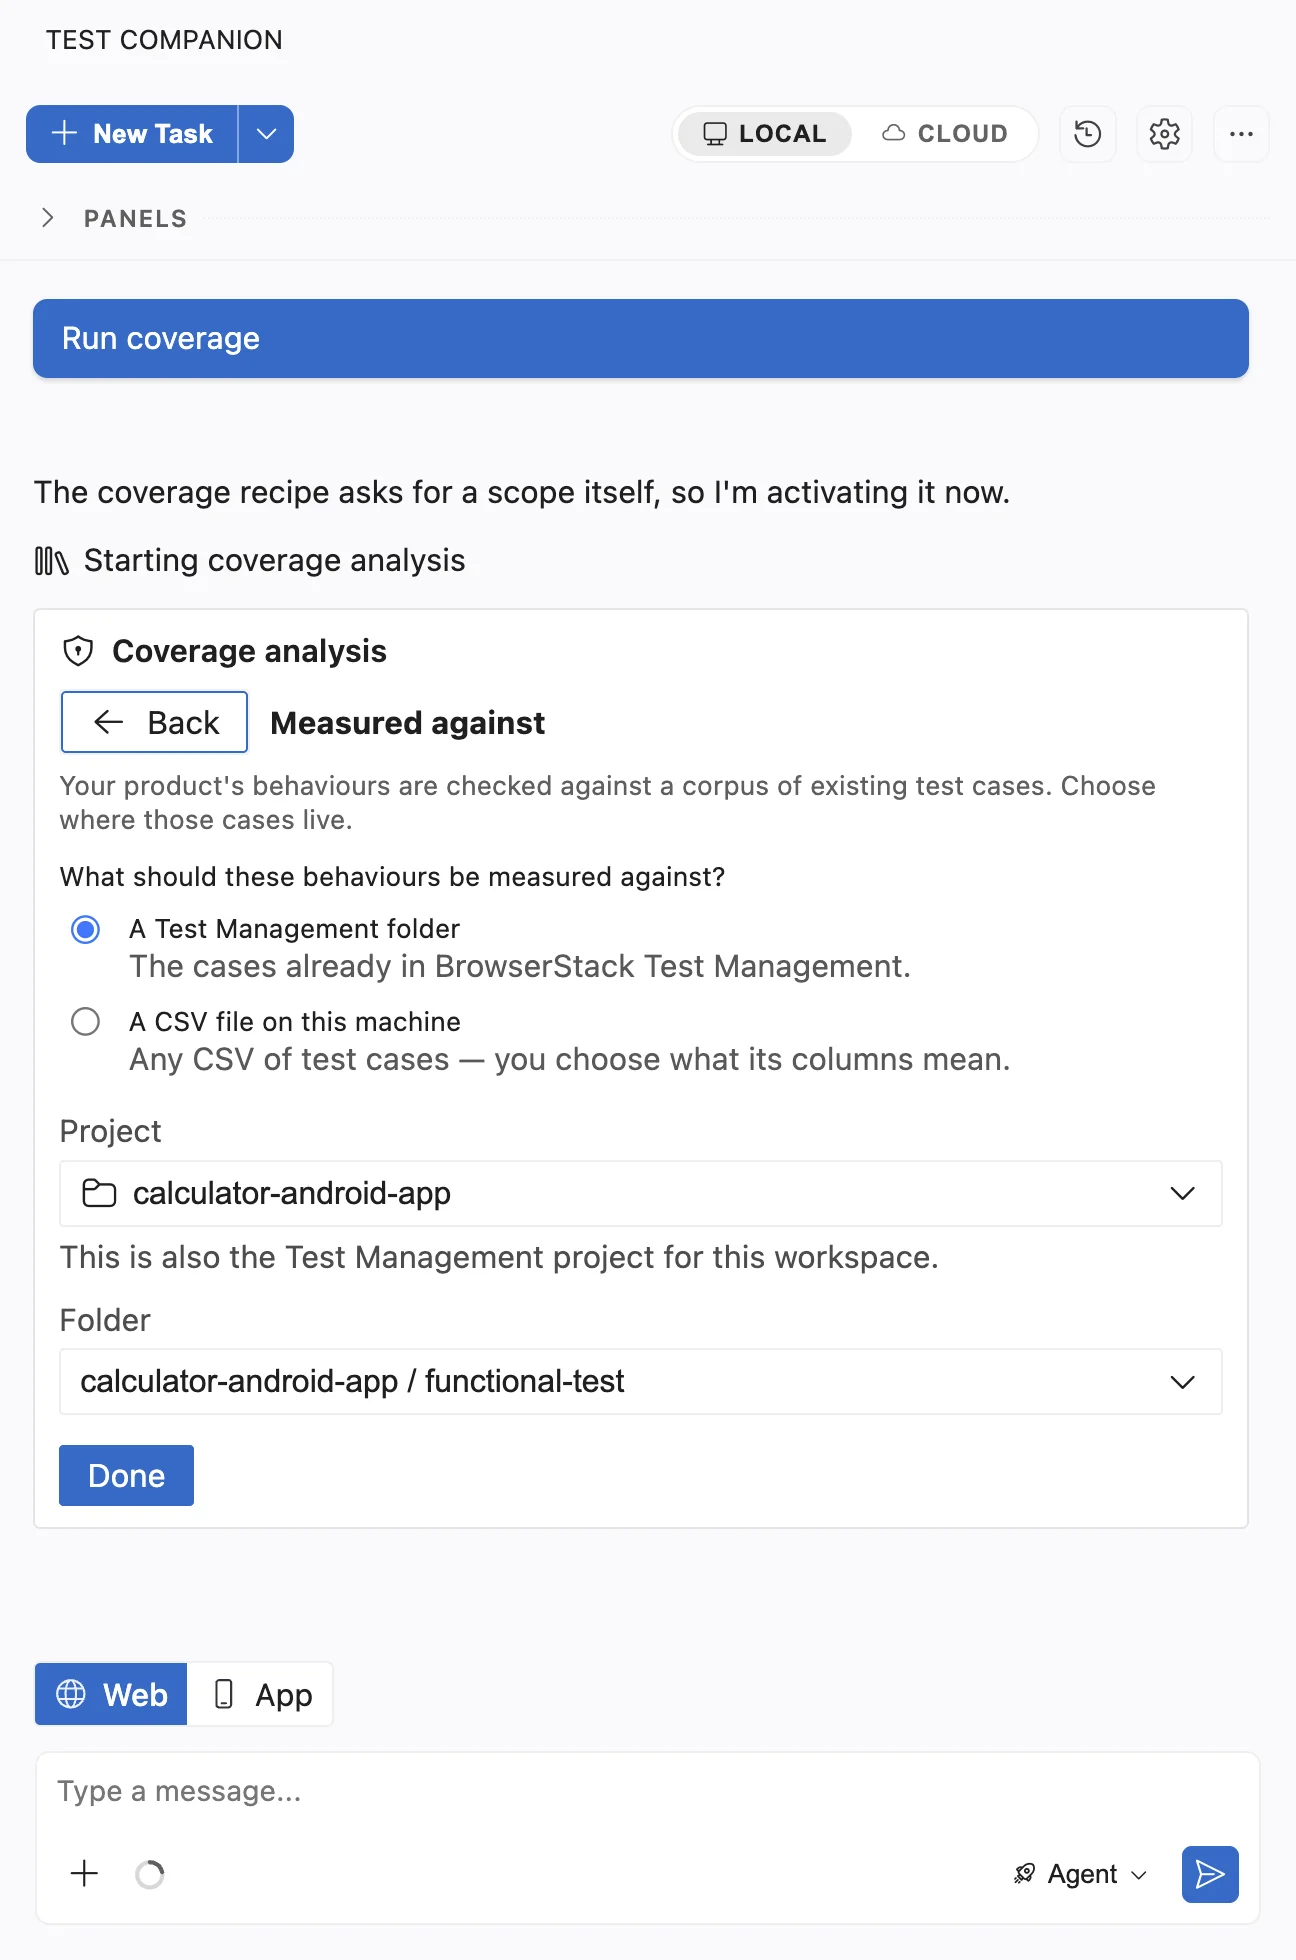
- In the Measured against row, click Choose. Select the location of your test cases:
- A Test Management folder: Select the Project and the Folder.
- A CSV file on this machine: Click Choose a CSV file and select the file. Under Which column holds what?, match each column to a field. Only Title is required. Check the preview rows, then click Use this file.
Click Done.
-
Click Measure coverage. The button turns active after all three rows are filled in.
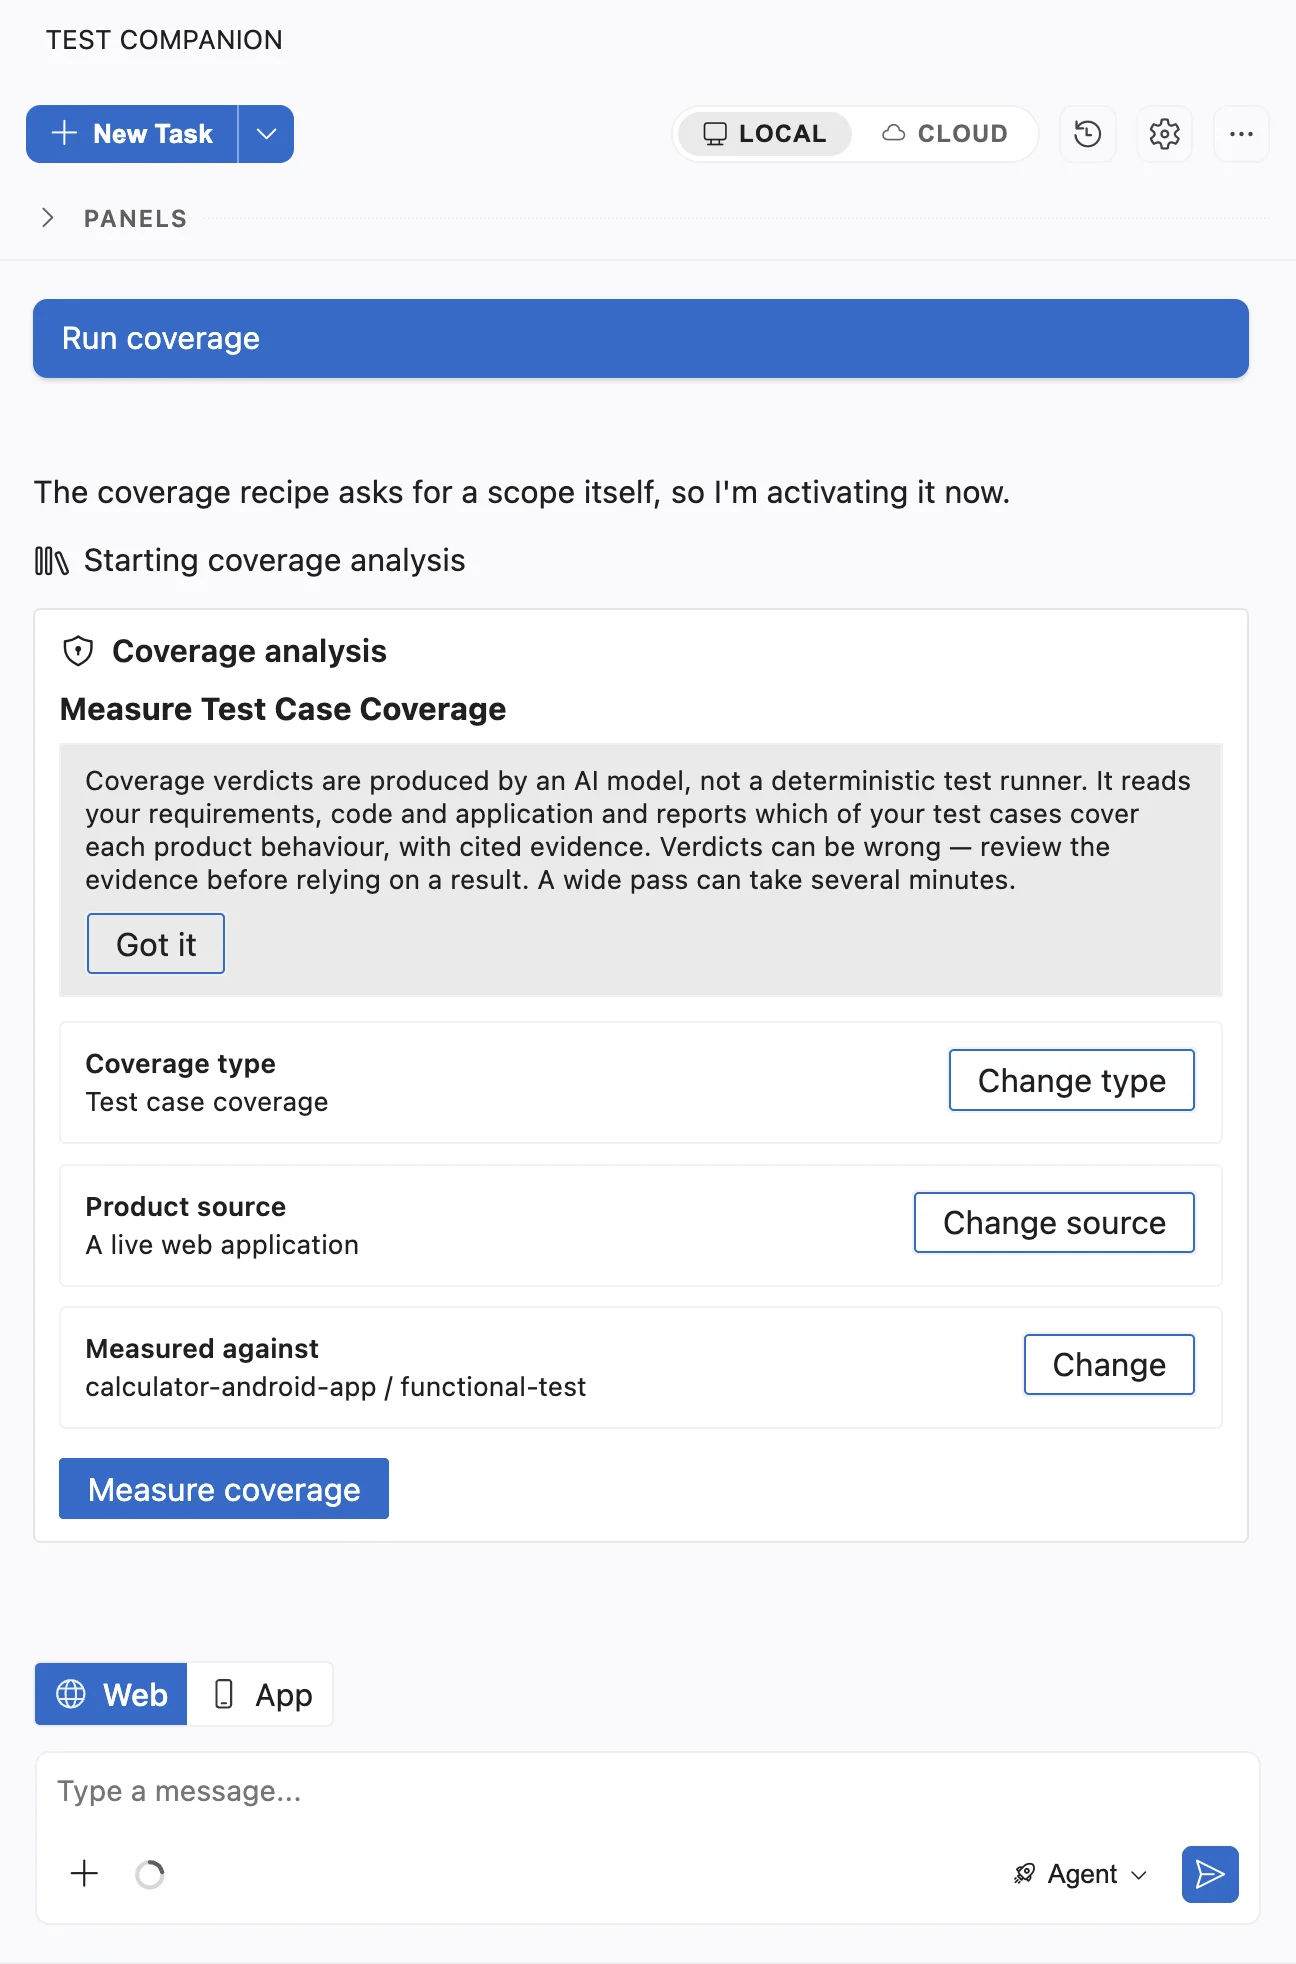
If you chose a new source, Test Companion first reads it and writes down what your product does. The card names the file or command it is reading. This can take a few minutes, and the chat box is locked until it finishes. To stop, click Cancel on the card. A stopped read leaves your earlier behavior list and report unchanged.
Test Companion then checks each behavior against your test cases. The card shows Evaluating test assertions with a running count, and the chat shows Coverage analysis running. When the check completes, the card shows the coverage figure with the Covered and Not covered counts. Below these counts, the card shows how many behaviors could not be determined and how many are excluded. Click View latest report to open the Coverage Analysis tab.
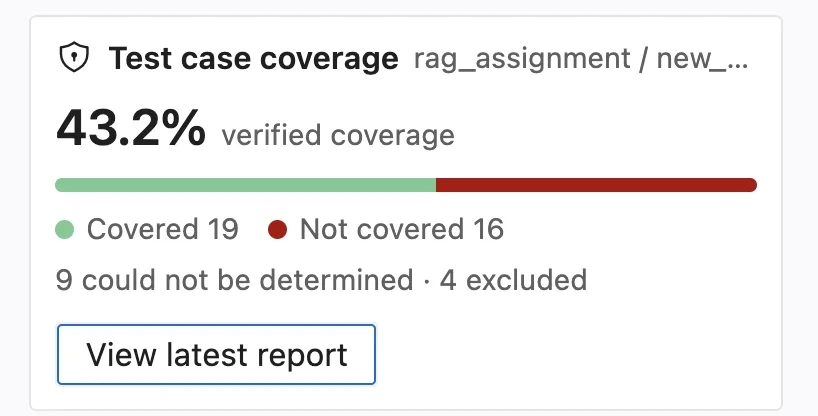
The card keeps the figure from this check. A later change in the report, such as an added test case, updates the report only. The card does not change.
Product sources
Each source needs a different input before the check can start:
| Source | Input |
|---|---|
| A PRD or other document | The file, from the file dialog that opens. |
| This codebase | Nothing. Test Companion reads the open workspace. |
| A Jira ticket | The ticket link. |
| A Confluence page | The page link. |
| A live web application | The application URL. |
After the first analysis in a workspace, the list adds a reuse option. Its label reads Reuse what was explored today, or names the day of that analysis. Select it to keep the earlier behavior list. Test Companion then reads no source.
How the coverage figure is calculated
The figure is the number of covered behaviors divided by the number of counted behaviors. A behavior is counted unless you exclude it.
| Status | Meaning | Effect on the figure |
|---|---|---|
| Covered | Your test cases cover every step of the behavior. Each step cites the test case that covers it. | Counts toward the figure. |
| Partially covered | Your test cases cover some steps of the behavior, but not all of them. | Counts against the figure. |
| Not covered | No test case covers the behavior. | Counts against the figure. |
| Unresolved | Test Companion could not reach a verdict for the behavior. The card calls these behaviors could not be determined. | Counts against the figure. |
| Excluded | You excluded the behavior from the report. | Not counted on either side. |
For example, a report has 12 covered behaviors, 24 not covered behaviors, and 7 excluded behaviors. The figure is 12 divided by 36, or 33.3 percent.
If you stop a check, the report keeps the behaviors judged so far and lists the rest as not measured. If Test Companion loses contact with the AI model during a check, it reports no figure. It does not report a partial result.
Review the report
The Coverage Analysis tab opens with the folder or file name, the figure, and the list of behaviors. Each row shows the status, the behavior title, and the number of cited evidence entries. A line under the ring shows the number of unresolved and excluded behaviors.
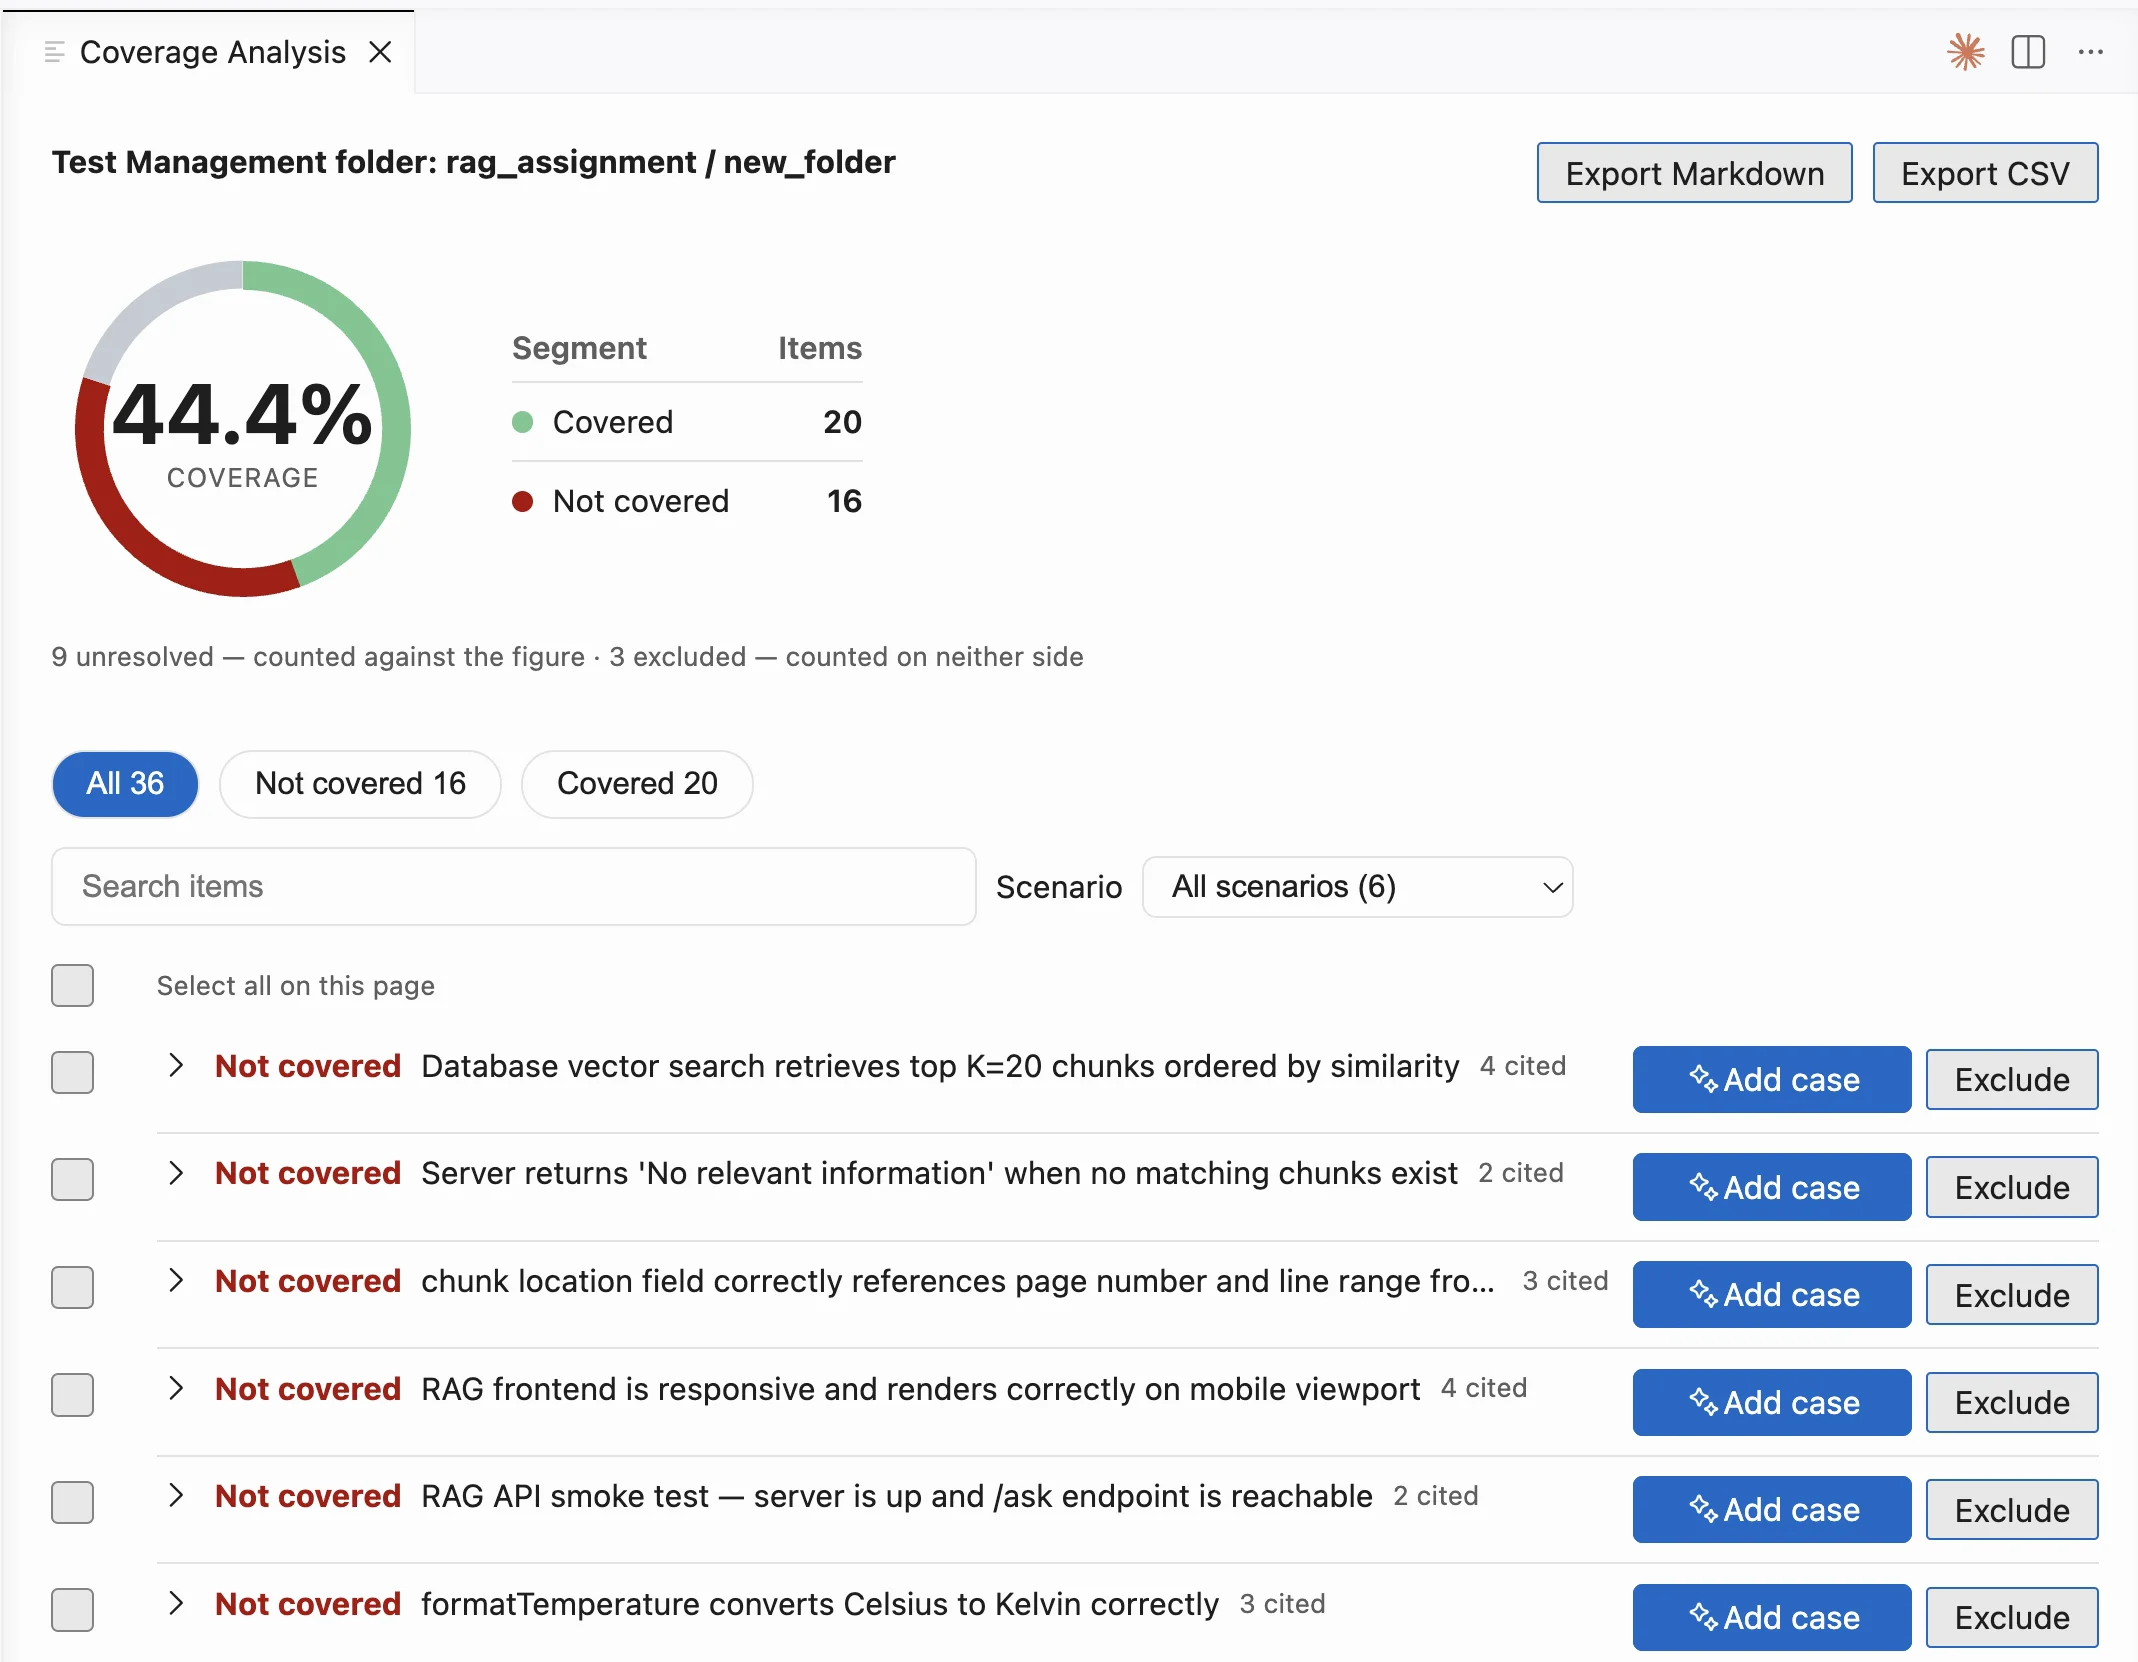
- To narrow the list, click All, Not covered, or Covered. You can also pick a scenario from the Scenario dropdown or type in Search items. A filter changes the list only. The figure stays the same, and the report says so above the list.
- To see why a behavior has its status, click its row. The expanded row shows the behavior description and the steps under Not verified by any test. It also shows the scenario and the Evidence list. A covered behavior cites test case IDs, which open in Test Management. A behavior that is not covered lists each uncovered step as Missing.
- The list shows 30 rows per page. Click Previous and Next to move between pages.
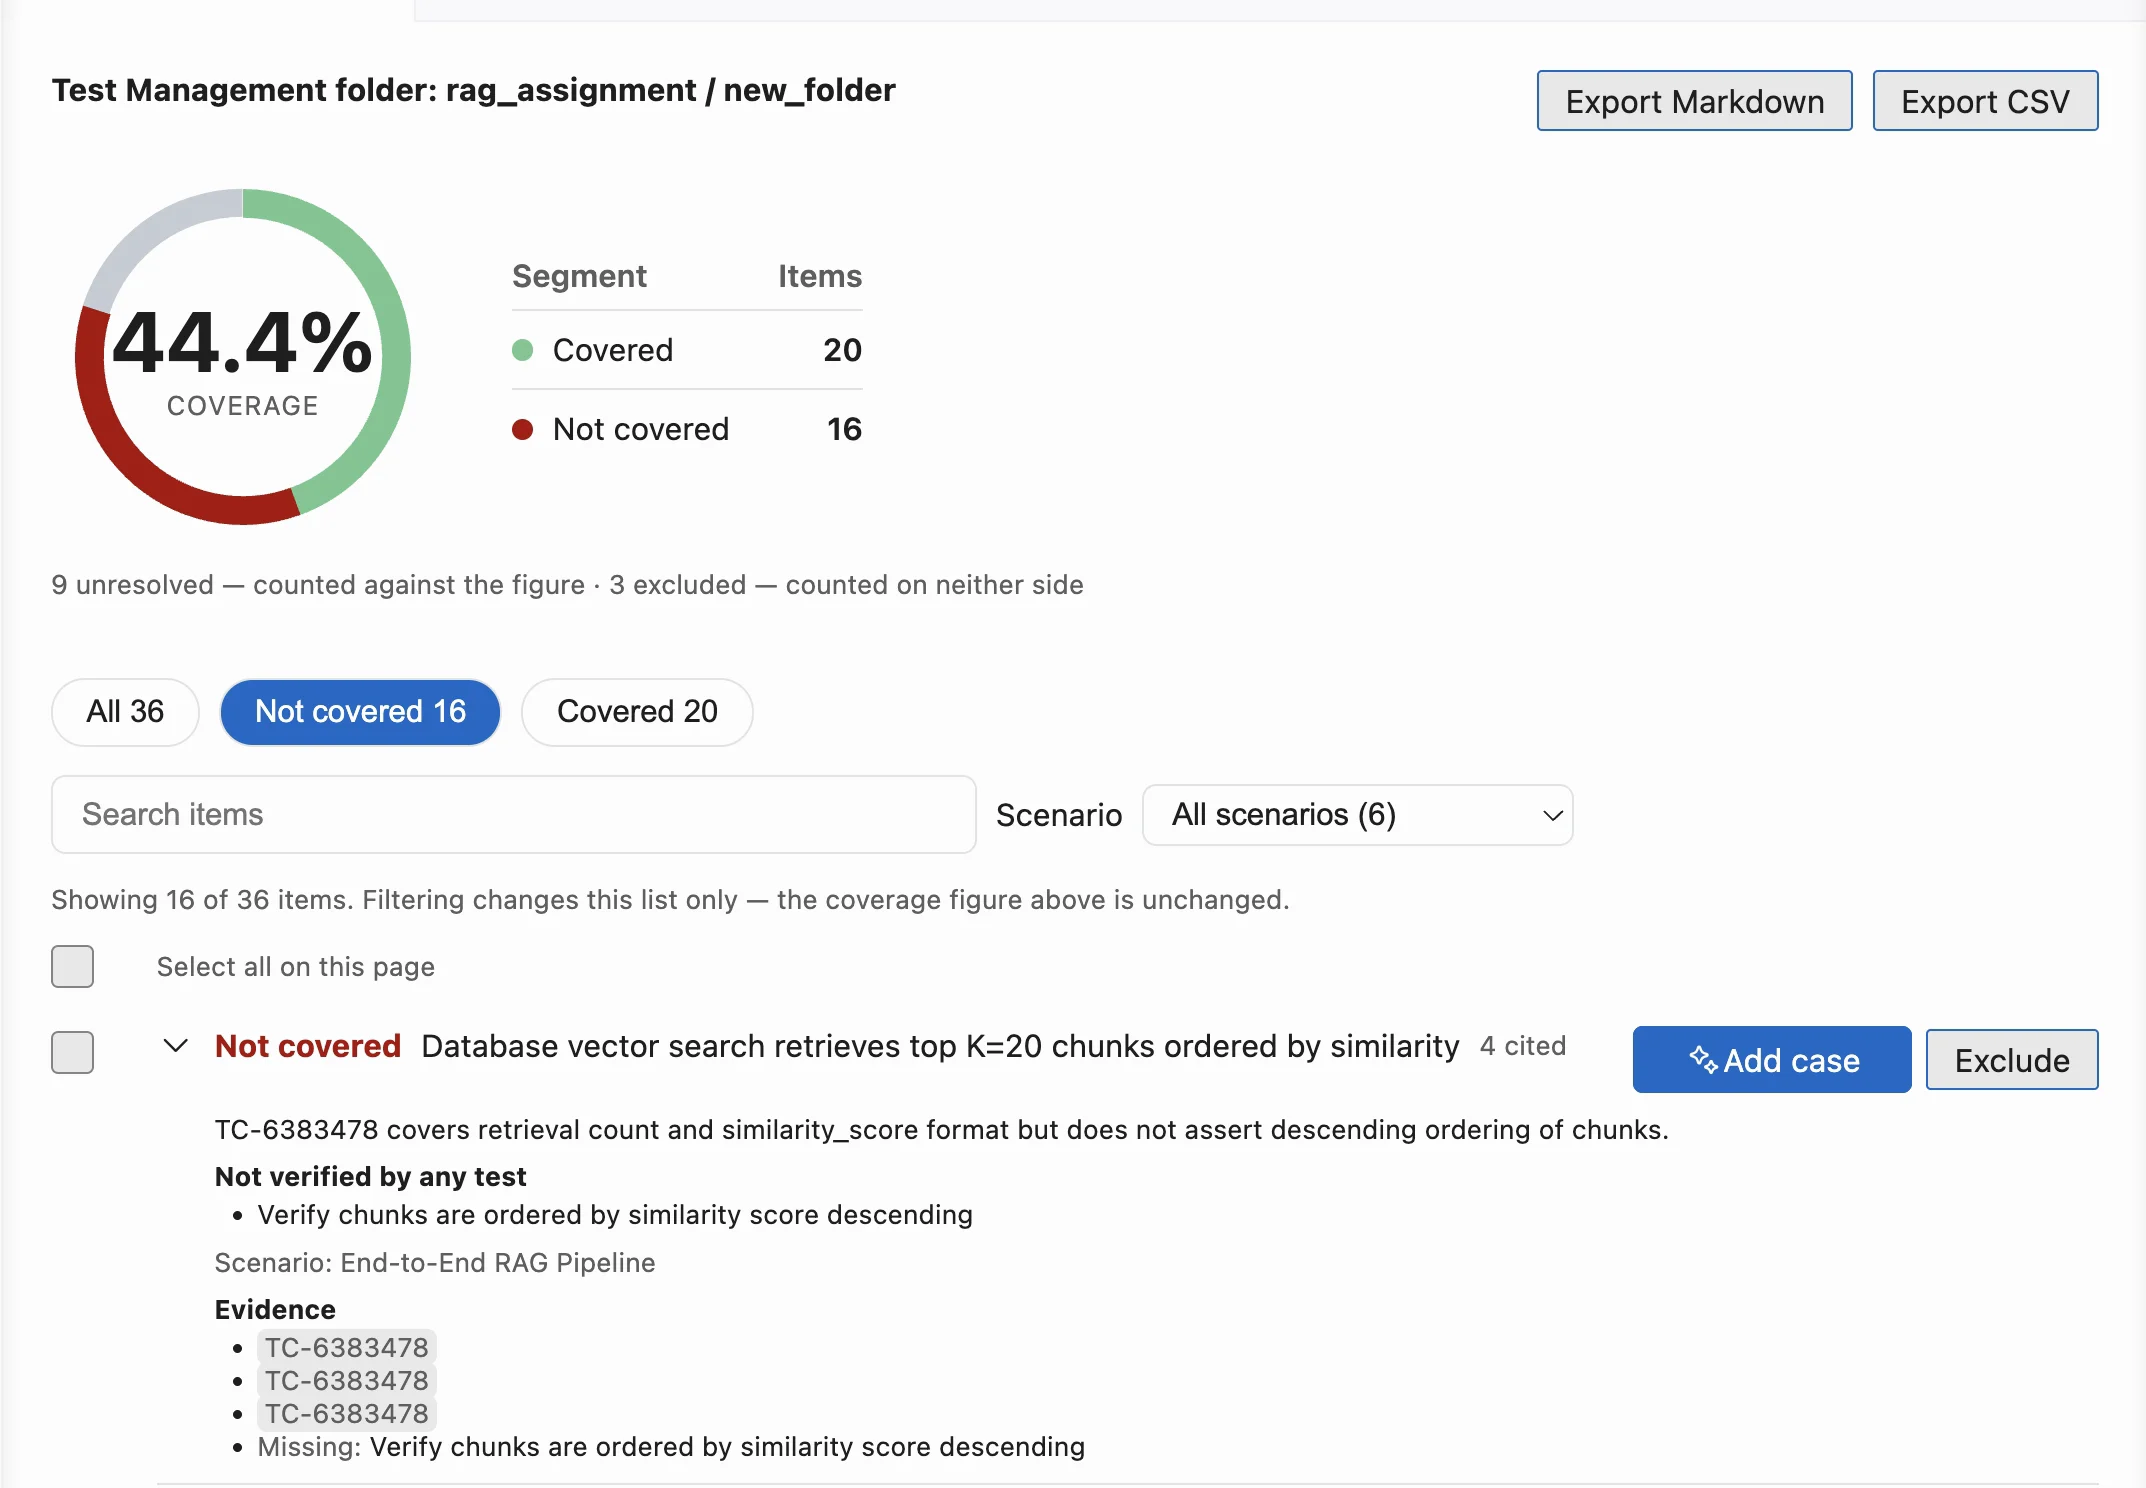
The report stays available after you close the tab or reload Visual Studio Code. To reopen it, click View latest report on the card.
To save the report, click Export Markdown or Export CSV at the top of the tab. Visual Studio Code opens a save dialog with your Downloads folder selected. The file lists each counted behavior by ID with its status, the reason, and the steps that are not covered. Excluded and unresolved behaviors are not in the file.
Add missing test cases
When you measure a Test Management folder, the report can add a test case for a Not covered behavior:
- For one behavior, click Add case in its row.
- For more than one behavior, select their checkboxes. In the bar above the list, click Add to Test Management, which shows the count.
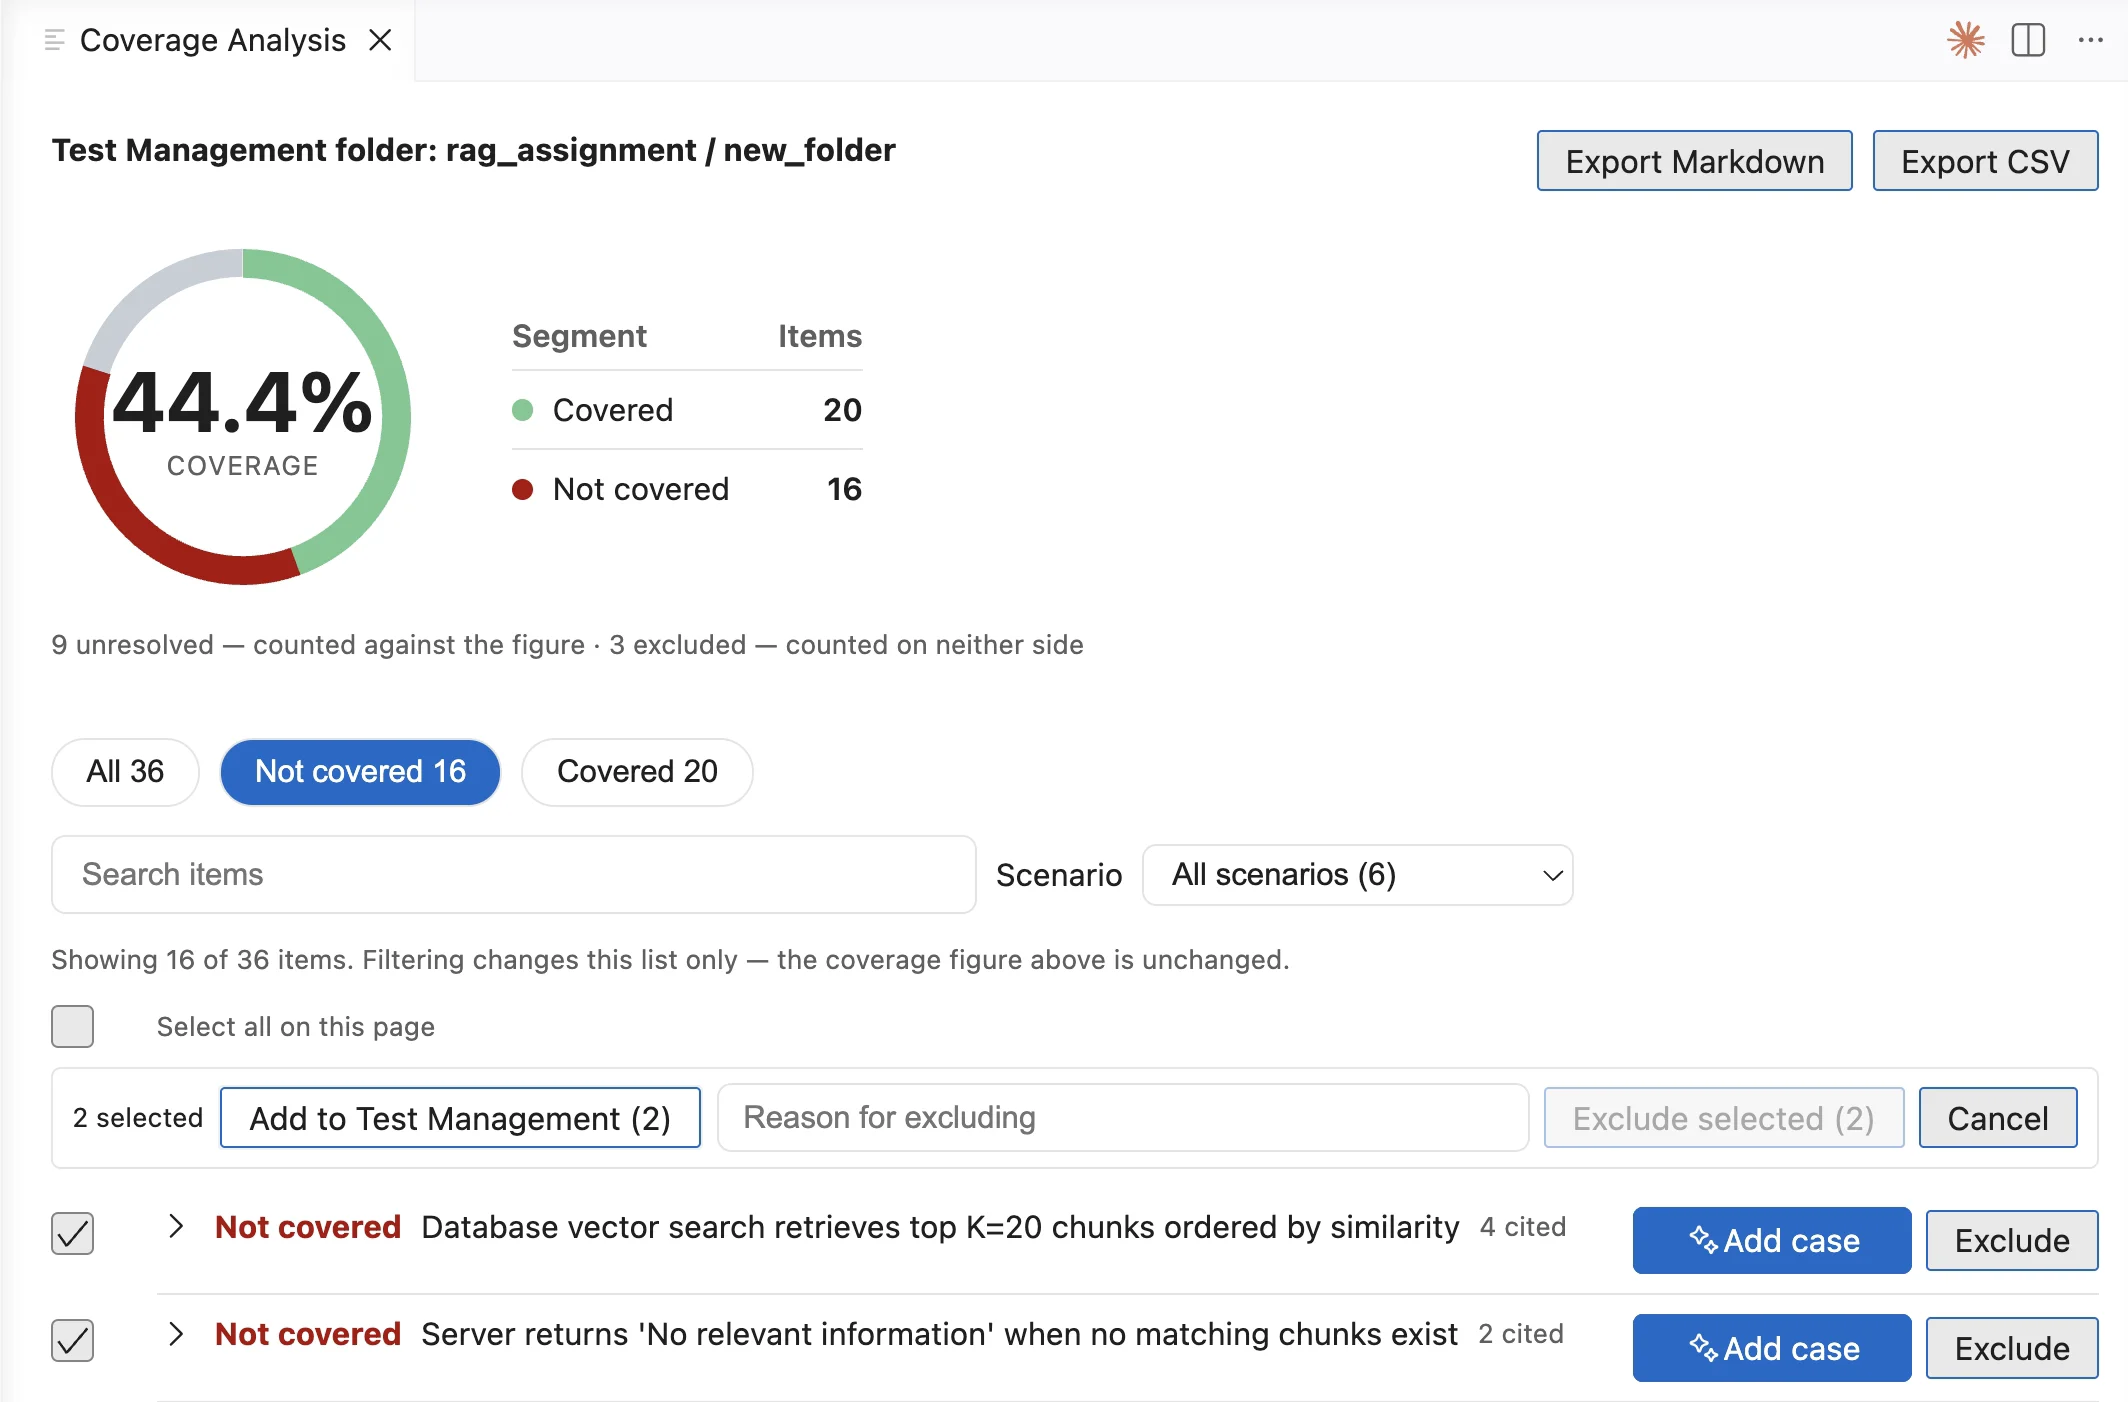
Test Companion creates each test case in the measured folder at once, with no confirmation step. It builds the test case from the behavior title, description, preconditions, and steps. The behavior is marked as Covered with the new test case as its evidence, and the figure updates. No new check runs.
When you measure a CSV file, the report has no add actions. Add the missing test cases in the tool that holds them, export a new CSV file, and measure again.
Exclude a behavior
An excluded behavior counts on neither side of the figure. Exclusion fits a behavior that another tool already tests, or one that you do not plan to test.
- In the row, click Exclude. To exclude more than one behavior, select their checkboxes instead.
- In Reason for excluding, enter a reason. The button stays disabled until you enter one.
- Click Exclude, or Exclude selected with the count when you selected more than one behavior.
The behavior moves to the Excluded Tests list at the end of the report, and the figure updates. To count the behavior again, click Restore in that list.
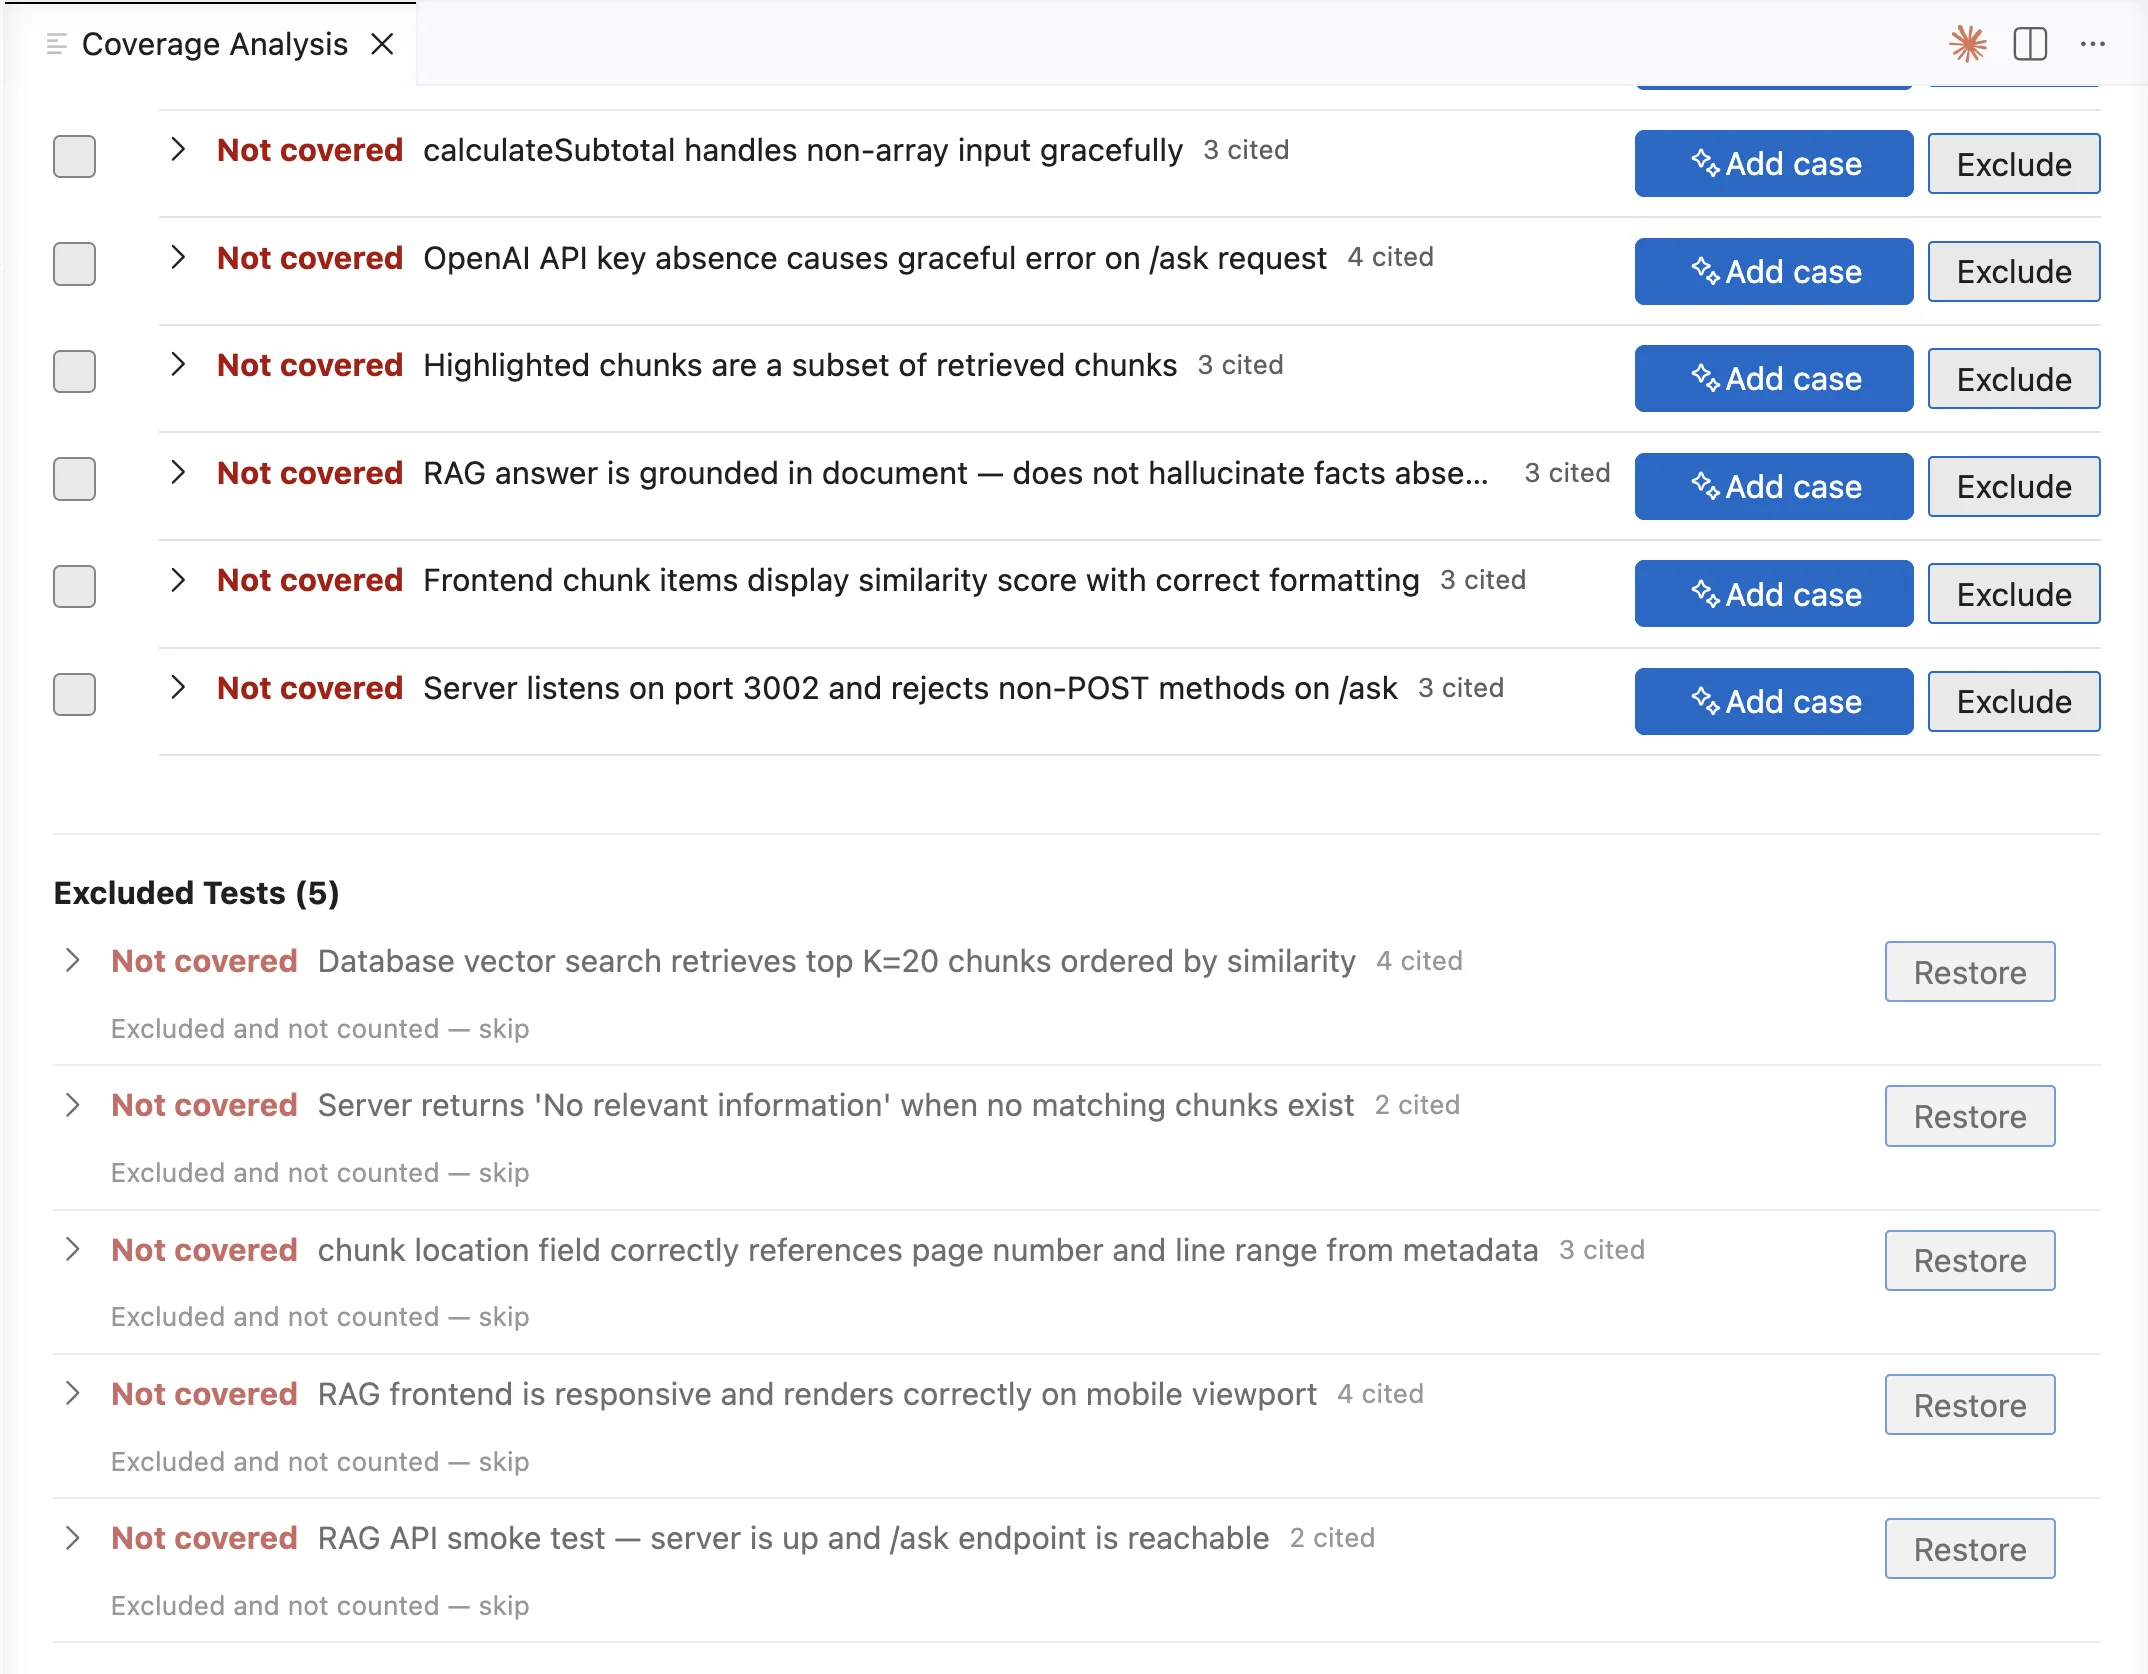
Test Companion saves each exclusion with the reason, your BrowserStack email address, and the date. Exclusions apply to later checks in the same workspace on the same machine. They are not shared across machines.
Where the results are stored
Test Companion keeps the coverage files in a .test-companion folder in your workspace. The folder holds the behavior list, a copy of the measured test cases, the latest report, and your exclusions. It has its own .gitignore file, so Git does not commit it.
When you choose a new source, Test Companion replaces the behavior list and deletes the latest report. A check that fails after a new read leaves no report behind.
Supported inputs
- Test Companion reads up to 500 test cases from a Test Management folder. Cases beyond that limit are not used as evidence, and the report does not say so.
- A CSV file must use commas as delimiters and UTF-8 encoding. It must start with a header row and be no larger than 10 MB.
- Test Companion reads the whole Steps cell of a CSV row as one step.
- Test Companion does not explore a mobile app build to list behaviors. For an app, use a document, a Jira ticket, a Confluence page, or the codebase as the product source.
Next steps
- Generate test cases: Draft new test cases from a document or a website.
- Sync to Test Management: Push test cases to a Test Management project and folder.
- Automate tests: Turn the test cases you added into automation scripts.
We're sorry to hear that. Please share your feedback so we can do better
Contact our Support team for immediate help while we work on improving our docs.
We're continuously improving our docs. We'd love to know what you liked
We're sorry to hear that. Please share your feedback so we can do better
Contact our Support team for immediate help while we work on improving our docs.
We're continuously improving our docs. We'd love to know what you liked
Thank you for your valuable feedback!