
 Join our Discord
Test executions
Track how many automated or manual tests you run over time, and compare the trend across teams, modules, and platforms.
The test executions widget is a line chart of test execution counts over time. It counts every execution, not unique test cases, so a test case that ran ten times adds ten to the count. Test run type sets whether the widget counts automated or manual executions. Use it to check whether your test volume is growing, and to compare teams, modules, or platforms on one chart.
Test run type applies to the whole widget, so one widget counts either automated or manual executions. To compare the two, add the widget twice and set a different Test run type on each.
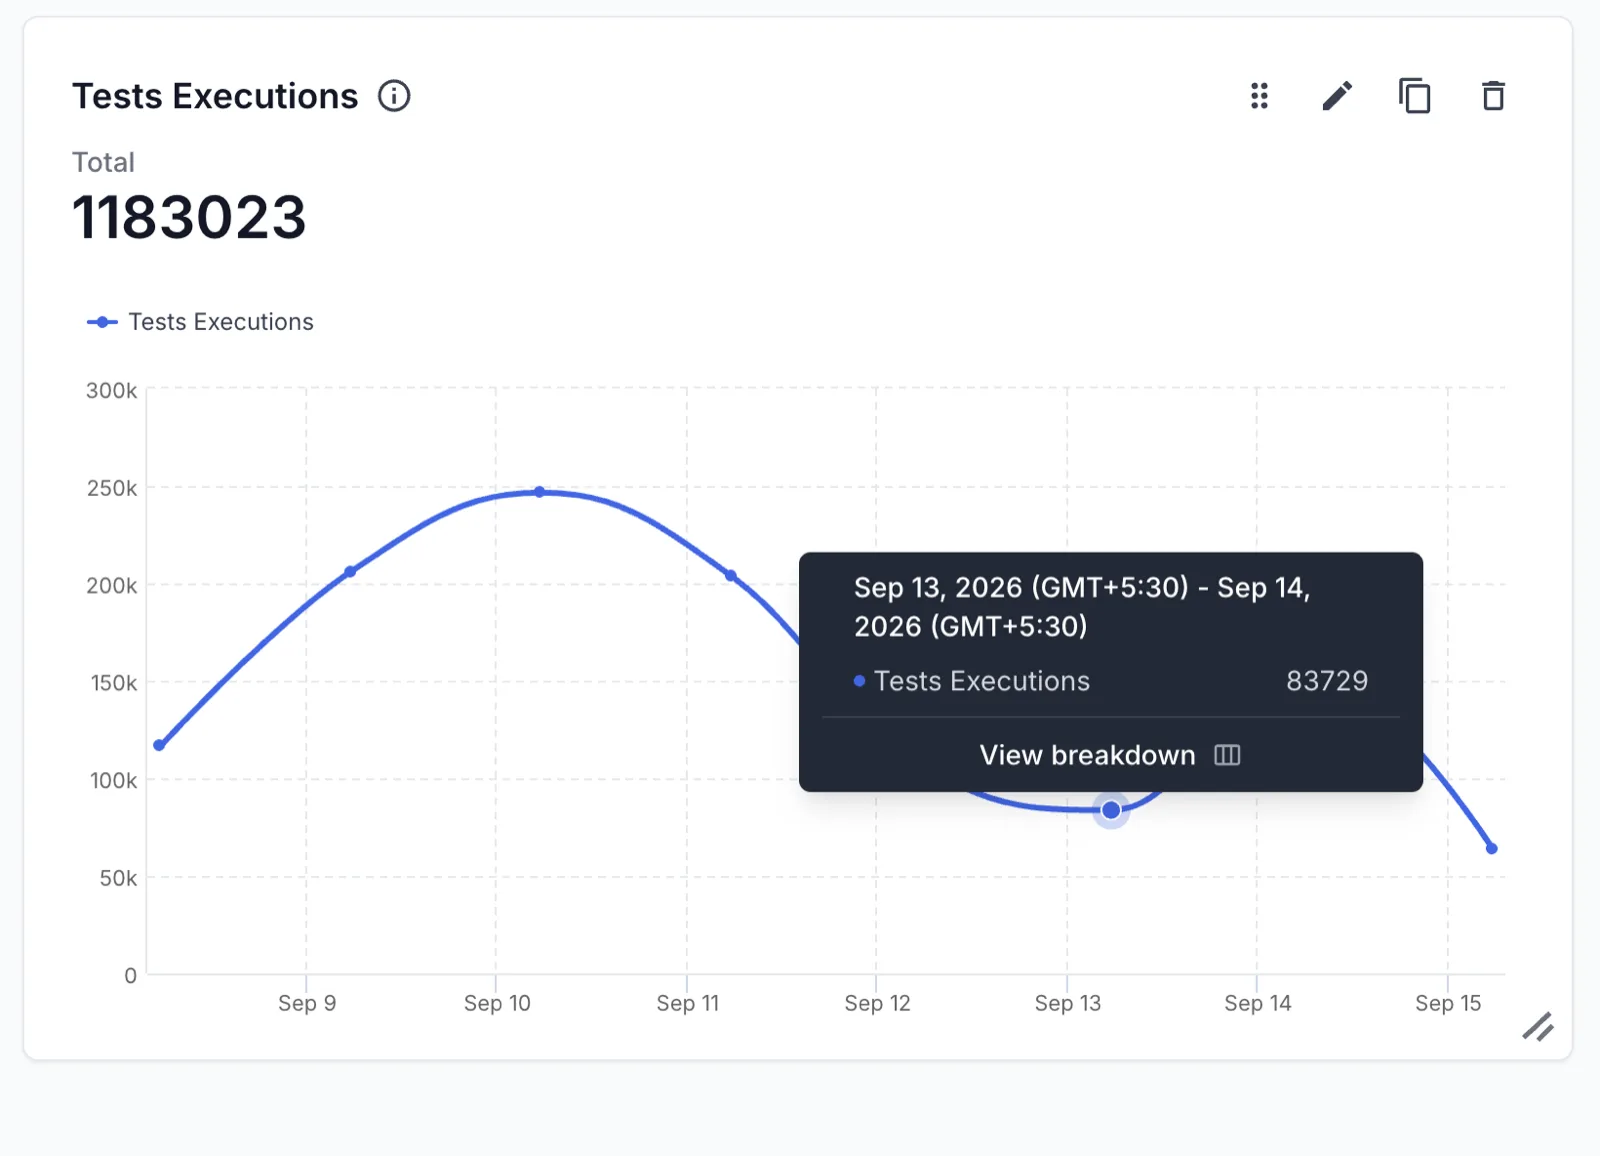
Summary of widget data and visualization
Each line on the chart is one segment. A segment is a named set of filters, such as one team’s projects or one platform. The legend names each segment and gives it a color. The widget gallery lists this widget as Tests Executions.
The X-axis follows the dashboard date range, so the range you pick sets how much time each point covers. A 7D range plots one point per day. A wider range, such as 3M, groups executions into weeks, so a single point covers a longer period.
Key metric information and visualization
The following table describes each element of the chart:
| Element | Details |
|---|---|
| Total | The execution count for the whole dashboard date range. It appears above the chart when Show chart summary is on and the widget has one segment. |
| Legend | Names each segment and gives it a color. When Show planned executions is on, a second line named <segment name> - Planned shows how many test cases were planned for each period. |
| Point | One time period. Hover over a point to read the start and end of the period in your time zone, the segment name, and its execution count. |
| View breakdown | Appears in the tooltip on the dashboard. Opens the project-wise breakdown for that point. |
| Info icon | Shows the widget description next to the widget title. When you have not added a description, it shows the default text Observe the trend of total tests executed over time.
|
Add the widget
Follow these steps to add the widget to a dashboard:
-
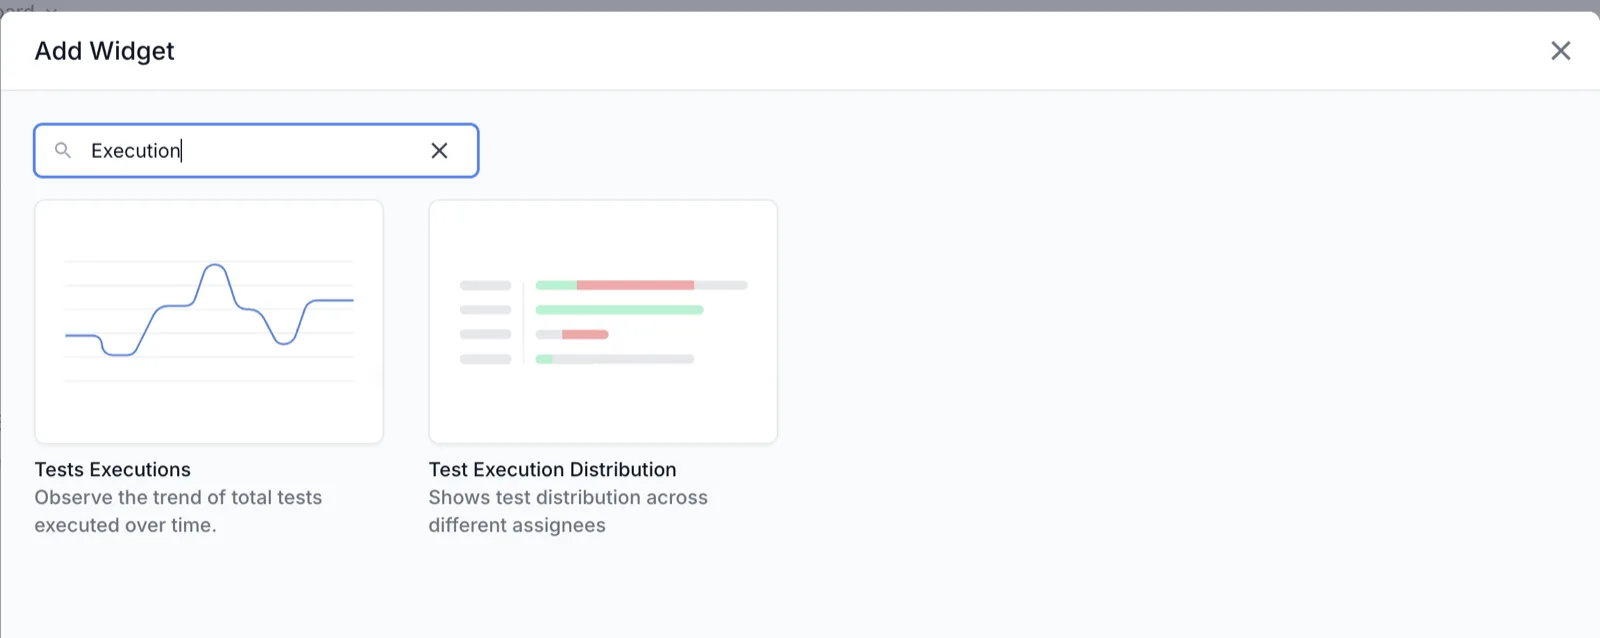
Open a dashboard and select Tests Executions from the widget gallery. The widget dialog opens with a live preview.
- Enter a Widget name. To add a note for readers, click Add a description and enter up to 200 characters.
- Under Test run type, select Automated or Manual.
- Turn on the Show chart summary toggle to show the total count for the chart.
- Under Segments, enter a Segment name and add the filters for that line. Click Add segment for each extra line you want to compare.
- Check the preview, then click Save.
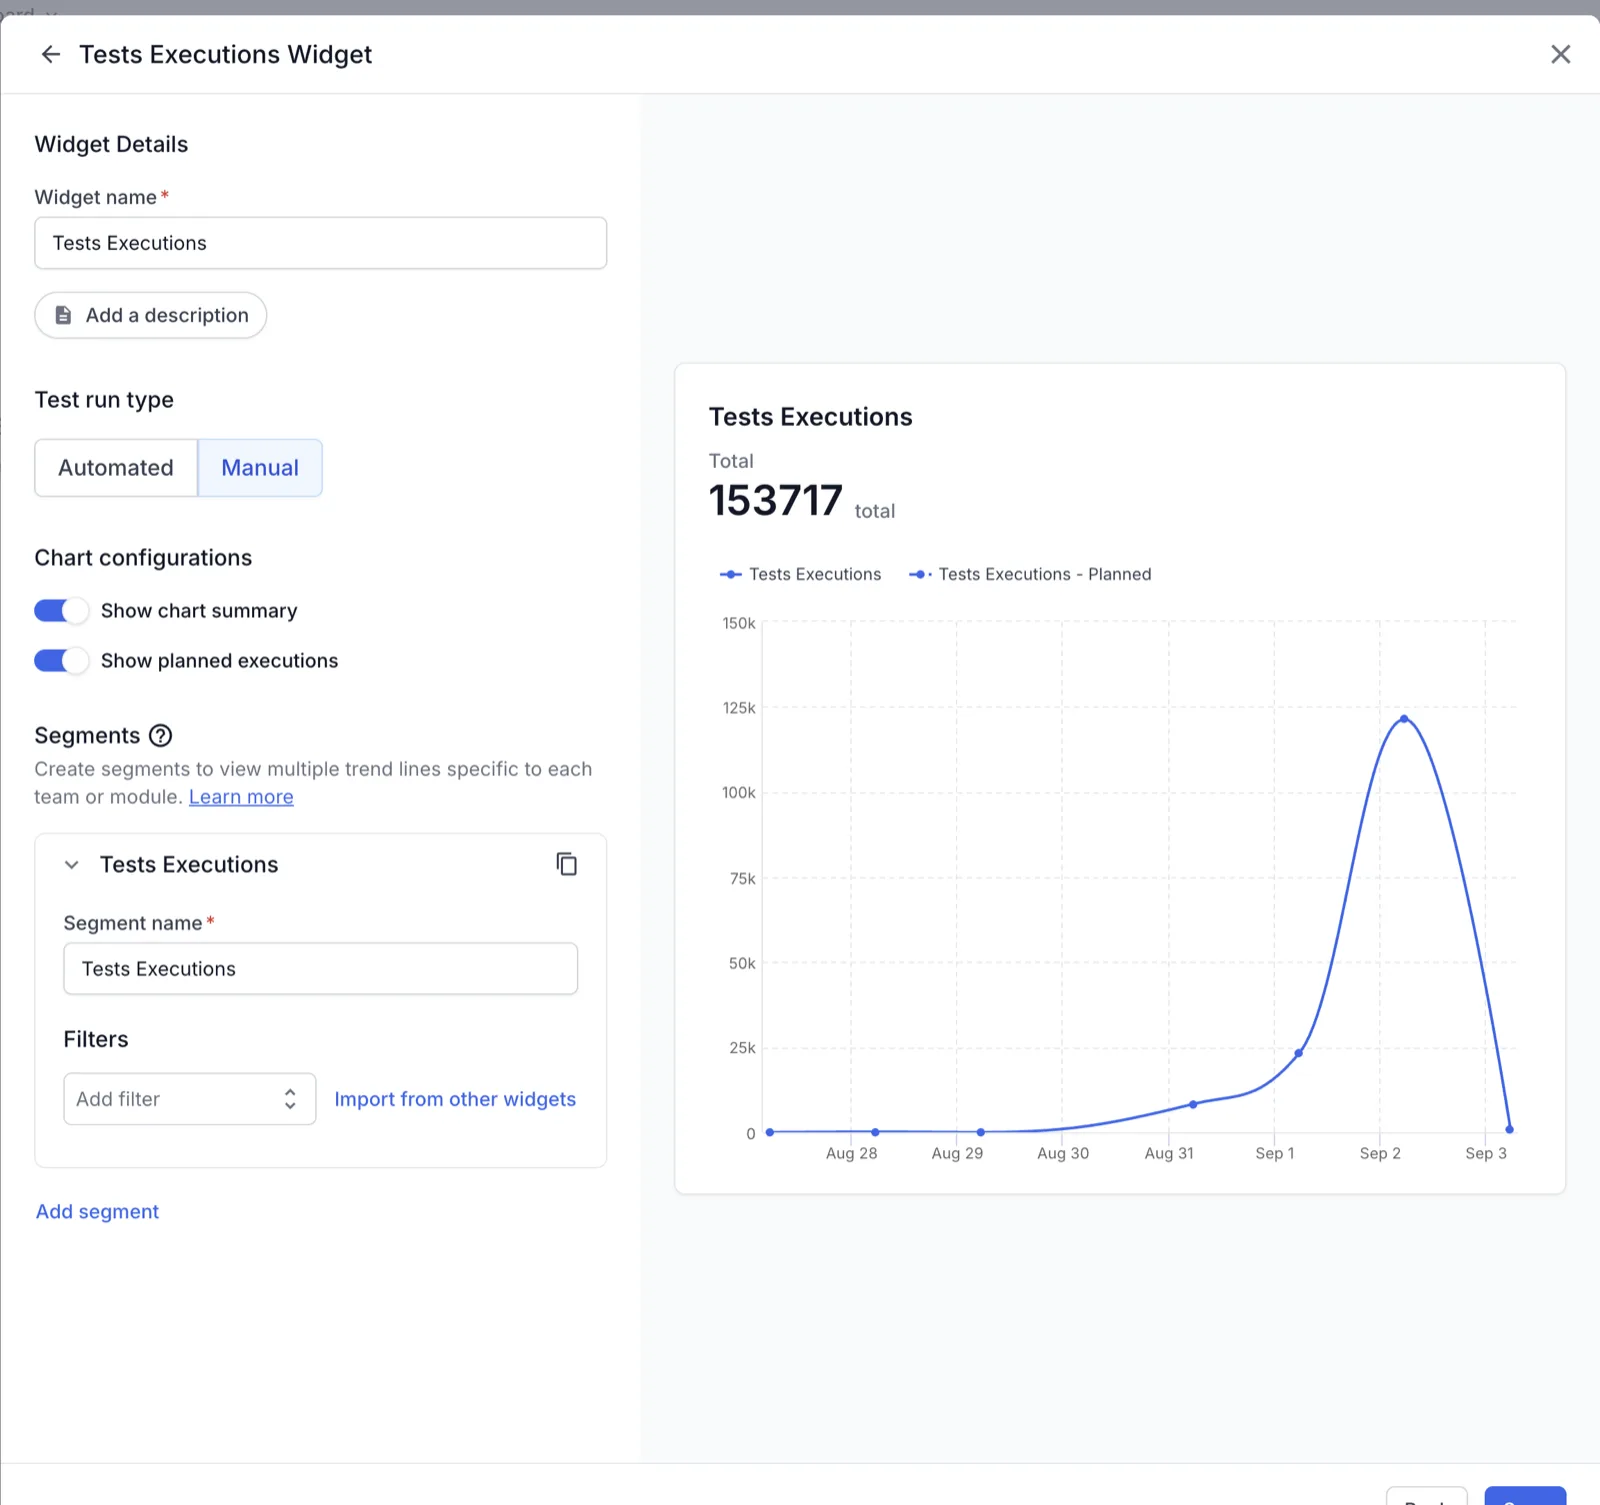
The following table describes each option in the widget dialog:
| Option | Details |
|---|---|
| Widget name | Required. Defaults to Tests Executions. Names the widget on the dashboard. |
| Add a description | Optional note of up to 200 characters. Readers see it on the info icon next to the widget title. |
| Test run type | Sets whether the widget counts automated or manual executions. Automated by default. Changing it resets segments and filters. |
| Show chart summary | Shows the Total for the chart. On by default. Turns off when the widget has more than one segment. |
| Show planned executions | Adds a line for the planned execution timeline of every segment. Available under Manual only, and off by default. Shows a line only for test cases that carry a Planned Execution Date. |
| Segment name | Required for every segment. Labels the line in the legend. |
Test run type
Test run type sets what the widget counts. The setting applies to every segment in the widget, and Automated is the default. The following table shows what each type covers:
| Test run type | Executions counted | Extra controls |
|---|---|---|
| Automated | Executions reported by automated test runs. This is the default. | None. |
| Manual | Executions recorded against manual test runs. | Show planned executions, which plots the planned execution dates set on the test cases. |
Switching Test run type resets the widget to a single segment and clears every filter, because each type carries its own filter list. Set the type before you build your segments.
Planned executions for manual runs
Show planned executions adds a line for the planned execution timeline of every segment. The toggle applies to manual runs only, and it is off by default. The line is named <segment name> - Planned in the legend.
A planned execution is a test case in a manual test run that carries a Planned Execution Date. To see this line, you must set that date on the test cases in your test runs. The widget then plots how many test cases were planned for each period. When no test case carries a date, the toggle adds nothing to the chart.
To set the date, open a manual test run, select the test cases, and click Add execution details. In the dialog, pick the Planned Execution Date and click Save. The full procedure is in Add execution details.
Segments
Segments are how you compare teams, modules, or platforms inside a single widget. Each segment is one line on the chart, and each carries its own filters. Every segment needs a Segment name, because that name labels the line in the legend.
Use the following controls on a segment card:
- Click Add segment to add a line.
- Click the copy icon to duplicate a segment with its filters.
- Click the delete icon to remove a segment. The icon appears only when the widget has more than one segment.
A widget holds up to five segments. From the second segment onwards, the widget warns that more segments can reduce the readability of the data, and Show chart summary turns off because the Total applies to a single line.
Available filters
Filters apply per segment, so two lines on the same chart can cover different data. No filter applies until you add one. To add a filter, click Add filter, select a field, then pick the values you want. After you add the first filter, Clear filters appears next to Filters. Click it to remove every filter on that segment.
Some filters have a match operator next to the filter name. It sets how the values you select combine. The default, Matches any one value (OR), counts an execution when it matches any selected value. When a filter also offers Matches all values (AND), that option counts an execution only when it matches every selected value.
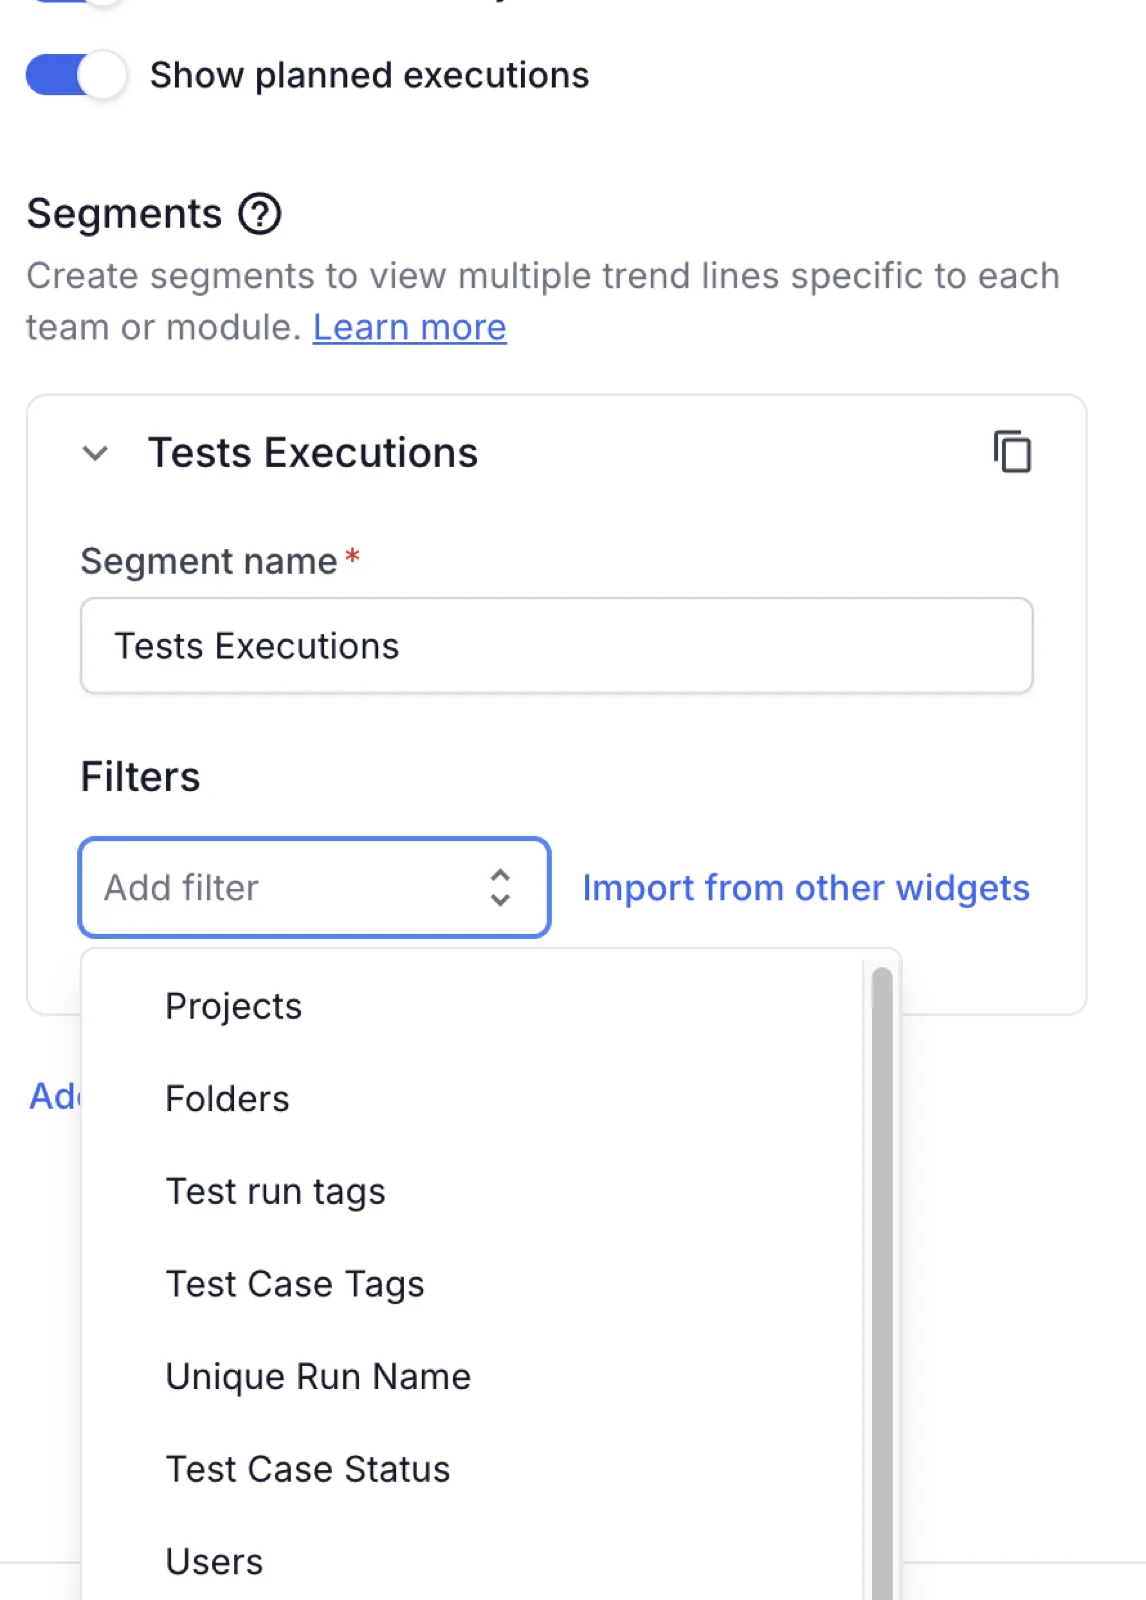
To reuse a filter set from another widget on the same dashboard, click Import from other widgets. The filter list depends on the Test run type you selected.
Filters for automated test runs
Apply the following filters when Test run type is set to Automated:
| Filter | Details |
|---|---|
| Projects | The projects the test runs belong to. |
| Unique Run Name | A named test run. |
| Users | The users who triggered the test runs the tests belong to. |
| Last executed by | The user who last set the test result. When someone adds a manual result to a test, that user becomes its last executor. |
| Teams | The teams of the users who triggered the test runs. |
| Test run tags | The tags applied to the test runs. |
| Test tags | The tags applied to the tests. |
| Hooks Visibility | Which hooks count toward the test count. See visibility of hooks and tests. |
| Host names | The hosts that ran the tests. |
| Folder names | The folders in your test repository. Use it to identify modules. |
| Include muted tests | Whether muted tests count toward the chart. |
| Include re-run attempts | Whether re-run attempts count toward the chart. |
| CI runs only | Only the runs a CI pipeline triggered. |
| Branch | The code branch the tests ran against. |
| Device | The devices the tests ran on. |
| OS | The operating systems the tests ran on. |
| Browser | The browsers the tests ran on. |
| Failure Categories | The failure categories assigned to the failed tests. |
The list also carries a Custom fields group for the custom fields defined in your projects.
Filters for manual test runs
Apply the following filters when Test run type is set to Manual:
| Filter | Details |
|---|---|
| Projects | The projects the test runs belong to. |
| Folders | The test case folders that hold the executed test cases. |
| Test run tags | The tags applied to the test runs. |
| Test Case Tags | The tags applied to the test cases. |
| Unique Run Name | A named test run. |
| Test Case Status | The execution statuses to include, such as Passed, Failed, or Untested. |
| Users | The users who ran the test cases. |
| Last executed by | The user who last updated the test result. |
Drill down for more information
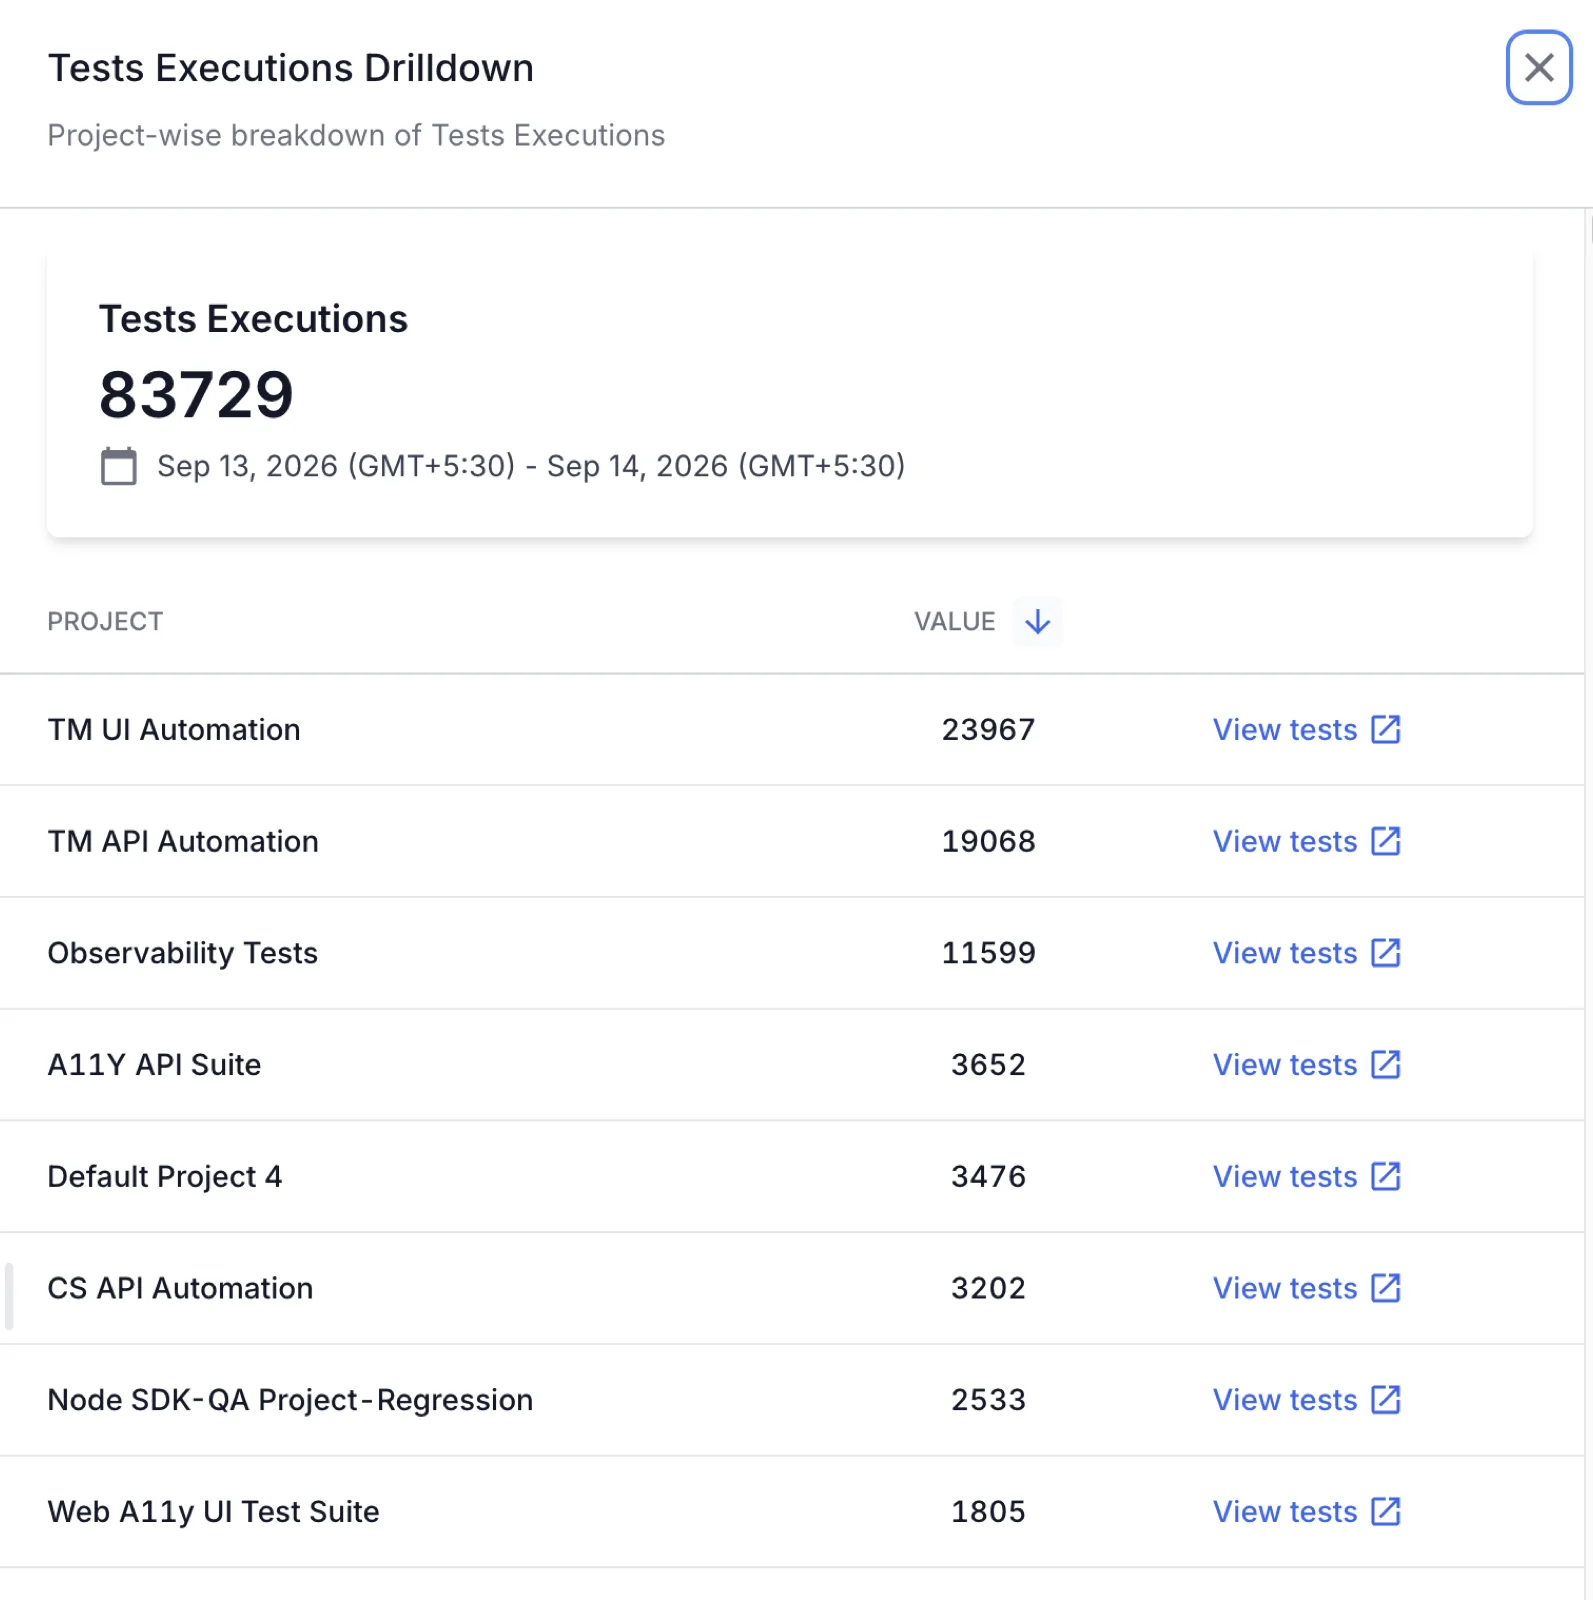
The chart tells you how many tests ran. The breakdown pane tells you which projects those executions belong to. Follow these steps:
- On the dashboard, hover over a point on the chart.
- Click View breakdown. The Tests Executions Drilldown pane opens.
- Read the segment name, the execution count, and the period at the top of the pane.
- Read the Project table. Each row is one project with its execution count for that period, sorted from the highest count down.
- Click View tests next to a project. That project’s test list opens in a new tab, filtered to the same period.
Interpreting test data
A rising line can mean wider coverage. It can also mean the same tests running more often. Use the following patterns to tell the two apart:
| Pattern | Likely cause | Action |
|---|---|---|
| A drop to near zero across one or more points | Almost nothing reported in that period, such as a paused pipeline or a release freeze | Hover the low point, click View breakdown, and check which projects stopped reporting. |
| One segment flat at zero while the others move | The segment’s filters match no executions | Open the segment and widen or clear its filters. |
| A single tall spike | A full-suite run or a batch of re-run attempts landed in one point | Drill into the spike and compare its project counts against a normal point. |
| The planned line sits above the completed line | Manual execution is behind the plan for that period | Open test execution distribution to see who is carrying the remaining work. |
| Volume rising while your test case count stays flat | The same tests running more often, so coverage has not grown | Read trend of test cases before you report coverage growth. |
Next steps
- Test execution distribution splits execution work by the person who owns or ran it.
- Automation coverage widget shows how much of your suite is automated.
- Trend of test cases separates growth in coverage from growth in volume.
- Test Executions widget in custom dashboards covers the same widget on a Test Reporting & Analytics dashboard.
- Test Management-specific dashboard widgets lists every widget you can add.
We're sorry to hear that. Please share your feedback so we can do better
Contact our Support team for immediate help while we work on improving our docs.
We're continuously improving our docs. We'd love to know what you liked
We're sorry to hear that. Please share your feedback so we can do better
Contact our Support team for immediate help while we work on improving our docs.
We're continuously improving our docs. We'd love to know what you liked
Thank you for your valuable feedback!