Debugging is crucial for reliable and accurate automated testing. Protractor, used for testing Angular applications, can present challenges when diagnosing issues in Selenium-based test suites.
Overview
Debugging Protractor tests is essential to identify and fix common failures that can disrupt test stability and accuracy.
Types of Failures You Need To Debug In Protractor Tests
- Expectation Failure: Happens when the actual application behavior does not match the expected value in assertions.
- WebDriver Failure: Occurs when WebDriver cannot locate or interact with an element on the page.
- WebDriver Unexpected Failure: Results from unexpected issues like browser crashes or driver communication errors.
- Protractor Angular Failure: Arises when Protractor fails to detect or synchronize with the Angular application.
- Protractor Timeout Failure: Triggered when an operation takes longer than the configured timeout limit.
Some popular methods to debug in Protractor include:
- Using console.log()
- Debugging protractor tests in chrome inspector
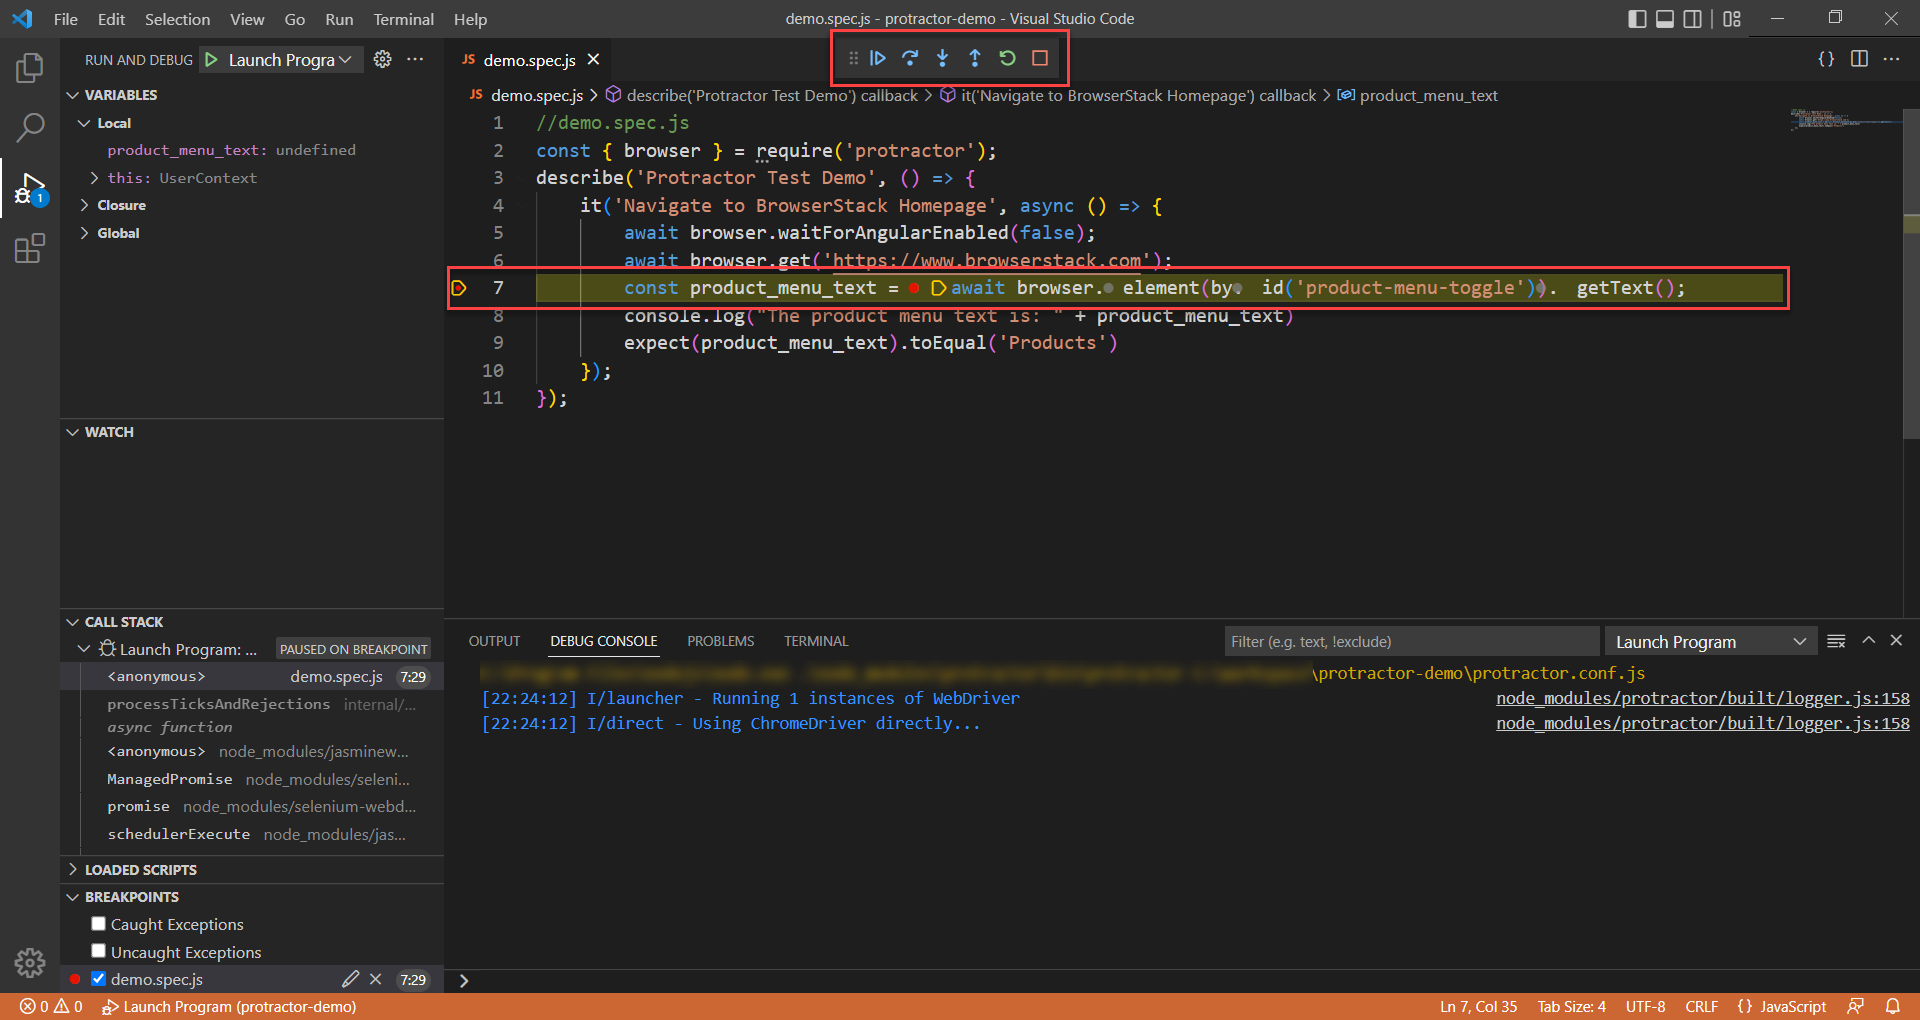
- Debug Protractor tests using Visual Studio Code
- Debug protractor tests taking screenshots dynamically
This article covers common problems when debugging Protractor tests, types of test failures, the importance of debugging, and effective ways to debug Protractor Selenium tests.
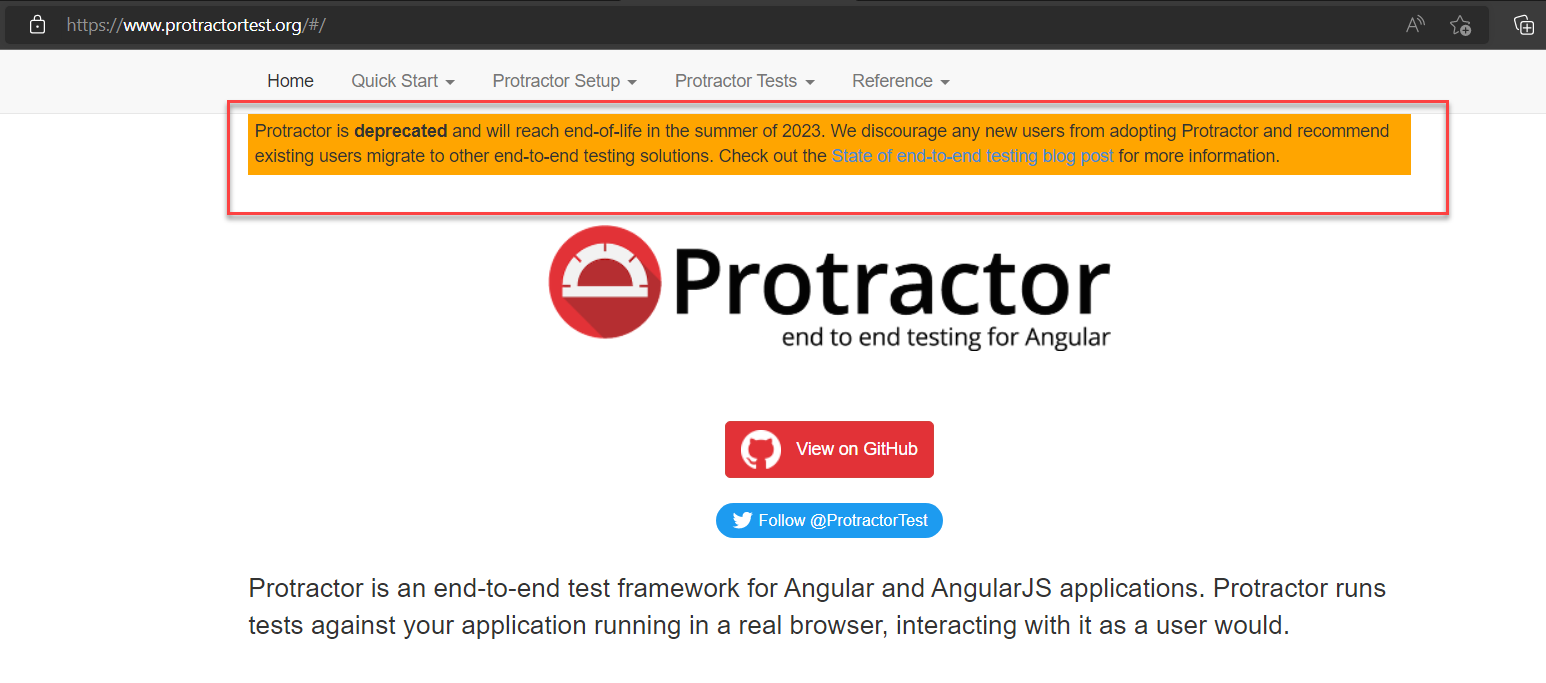
Note: Protractor was officially deprecated on August 31, 2023, and is no longer recommended for new test automation projects. Consider exploring the Modern Alternatives to Protractor.
Importance of Debugging Protractor Tests
Protractor tests can sometimes be flaky or fail due to synchronization issues, timeouts, or unexpected UI changes. Here’s why debugging Protractor tests is a critical part of maintaining a reliable test suite:
- Helps identify the root cause of test failures quickly and accurately.
- Reduces false positives and negatives, improving test reliability.
- Minimizes time spent on maintaining or rerunning flaky tests.
- Ensures end-to-end tests reflect actual user behavior and app functionality.
- Supports stable CI/CD pipelines by preventing unexpected test breakdowns.
- Improves overall test coverage and automation quality.
Common Problems When Debugging Protractor Tests
Debugging Protractor tests can be challenging due to various issues during test execution. Some of the most common problems include:
- Flaky Tests: Tests that pass or fail inconsistently due to timing issues, asynchronous behavior, or unstable environments.
- Synchronization Issues: Protractor may fail to wait for Angular to stabilize before executing the next command.
- Element Not Found Errors: Occur when selectors are incorrect or elements take time to load and aren’t present when the test runs.
- Timeout Errors: Happen when an element or condition isn’t met within the configured wait time.
- Stale Element Reference: Happens when the DOM updates and the referenced element is no longer valid.
- Browser Compatibility Issues: Tests might behave differently across browsers if not handled properly.
- Improper Use of Waits: Using static waits (browser.sleep) instead of dynamic waits can lead to test instability.
- Environment-Specific Failures: Tests may pass locally but fail in CI due to differences in configuration, data, or performance.
Types Of Failures You Need To Debug In Protractor Tests
When running Protractor tests, you may encounter different types of failures. Each failure type points to a specific issue in your test setup, application behavior, or test environment. Understanding these categories helps streamline your debugging process.
1. Expectation Failure
Expectation failures happen when the actual result of your application does not match the expected result defined in your test assertions. This often occurs due to incorrect assumptions, data mismatches, or UI changes.
How to debug:
- Cross-check expected values against the current application state.
- Log the actual values during runtime for validation.
- Confirm that the elements or data are loaded before assertions are evaluated.
2. WebDriver Unexpected Failure
These failures originate from the underlying WebDriver and are often unpredictable. They may be caused by browser crashes, session timeouts, or infrastructure-level disruptions.
How to debug:
- Investigate browser and system logs for crash details.
- Ensure browser and WebDriver versions are compatible.
- Re-run tests in different environments or browsers to identify patterns.
3. WebDriver Failure
This type of failure occurs when WebDriver cannot locate or interact with a page element. Common causes include missing elements, DOM changes, or elements not being ready for interaction.
How to debug:
- Double-check the selectors used in your tests.
- Add waits to ensure the elements are available before interacting with them.
- Review application changes that may have affected element visibility or structure.
4. Protractor Timeout Failure
Timeout failures happen when an action or condition takes too long to complete and exceeds the set timeout limits. These can be due to performance issues, heavy page loads, or slow animations.
How to debug:
- Increase timeout settings if the default limit is insufficient.
- Use explicit waits to handle expected delays.
- Review app performance and loading behavior to identify bottlenecks.
5. Protractor Angular Failure
These failures occur when Protractor cannot detect or synchronize with Angular on the page. It typically happens in non-Angular or hybrid apps, or when Angular hasn’t finished initializing.
How to debug:
- Check if your app is fully Angular-based.
- For non-Angular pages, disable Angular synchronization.
- Ensure that Angular has fully bootstrapped before interactions begin.
Why is Debugging Important in Protractor Tests?
Debugging is critical in maintaining the reliability and accuracy of Protractor test cases. It involves identifying the root cause of test failures, analyzing the underlying issues, and fixing them to ensure the tests reflect the actual behavior of the application.
Protractor tests may fail due to a variety of reasons, including:
- Elements not being found on the page
- Protractor commands failing to execute in the browser
- Elements taking too long to load, resulting in timeout errors
- Failures arising from WebDriver-related issues
- Other unexpected errors in the test flow or application behavior
In many cases, failures can be false negatives, where the application is working as expected but the test fails due to poor synchronization, incorrect selectors, or outdated test logic. Debugging helps distinguish real issues from false ones.
By thoroughly debugging failed test cases, you can:
- Pinpoint the exact origin and type of the error
- Eliminate flaky tests and improve test stability
- Save time by addressing the right issues instead of making arbitrary changes
- Ensure your automated tests provide accurate, actionable feedback on application quality
Ultimately, debugging ensures that your Protractor test suite remains dependable and reflects the true health of your web application.
To streamline the debugging process and ensure accurate test results, it’s essential to run your Protractor tests in a stable, real-device environment. BrowserStack offers cloud-based access to a wide range of real browsers and devices, allowing you to reproduce issues easily, test in different environments, and debug faster with tools like live logs, video recordings, and screenshots, all without complex local setups.
How to debug Protractor Selenium tests?
Protractor provides various options to debug, which makes it developer friendly. Since debugging Protractor Selenium Tests can be integrated with Visual Code, you can also utilize the VSCode debugging features.
Some popular methods to debug in Protractor include:
- Using console.log()
- Debugging protractor tests in chrome inspector
- Debug Protractor tests using Visual Studio Code
- Debug protractor tests taking screenshots dynamically
Prerequisites:
Debug Protractor Tests using console.log()
This is the most favorite option for javascript developers. The console.log() outputs the specified value in the console or terminal while executing.
For example, if you need to know the text returned by the element you can use the console log as shown below.
//demo.spec.js
const { browser } = require('protractor');
describe('Protractor Test Demo', () => {
it('Navigate to BrowserStack Homepage', async () => {
await browser.waitForAngularEnabled(false);
await browser.get('https://www.browserstack.com');
const product_menu_text = await browser.element(by.id('product-menu-toggle')).getText();
console.log("The product menu text is: " + product_menu_text)
expect(product_menu_text).toEqual('Products')
});
});
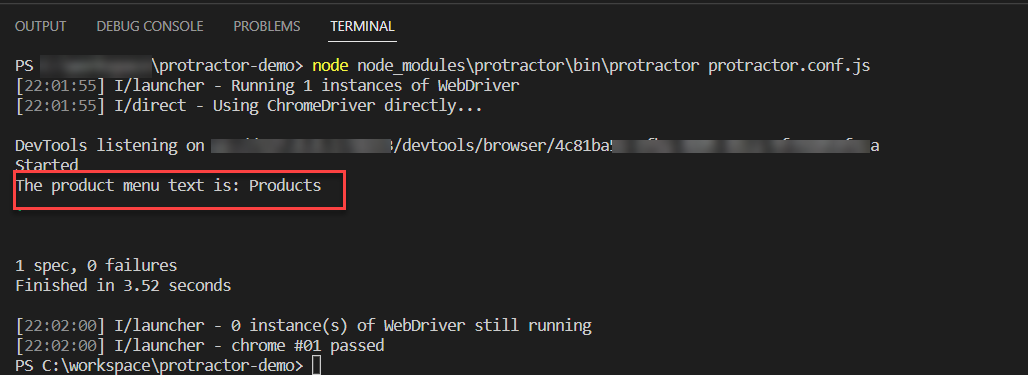
In the above code, the console.log(“The product menu text is: ” + product_menu_text) line has been used to display the ‘product-menu-toggle’ inner text in the terminal.
When you execute the protractor test you will see the output as shown below
Debug Protractor Tests using Chrome Inspector
Protractor also supports debugging the tests using the Chrome debugger or chrome inspector tool. Here’s how to debug Protractor tests using the Chrome inspector
Step 1: Add the debugger statement to your test
You need to add the debugger; statement at the desired place in your protractor scripts.
//demo.spec.js
const { browser } = require('protractor');
describe('Protractor Test Demo', () => {
it('Navigate to BrowserStack Homepage', async () => {
await browser.waitForAngularEnabled(false);
await browser.get('https://www.browserstack.com');
debugger;
const product_menu_text = await browser.element(by.id('product-menu-toggle')).getText();
console.log("The product menu text is: " + product_menu_text)
expect(product_menu_text).toEqual('Products')
});
});
In the above example, the debugger; statement has been added after the browser.get() command.
Step 2: Launch the protractor test using the below command
node --inspect-brk node_modules\protractor\bin\protractor protractor.conf.js
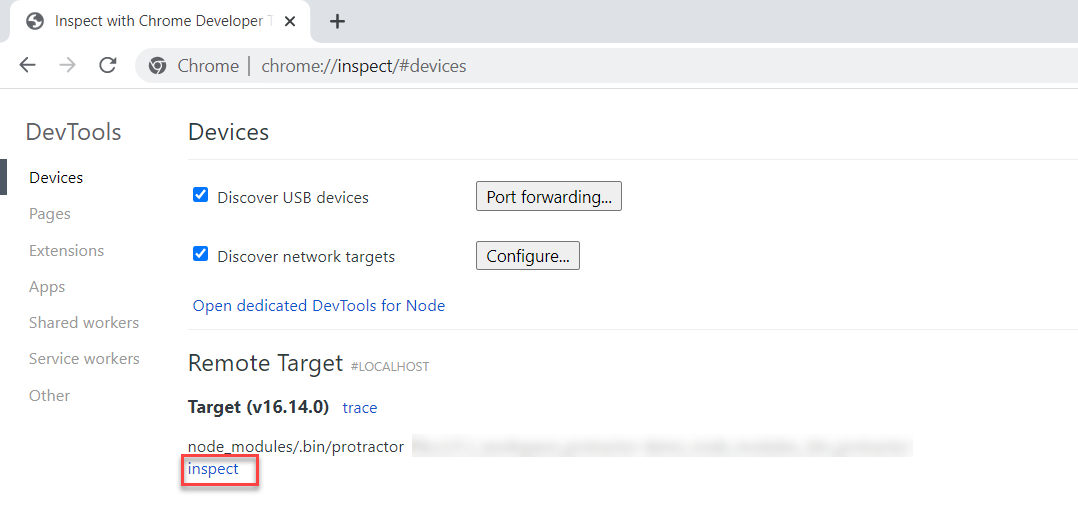
Step 3: Navigate to Chrome and launch the inspect tool
Open the chrome and enter the below line
chrome://inspect/#devices
Step 4: Click on inspect
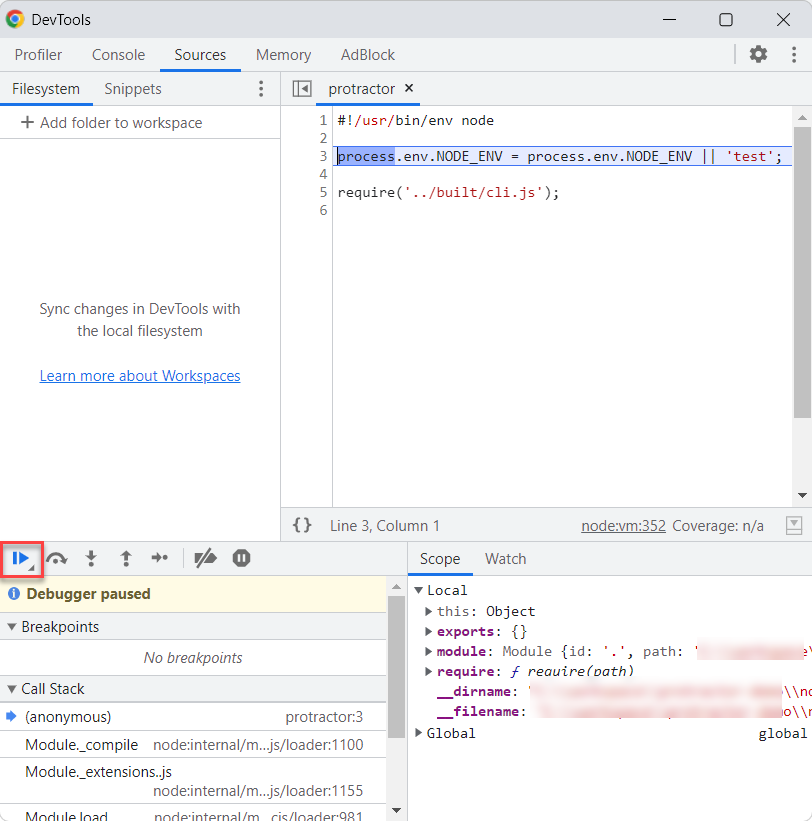
Step 5: The Node DevTools window opens
The NodeJS DevTools window Opens
Click on the Resume script execution button as shown in the below image
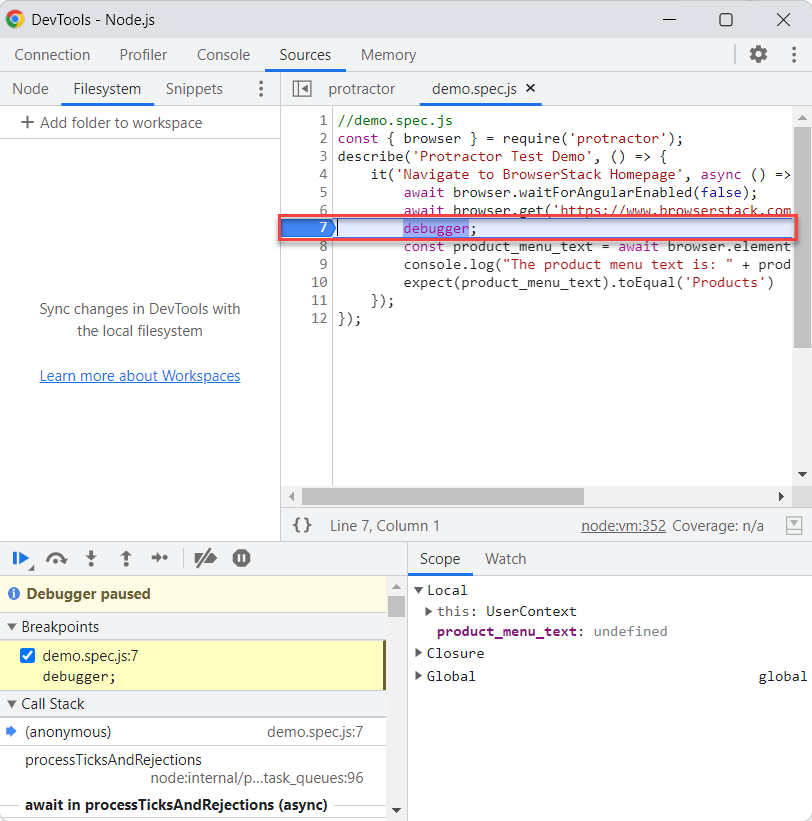
Step 6: Debug the Protractor test
Once you hit the Resume script execution button, the protractor test starts executing and halts at the line where you have placed the debugger; line.
You can hover over the commands or executed lines to check, analyze or debug your script.
Click on Resume script execution to continue the test execution.
Also-Read: How to Perform Remote Debugging in Chrome
Debug Protractor Tests using Visual Studio Code
The Visual Studio code is the most flexible and advanced IDE, providing many developer-friendly tools to debug.
How to debug Protractor tests to debug in Visual Studio Code
Step 1: Configure launch.json
From the Run menu Click on Add Configuration
Step 2: Add the configuration to launch.json
Once you click on Add configuration the launch.json file opens automatically add the below configurations
{
"version": "0.2.0",
"configurations": [

{
"type": "node",
"request": "launch",
"name": "Launch Program",
"skipFiles": [
"<node_internals>/**"
],
"program": "${workspaceFolder}\\node_modules\\protractor\\bin\\protractor",
"args": ["${workspaceFolder}\\protractor.conf.js"]
}
]
}
In the above code, the program option specifies the path to the Protractor binary.
The args option value is your protractor configuration file path
Step 3: Add the break point in VSCode and debug the test
You can use the debugger menu to Continue, Step Into, Step Over, Step Out, Restart or Stop options to debug your tests. Hovering on the executed line provides values of variables/objects
Debug Protractor Tests taking the Screenshot
Taking the screenshot helps to debug the tests by identifying the web pages which are causing the error. This option is helpful when your tests are running in CI/CD pipelines.
Step 1: Add the function to write the screenshot to file
var fs = require('fs');
function writeScreenShot(data, filename) {
var stream = fs.createWriteStream(filename);
stream.write(new Buffer(data, 'base64'));
stream.end();
}
The above code writes the base64 data to the specified file name
Step 2: Call the writeScreenShot function
Once you define the writeScreenShot function you can call it from anywhere in your tests to save the screenshot to file
describe('Protractor Test Demo', () => {
it('Navigate to BrowserStack Homepage', async () => {
await browser.waitForAngularEnabled(false);
await browser.get('https://www.browserstack.com');
const product_menu_text = await browser.element(by.id('product-menu-toggle')).getText();
console.log("The product menu text is: " + product_menu_text)

png = await browser.takeScreenshot();
await writeScreenShot(png, 'exception.png');

expect(product_menu_text).toEqual('Products')
});
});
As you can see in the above code
png = await browser.takeScreenshot(): returns the base64 encoded png for screenshot
await writeScreenShot(png, ‘exception.png’): writes the base64 encoded png to file
Step 3: Put everything together in Protractor tests
Combining both Step 1 and Step 2 code provides the complete test and captures the screenshot
//demo.spec.js
const { browser } = require('protractor');
var fs = require('fs');
function writeScreenShot(data, filename) {
var stream = fs.createWriteStream(filename);
stream.write(new Buffer(data, 'base64'));
stream.end();
}

describe('Protractor Test Demo', () => {
it('Navigate to BrowserStack Homepage', async () => {
await browser.waitForAngularEnabled(false);
await browser.get('https://www.browserstack.com');
const product_menu_text = await browser.element(by.id('product-menu-toggle')).getText();
console.log("The product menu text is: " + product_menu_text)
png = await browser.takeScreenshot();
await writeScreenShot(png, 'exception.png');
expect(product_menu_text).toEqual('Products')
});
});
Conclusion
The Protractor framework is one of the popular tools, however, it will be deprecated. As the Angular team mentions, to update Protractor with the latest Selenium changes, they need to rewrite the code, similar to building a new framework.
- The best alternative tool to Protractor, which shares similar architecture and features, is NightwatchJS.
- It is up to date with the latest technology and built with modern architecture as it uses the Selenium W3C protocol under the hood, which means you can do almost everything you do with Selenium and Protractor.
- It provides a powerful debugging feature that makes the developer’s life easy.
- You can easily migrate your Protractor tests to NightwatchJS and make your new testing framework up and running in a short period.


