Safari is the default browser on Apple devices and the world’s second most popular after Chrome.
Ensuring site compatibility on Safari is crucial, but testing across iOS and macOS versions is tough, especially for Windows users without native tools.
Overview
Challenges of Native Safari Remote Debugging
- Requires a Mac for iOS device debugging.
- Limited access to diverse real devices.
- Complex setup for Windows users.
- Difficulties managing multiple OS and browser versions.
- Native tools don’t support cross-platform remote debugging easily.
How to Perform Safari Remote Debugging with BrowserStack
- Use BrowserStack Live to debug Safari on real macOS and iOS devices interactively.
- Access DevTools directly in the BrowserStack dashboard for seamless inspection.
- Enable Local Testing to debug development and staging environments securely.
This article will give an overview of how users can perform remote debugging on real Safari for macOS and iOS using BrowserStack.
What is Safari Remote Debugging?
Safari Remote Debugging is inspecting and troubleshooting web pages running on Safari browsers, especially on iPhones and iPads, using developer tools from another device.
It allows developers to access Safari’s Web Inspector remotely to directly view and fix layout issues, JavaScript errors, and network activity on Apple devices.
This is particularly useful for mobile testing, where replicating real user conditions on physical devices is essential for accurate debugging.
Must Read: How to Debug on iPhone Safari for Windows
Importance of Safari Remote Debugging
Apple devices make up a significant portion of global web traffic. Ensuring that websites perform seamlessly on Safari, across iOS and macOS, is critical for user experience, accessibility, and SEO.
Without proper Safari debugging:
- Layout or script issues on iPhones might go unnoticed until users report them.
- Developers on non-Mac systems face serious limitations accessing Safari dev tools.
- Testing across device/OS combinations becomes time-consuming and incomplete.
Also Read: How to View Source Code in Safari
Remote debugging bridges these gaps, helping teams catch issues earlier, deliver polished user experiences, and maintain cross-browser compatibility across the Apple ecosystem.
Challenges in Native Safari Remote Debugging
While Safari offers native remote debugging tools via Web Inspector, using them effectively often comes with these limitations:
- macOS Dependency: Debugging Safari on iOS devices requires a Mac with Safari and Xcode, making it inaccessible for developers on Windows or Linux.
- Limited Device Access: Testing on a wide range of iPhones, iPads, or Safari versions is difficult without owning multiple Apple devices.
- Cumbersome Setup: Native debugging requires USB connections, device pairing, and manual setup steps that slow the workflow, especially in fast-paced teams.
These challenges make achieving consistent, scalable Safari testing hard, especially in cross-platform development environments.
Learn More: Swift vs Xcode: Understanding Key Differences
Remote Debugging on Safari using BrowserStack Live
To begin remote debugging on Safari, users must sign up for a free account on BrowserStack Live.
BrowserStack Live enables interactive testing on 3500+ real devices and browsers, including Safari on both macOS and iOS. No emulators or complex setup are required.
Each session comes with Safari DevTools enabled by default, streamlining the debugging process.
Safari debugging is available in two primary scenarios:
- Safari on macOS
- Safari on iOS devices
The following sections outline steps for both use cases.
How to Remotely Debug Safari on macOS with BrowserStack
- As mentioned earlier, one needs to Sign-up for free. Once done, the Live dashboard will appear on the screen.
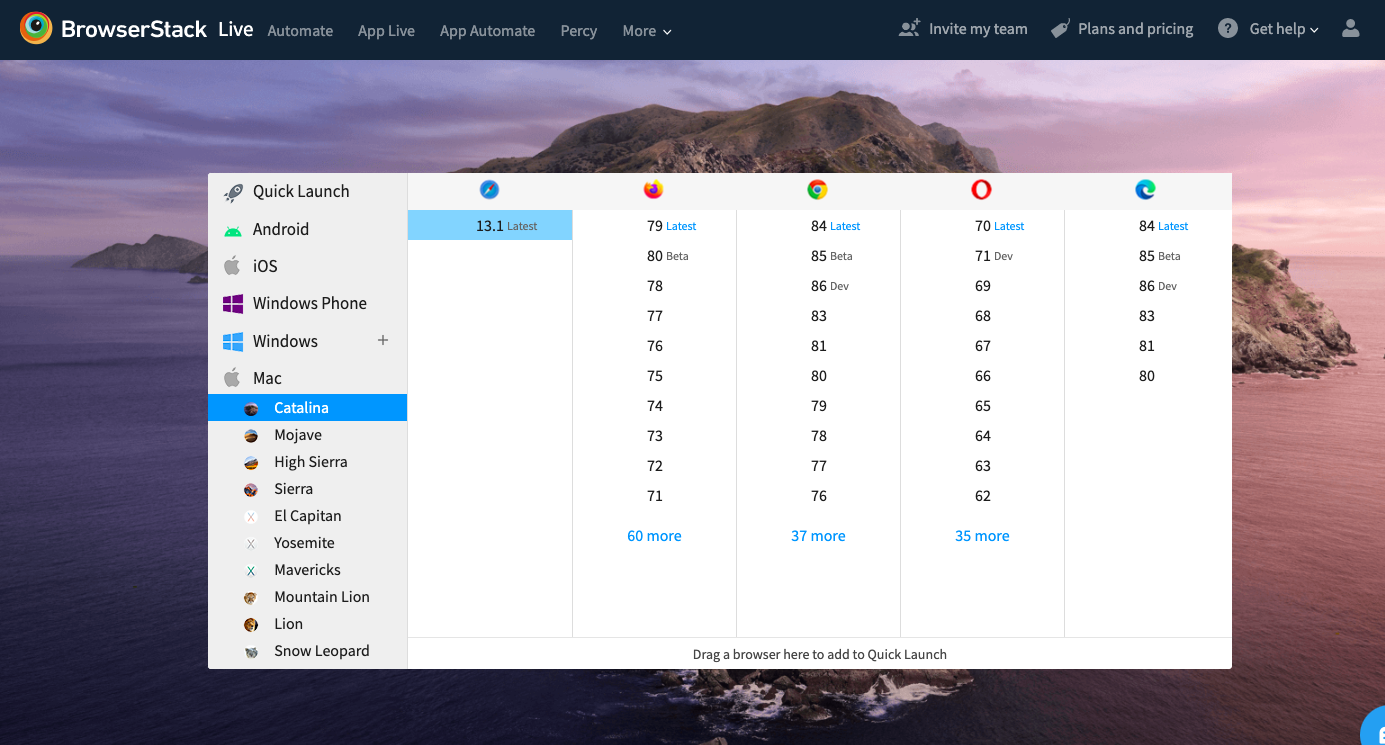
- From the Live Dashboard, choose the macOS version (e.g., Catalina, Mojave, etc.)
- Select the Safari browser (version 13.1: latest for macOS Catalina)
- A new Safari session will be initiated
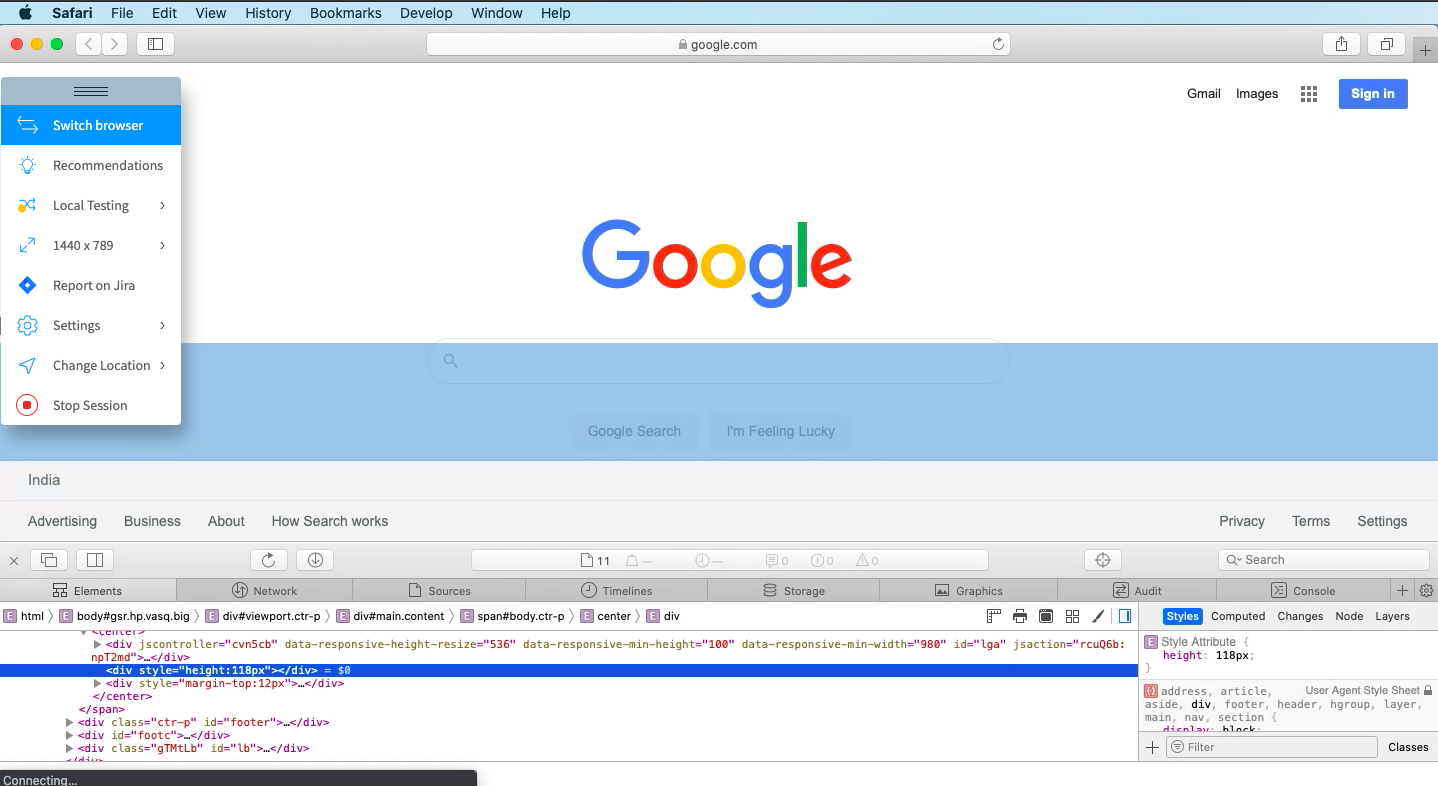
Note: For every session initiated on Safari, the Develop menu is enabled by default. So one does not have to manually enable the Develop menu. Directly start debugging by right-clicking the mouse and selecting the Inspect Element option.
When a user clicks on the Inspect element feature on a particular website’s element, the developer console opens up. Now the developers or QAs can easily debug HTML, CSS, and Javascript for specific web elements (Refer to the image above).
Developers or QAs can also test web-apps that are currently in development stages on Safari browsers using the Local Testing feature. This feature allows teams to test their web-apps in progress at scale on real devices and browsers without hosting them on public staging environments. To learn more about it, refer to BrowserStack’s local testing documentation.
How to Remotely Debug Safari on iOS Devices with BrowserStack
- Similar to the first scenario, once the user is signed in, the Live dashboard will be displayed.
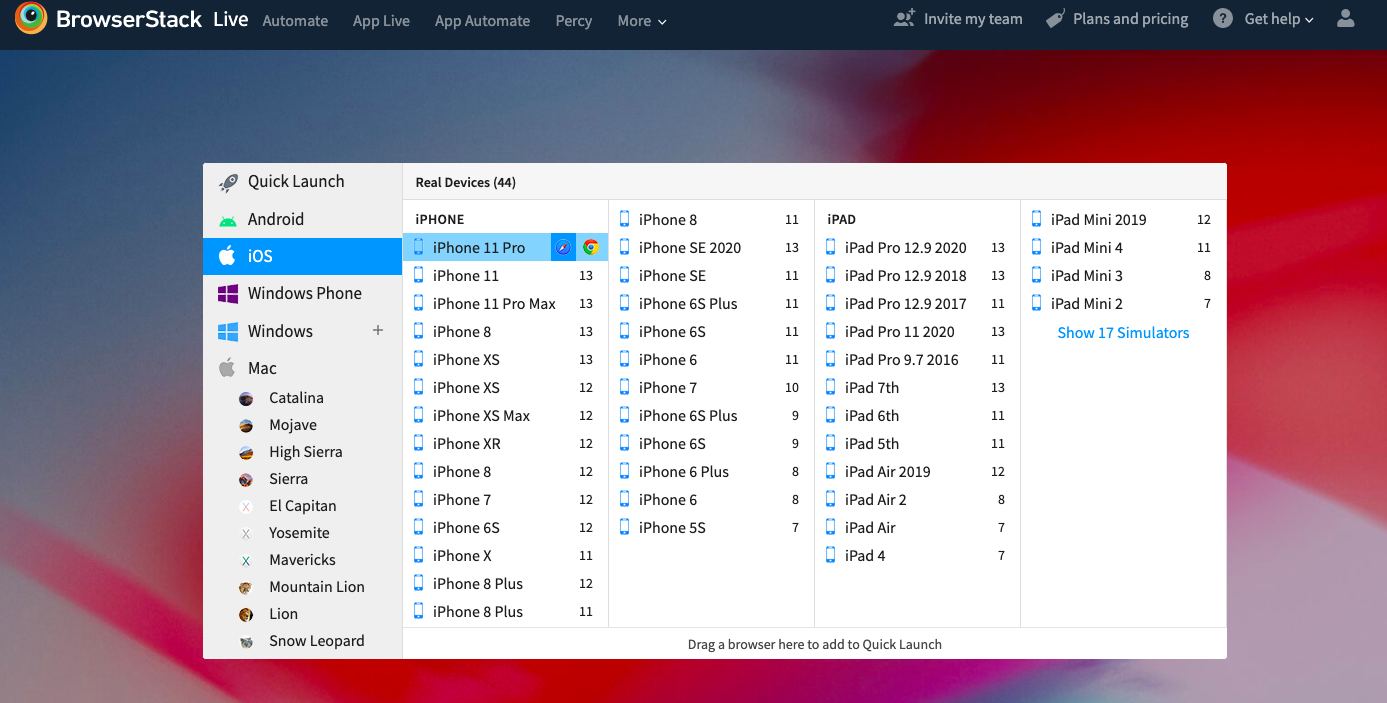
- Select the iOS platform and choose the desired iPhone or iPad.
- Hover over the desired iPhone or iPad. Choose from two browsers – Safari and Chrome. Select Safari.
- Click on the Safari browser, and a new Safari session will be initiated on a real iPhone 11 pro.
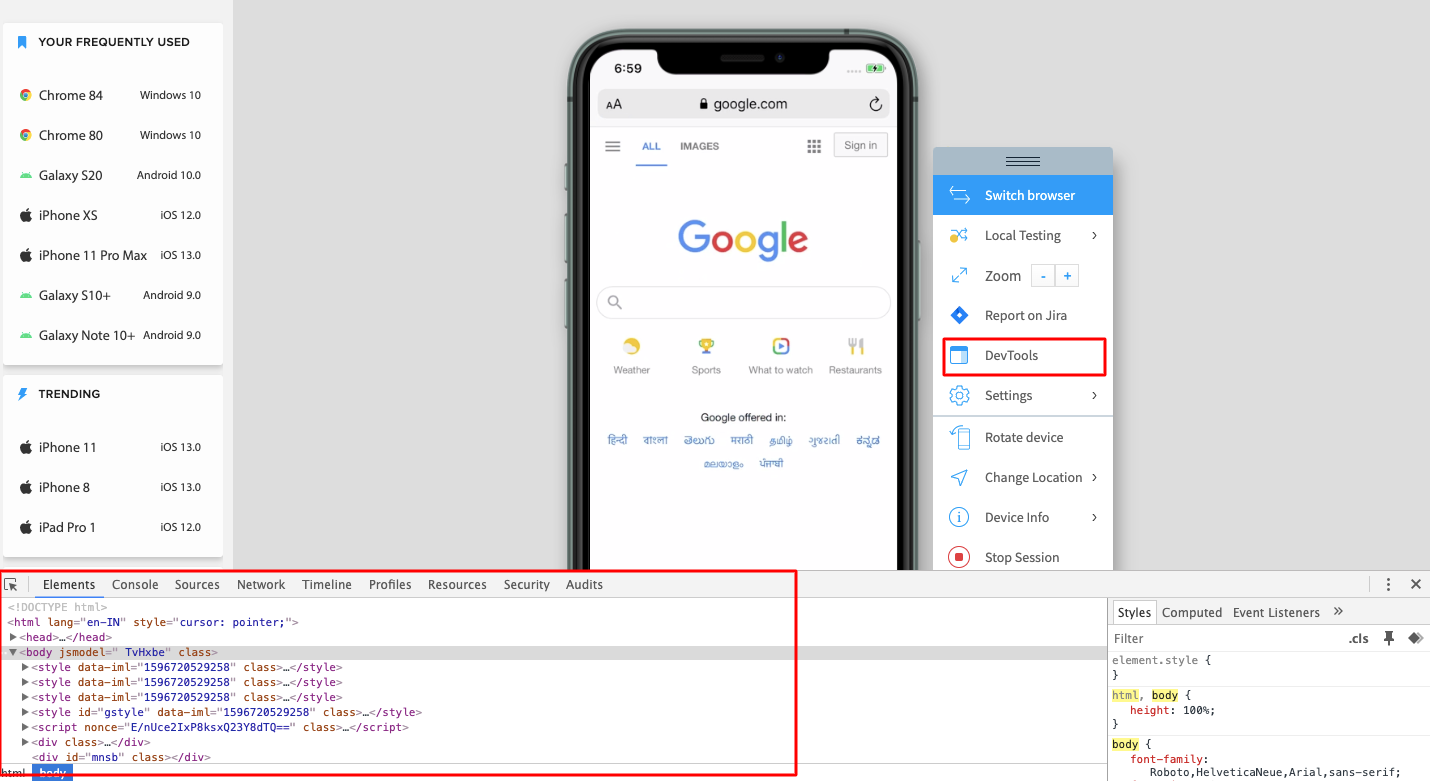
- Once the session begins, click on the DevTools from the floating menu, as shown in the image below
- Once the DevTools option is selected, the Safari developer console opens up, to allow QAs and developers to interact with the DOM elements and debug HTML, CSS, and Javascript on a specific webpage. (Similar to the web-inspector feature provided by Apple in Safari for macOS)
- Teams can also leverage the Local testing feature similar to the one in the desktop browser versions to debug websites in development on real mobile devices.
That’s how teams can remotely debug and optimize their sites for Safari (Mac and iOS) without any complicated setup.
Leveraging Local Testing for Development Builds
BrowserStack’s Local Testing feature enables developers to remotely debug websites hosted on localhost or behind firewalls using real Safari browsers on macOS and iOS.
Also Read: Overcoming Challenges of Local Testing
Why it matters:
- You can test and debug development builds without deploying them to a public server.
- Safari DevTools remain fully accessible for inspecting and troubleshooting.
- Setup is simple and secure, whether through the BrowserStack Live dashboard or the Local binary.
This allows teams to identify and resolve issues early in the development cycle.
Key Benefits of Using BrowserStack for Safari Remote Debugging
BrowserStack provides a seamless way to debug Safari across a wide range of real devices and platforms without complex setups.
It enables faster, more reliable testing for developers on any operating system.
- Access over 3500+ real devices on their real device cloud, including the latest iPhones, iPads, and macOS Safari versions.
- Start testing immediately without needing device provisioning, cables, or complex installations.
- Debug Safari on any Windows, Linux, or macOS OS without restrictions.
- Use native Safari Developer Tools directly in the BrowserStack Live environment.
- Securely test local or private development environments via BrowserStack Local.
- Run parallel tests across multiple devices to accelerate your testing process.
Conclusion
Safari is one of the most widely used browsers, making cross-browser compatibility essential.
BrowserStack simplifies remote testing and debugging on real iOS and macOS devices. It provides instant access to Safari’s DevTools and features like Local Testing for a smooth, efficient workflow.
Frequently Asked Questions
1. Can I debug Safari on an iPhone from a Windows PC using BrowserStack?
Yes. BrowserStack enables remote debugging of Safari on real iPhones directly from a Windows PC, eliminating the need for a Mac.
2. Does BrowserStack provide the latest Safari versions and iOS devices for debugging?
Yes. BrowserStack offers access to the newest Safari versions and a wide range of iOS devices, ensuring up-to-date testing environments.

