Single tool for complete automation reporting, health tracking & troubleshooting
View test reports, triage failures, access consolidated test run logs, track suite health metrics, and set up alerts – everything from one place.
2-min SDK Integration
Add a few lines of code in a config file, and you’re ready to go.
Test Platform Agnostic
Run tests on BrowserStack, local, or anywhere else. It works.
All Test Types Supported
Be it unit, API, integration, functional or any other test.
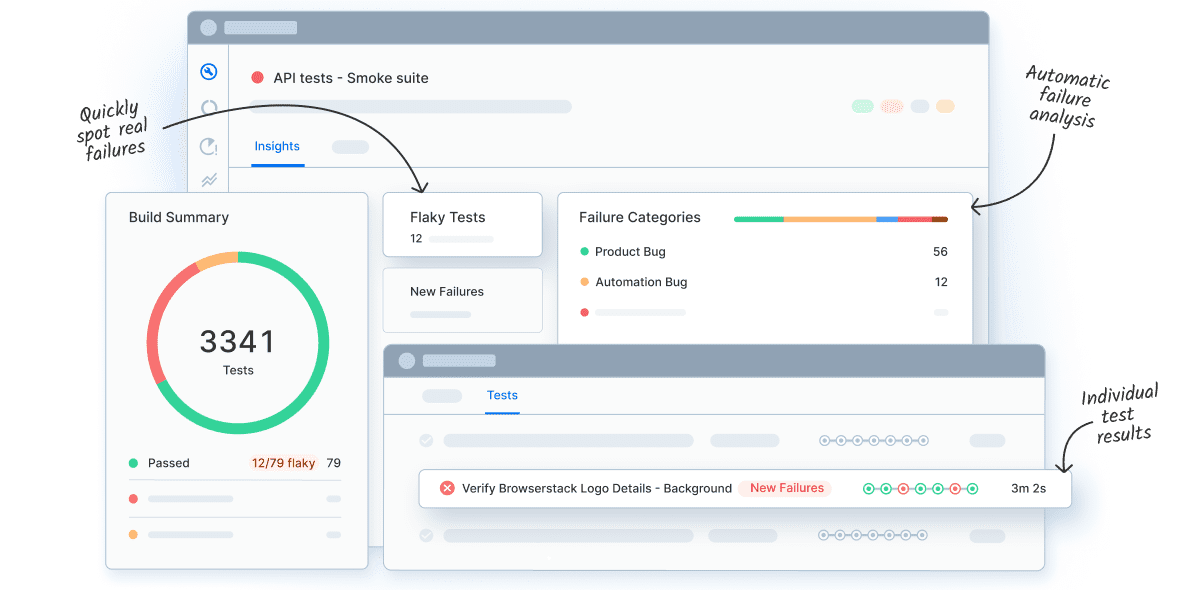
Only signals, no noise
Jump to critical test failures with AI-based automatic failure categorization.

Contextual, AI-enriched debugging
Access every type of log from video to screenshots, terminal, network, device, test framework and even application logs in a single place.

Timeline debugging
Aggregated logs sorted chronologically so you can instantly find point of failure, without context switch.

Timetravel debugging
Go back in time to analyze logs from a previous run to debug at the source of an issue.

Debug only new issues
Update failure category only once to get similar failures automatically tagged as such in future. No repeat debugging.
Clean, intuitive workflows
Perform every step of run verification from a single dashboard.

Metrics & monitoring
Easily measure metrics that affect your test suite health. Act when it matters.

No spreadsheet madness
Get all relevant test suite metrics like build stability, flakiness, and more already calculated.

Custom alerts
Configure alerts on any metric – pass percentage, flakiness percentage, build run time, number of muted days, etc.

Email notifications
Get build insights and daily summary emails in your inbox. Configure which builds and projects you want to receive emails for.
Logical aggregations & visualisations
Analyze test suite quality over time with ready-to-use, digestible charts and dashboards

