Summary tab
The Summary tab gives you a snapshot of how your app performed under load.
The Summary tab gives you a high-level overview of your application’s performance during load testing. Use this page to quickly assess key metrics, identify trends, and spot potential issues that may affect user experience under load.
The Summary tab is organized into the following sections:
- AI Insights
- Test Execution Summary
- API Metrics and Timeline
- Browser Metrics and Timeline
Filter results by scenario
When your test uses multiple scenarios, a Scenarios filter appears at the top of the report. Select one or more scenarios to scope the entire report to that traffic. The filter applies across the Summary, Web Vitals, Network, Logs, and Engine Health tabs.
On the Summary tab, the metrics and timeline charts update to reflect the selected scenarios, which lets you read web vitals and backend metrics scenario by scenario instead of only as a combined total.
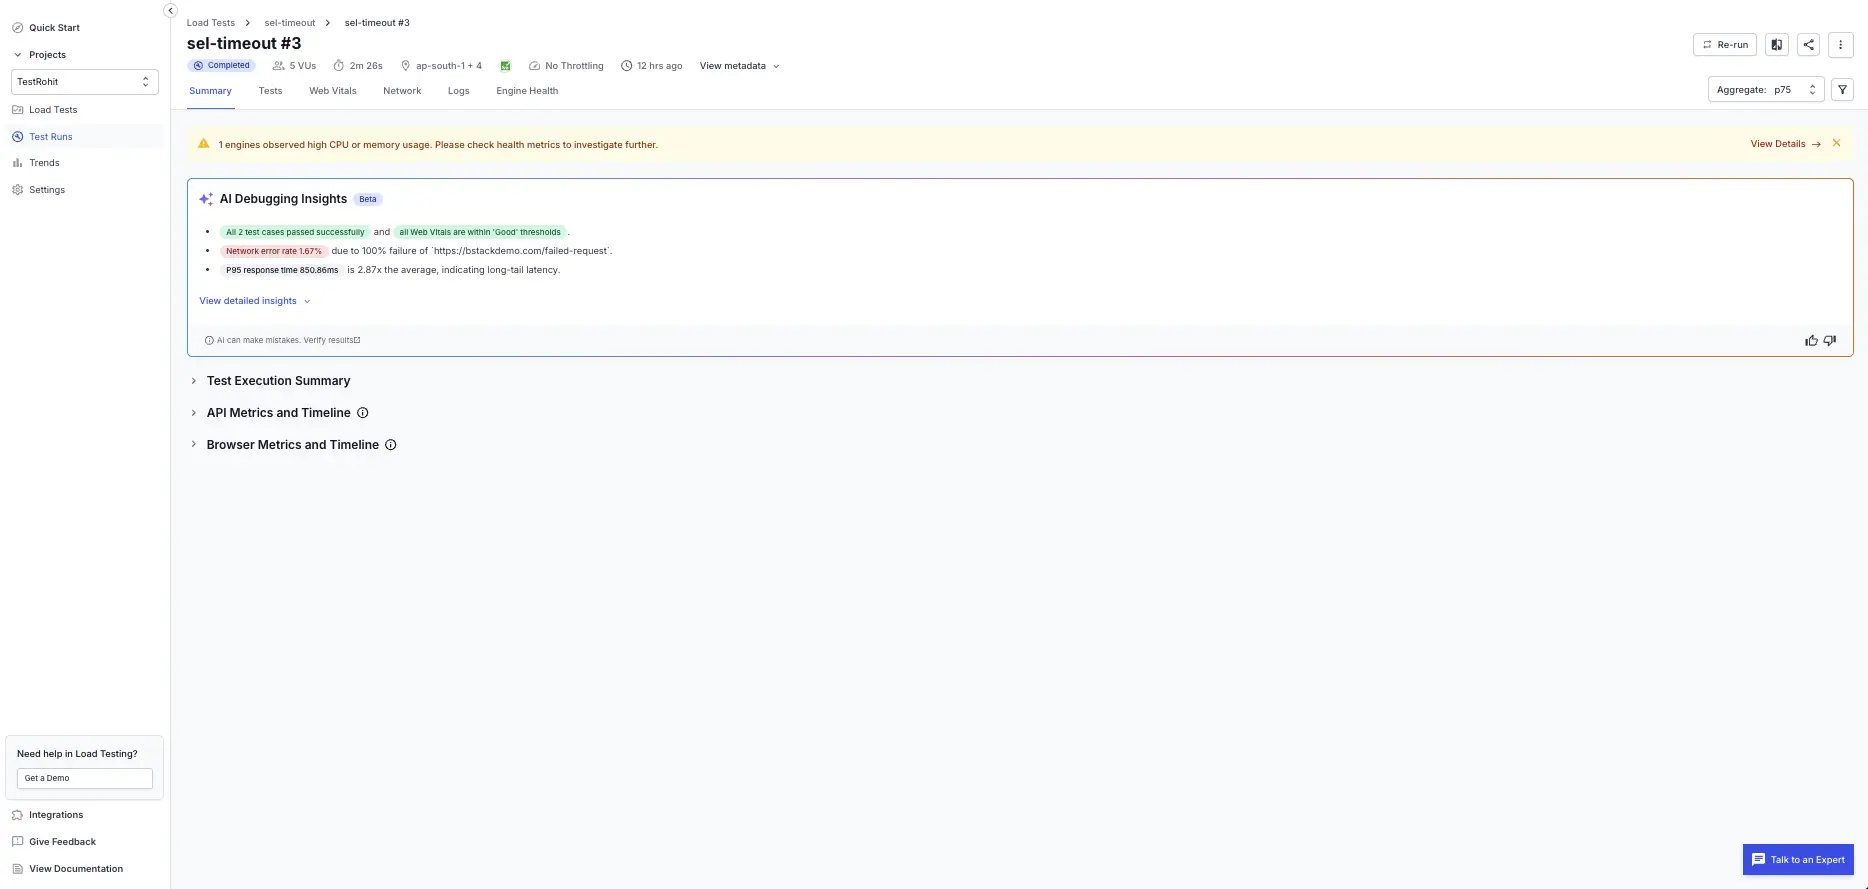
AI Insights
The AI Insights card (Beta) summarizes the most important findings from the run in plain language. It surfaces:
- Overall test case pass rate.
- Whether all Web Vitals are within “Good” thresholds.
- Notable network error rates with the failing endpoint(s) called out.
- Notable response-time outliers (for example, P95 vs the average) that indicate long-tail latency.
Select View detailed insights to expand the full AI-generated explanation. AI Insights is advisory. Verify findings against the underlying metrics before acting on them. For more about this feature, see AI Insights.
Test execution summary
The Test Execution Summary section reports the outcome of every test case in the run.
The tile row shows:
- Passed Tests with the success rate.
- Failed Tests.
- Skipped Tests.
- Other Status Tests (for example, tests with engine errors or aborted execution).
The Load vs Failure Rate Progression chart below the tiles plots virtual users (actual load) and the test failure rate against time so you can correlate failures with load ramp-up.
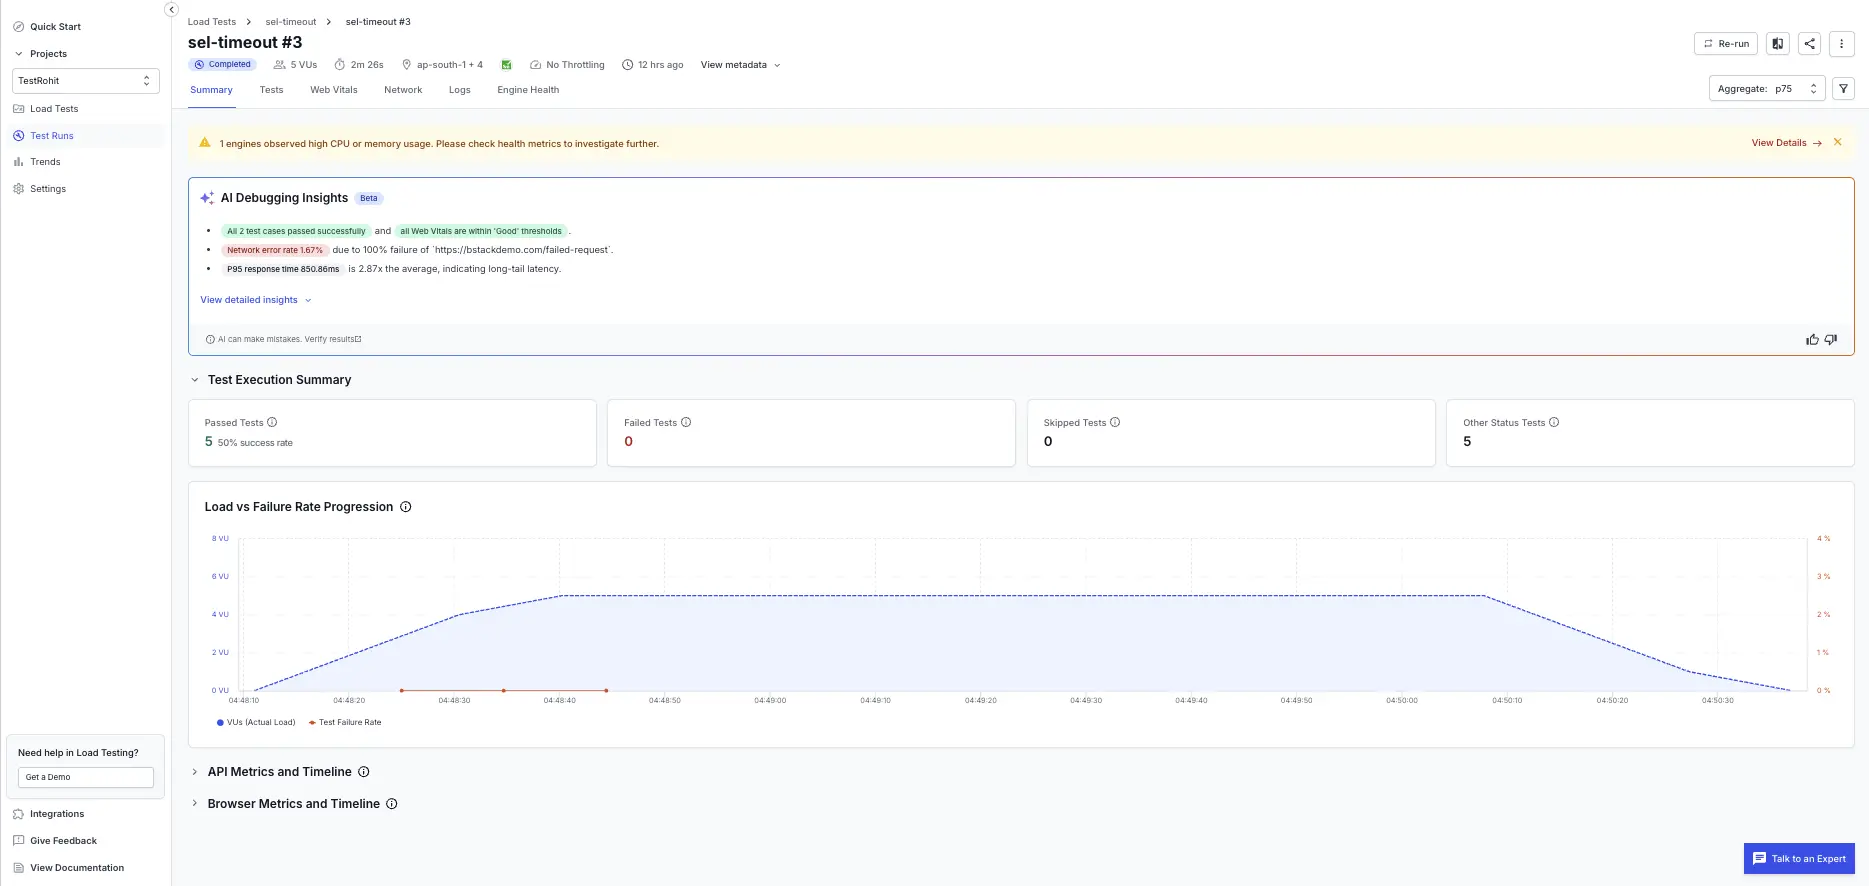
For per-test details, drill into the Tests tab.
API metrics and timeline
The API Metrics and Timeline section summarizes backend behavior across all network calls made during the run.
The tile row shows:
- Total Requests.
- Avg. Request Rate (requests per second).
- Error %.
- p75 Response Time (or whichever aggregate is selected in the report header).
The API Performance chart below the tiles plots virtual users (expected and actual), request rate, error percentage, and the selected response-time percentile against time. Click and drag across the chart to zoom into a specific time range; all metrics update to that range.
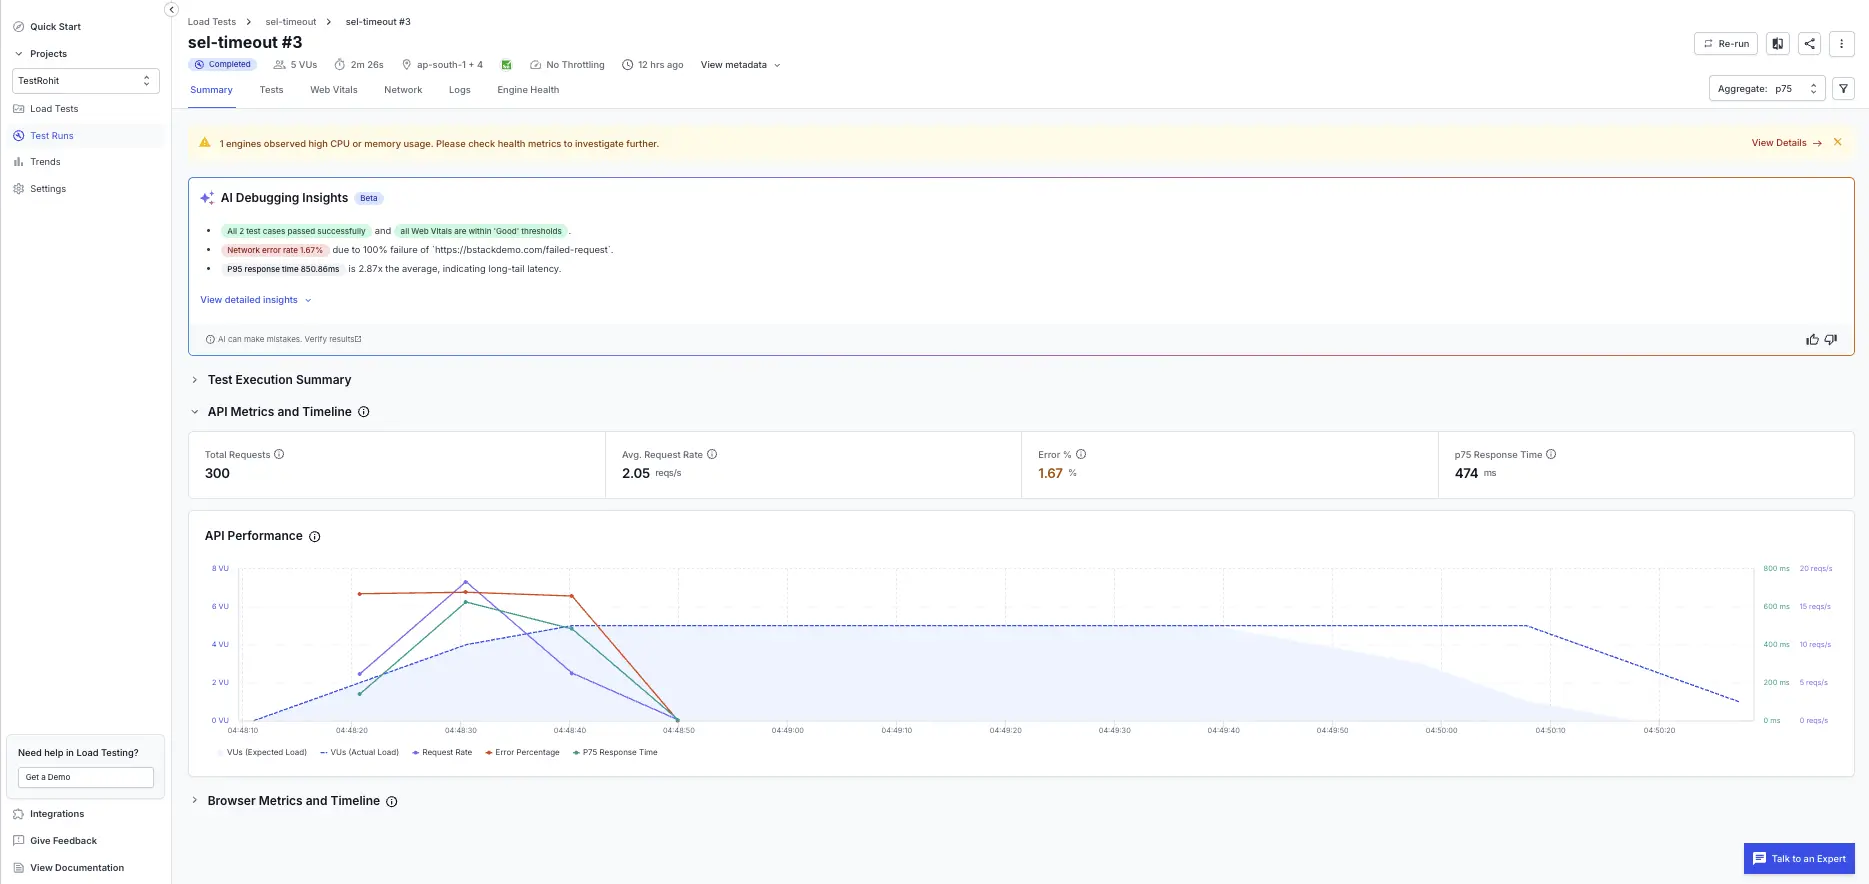
For per-endpoint analysis, drill into the Network tab.
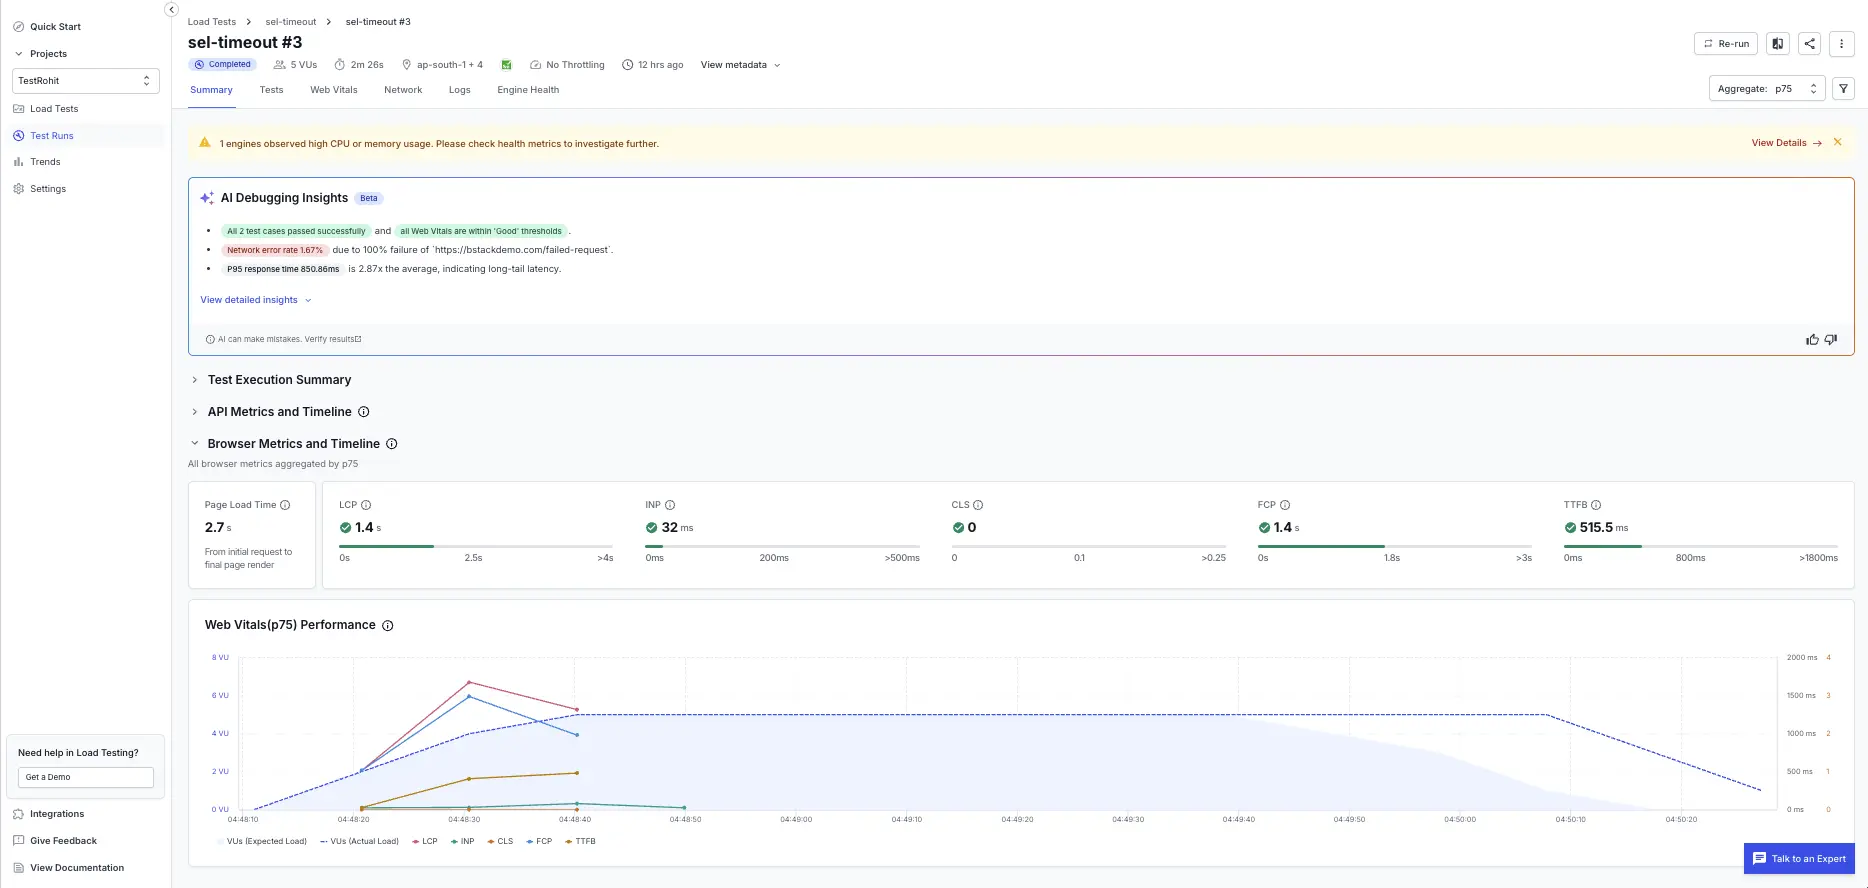
Browser metrics and timeline
The Browser Metrics and Timeline section summarizes frontend behavior aggregated across all virtual users and pages, using the percentile selected in the report header.
Page load time
The Page Load Time tile shows the time from the initial request to final page render, aggregated by the selected percentile.
Web Vitals tiles
A row of tiles summarizes the most important Core Web Vitals against their “Good / Needs improvement / Poor” thresholds:
| Metric | Description | Debug tip |
|---|---|---|
| LCP (Largest Contentful Paint) | Time to render the largest visible element. | Check for slow images, fonts, or containers. |
| INP (Interaction to Next Paint) | Delay between user action and visual response. | Debug JavaScript blocking or slow APIs. |
| CLS (Cumulative Layout Shift) | Measures layout shifts during load. | Inspect DOM changes or font swaps. |
| FCP (First Contentful Paint) | Time to render the first visible element. | Look for render-blocking CSS or server latency. |
| TTFB (Time to First Byte) | Time until first byte from the server. | Check for backend slowness or network issues. |
A green check next to a tile means the value is within the “Good” range. Click any tile or open the Web Vitals tab for page-level breakdown.
Web Vitals performance chart
The Web Vitals Performance chart plots virtual users (expected and actual) alongside LCP, INP, CLS, FCP, and TTFB against time. Use it to spot frontend trends affecting user experience and to correlate metric spikes with load ramp-up.
- X-axis: Test duration.
- Y-axis (left): Virtual users.
- Y-axis (right I): LCP, INP, FCP, TTFB (in ms).
- Y-axis (right II): CLS.
Click and drag across the chart to zoom into a specific time interval; all metrics update to the zoomed range.
We're sorry to hear that. Please share your feedback so we can do better
Contact our Support team for immediate help while we work on improving our docs.
We're continuously improving our docs. We'd love to know what you liked
We're sorry to hear that. Please share your feedback so we can do better
Contact our Support team for immediate help while we work on improving our docs.
We're continuously improving our docs. We'd love to know what you liked
Thank you for your valuable feedback!