Debug tests using network and console logs
Low Code Automation enables instant analysis of failed test executions using network and console logs
Use BrowserStack’s debugging logs to get insights into execution flow of the code, identifying errors, bottlenecks, and ensuring the reliability of communication between different components or systems for efficient troubleshooting and optimisation.
Diagnose and resolve issues in failed Low code automation tests, and easily fix bugs by using the below logs:
Console Logs
Console Logs capture the browser’s JS console output at various steps of the test to troubleshoot JavaScript issues. You can retrieve Console logs from the test present in the Builds section on the Low Code Automation dashboard.
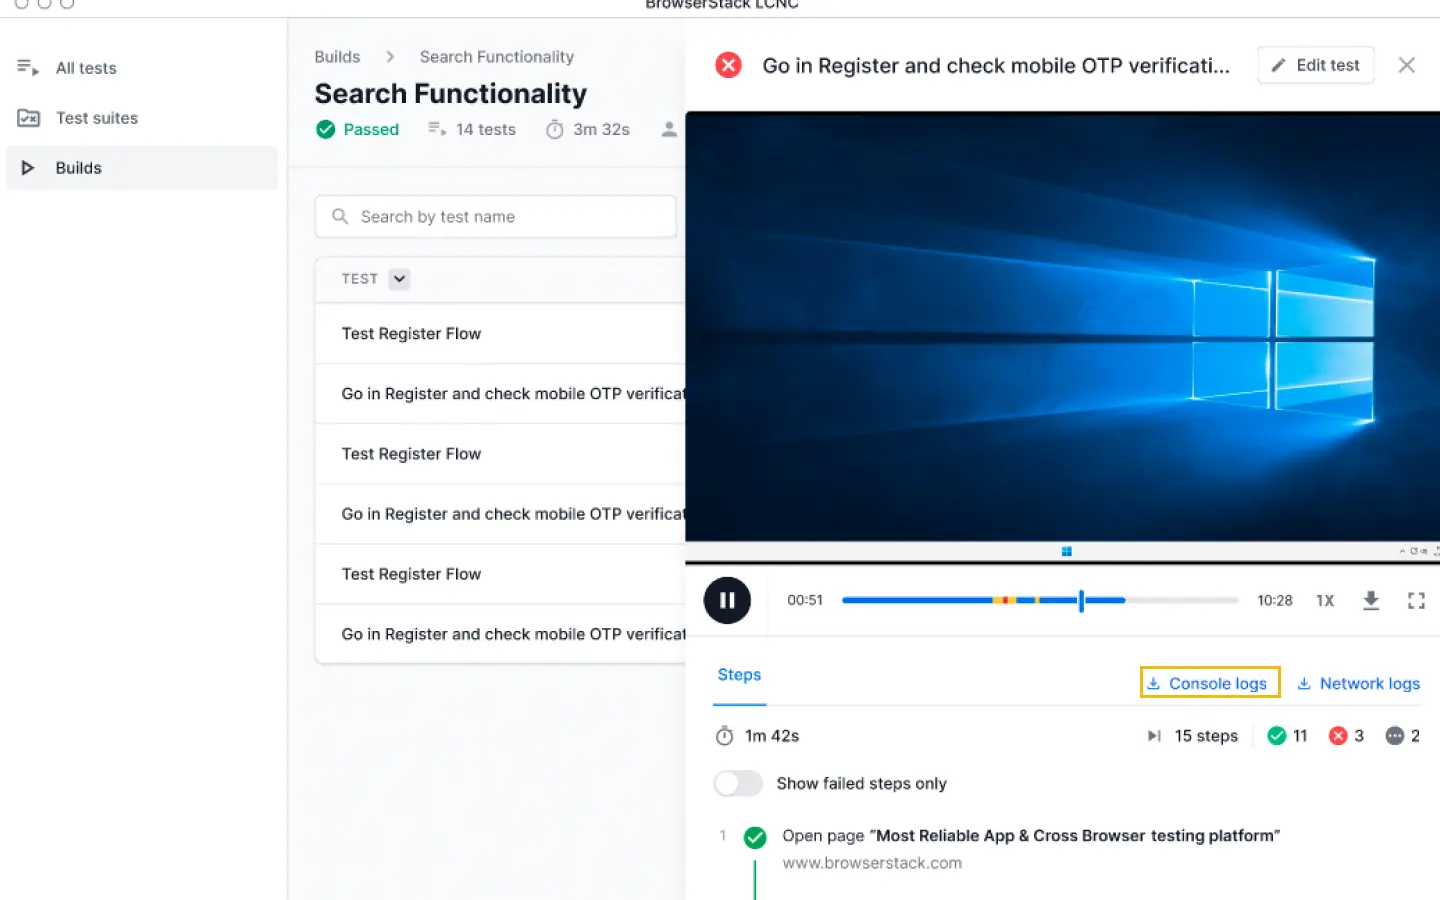
The Console logs feature is currently available only on Chrome and Edge browsers.
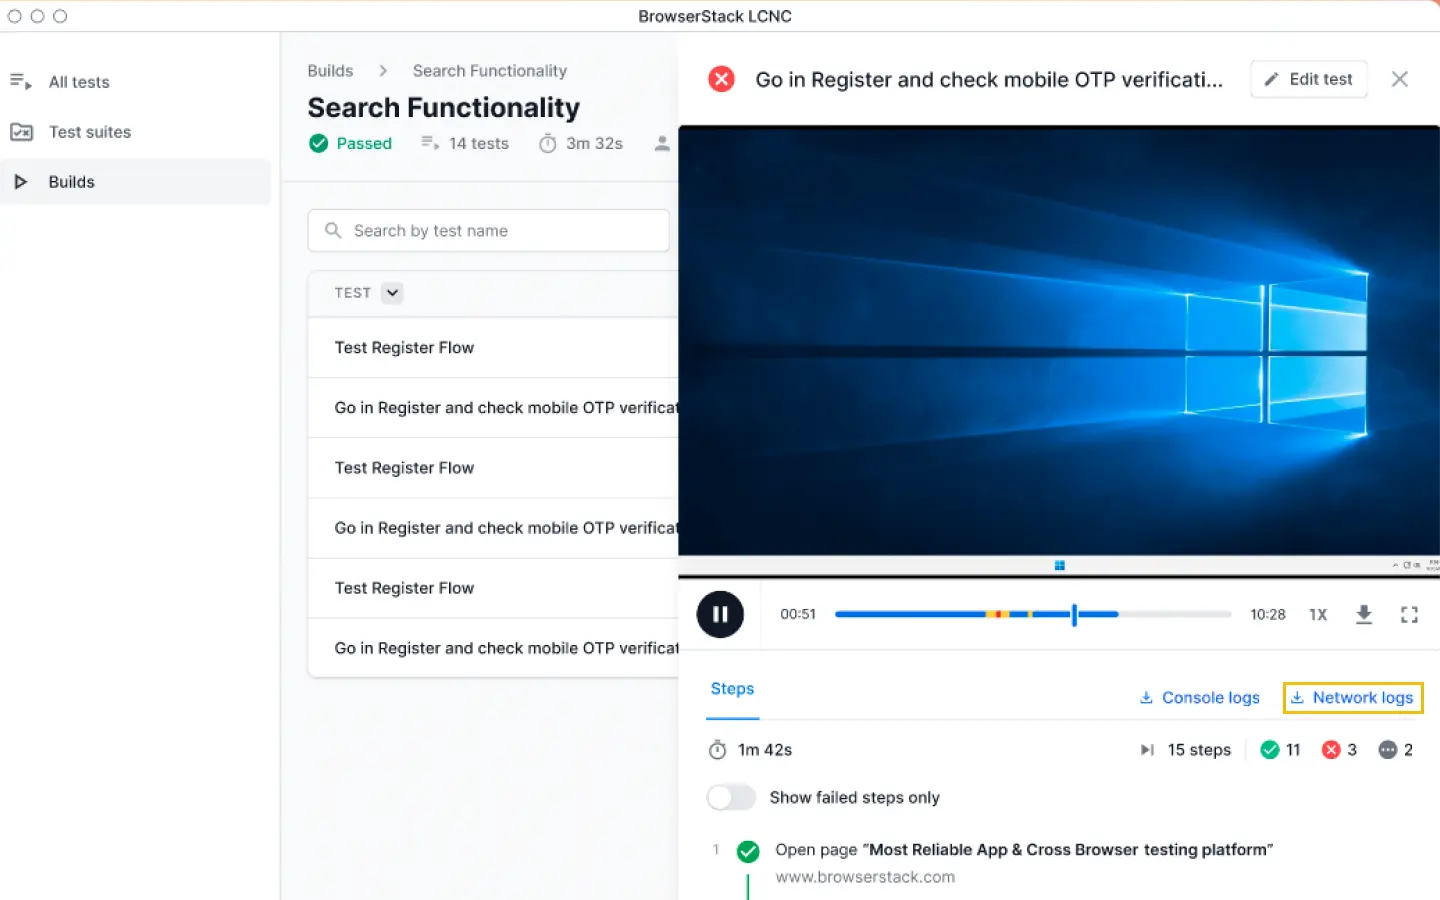
Network Logs
You can get a comprehensive log of all network activity during your Low Code Automation tests using the Network Logs feature. Network Logs capture the browser’s performance data such as network traffic, latency, HTTP requests and responses in the HAR (HTTP Archive) format. You can leverage Network logs to get a clear picture of all the requests your web page is making, and the time taken for each of these requests. You can download network logs from the test present in the Builds section on the Low Code Automation dashboard.
We're sorry to hear that. Please share your feedback so we can do better
Contact our Support team for immediate help while we work on improving our docs.
We're continuously improving our docs. We'd love to know what you liked
We're sorry to hear that. Please share your feedback so we can do better
Contact our Support team for immediate help while we work on improving our docs.
We're continuously improving our docs. We'd love to know what you liked
Thank you for your valuable feedback!