
 Join our Discord
Create cross-project reports in Test Management
Create one Test Management report that combines test data from up to 60 projects. View each metric by project.
In Test Management, a cross-project report includes data from more than one project. Use it to report on a release that spans two or more projects.
The report still shows where each number comes from. You can open a metric and see its value for each project.
Project limits by report type
The number of projects that you can select depends on the report type.
| Report type | Maximum projects |
|---|---|
| Requirement traceability report | 60 |
| Test run summary report | 60 |
| Test run detailed report | 60 |
| Test case activity report | 60 |
| Test plan summary report | 60 |
| Test plan detailed report | 60 |
| User workload report | 5 |
| Exploratory session summary | 1 |
Cross-project selection in test case activity reports is available to all accounts. For the other report types, contact BrowserStack support to enable it for your account. Until it is enabled, the Projects dropdown accepts one project.
To select projects for a test execution report, use its separate report builder. See Use test execution reports in Test Management.
Create a cross-project report
To combine projects, select more than one project in the Projects dropdown when you set up the report.
The following steps create a test run summary report. To create another supported report type, select that type after you click Create Report. The Create Report window then asks you to select test cases, test plans, or requirements instead of test runs.
A cross-project report supports only system fields as filters.
- In Test Management, click Reports in the left navigation.
- Click Create Report, and then select Test Run Summary.
-
In the Projects dropdown, search for each project and select its checkbox.
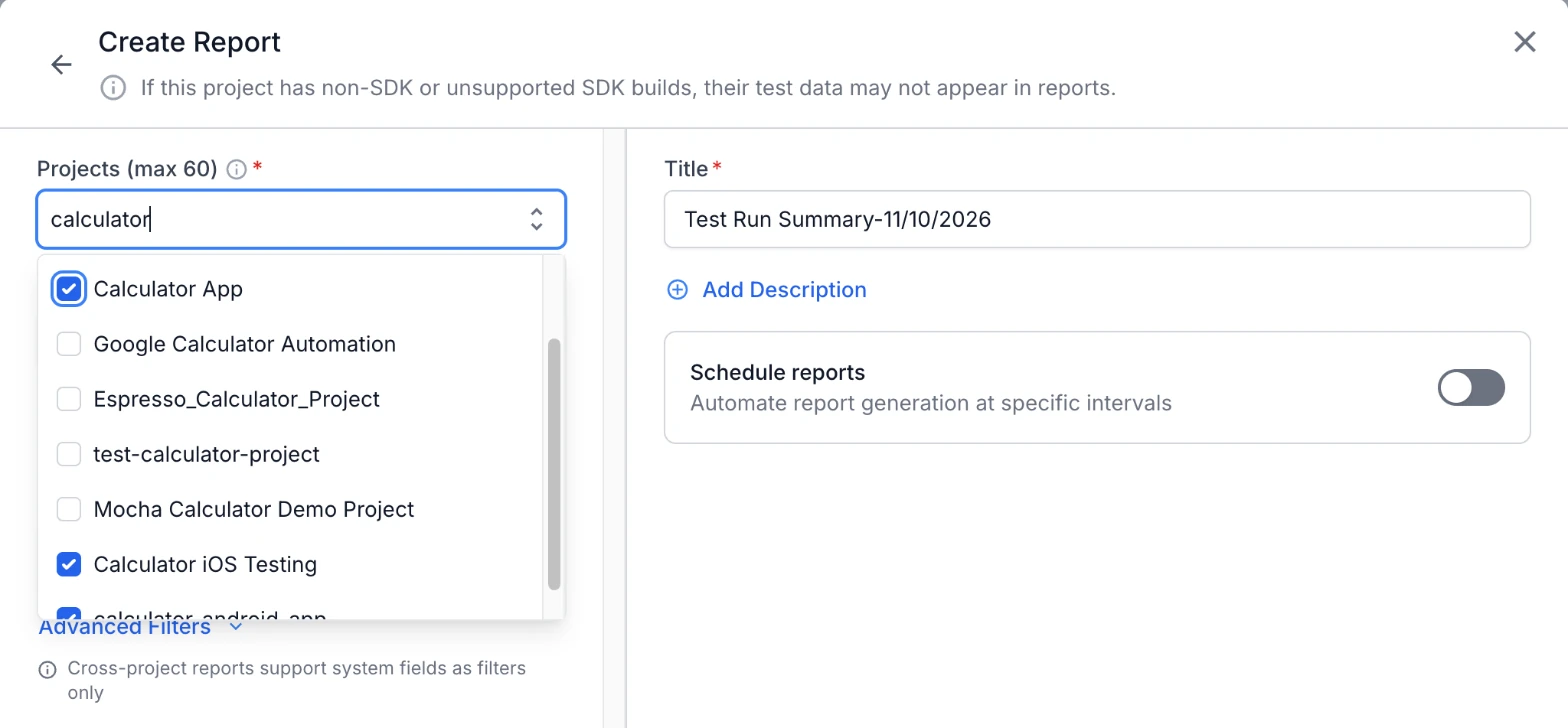
The field shows the selected project names and their count.
- Under Select test runs to include based on, select Creation Time or Specific Test Run. To compare the two, see Options to include test runs.
- To narrow the report, expand Advanced Filters and set the filters.
- Enter a Title for the report. To generate the report at regular intervals, turn on Schedule reports.
- Click Create.
Test Management shows a “Report generated successfully” message. The report then opens.
Options to include test runs
When you create a test run summary report, you choose how the report collects test runs from the selected projects. You make this choice under Select test runs to include based on in the Create Report window. Use the following table to pick the option that fits your report:
| Option | Use case | Next action |
|---|---|---|
| Creation Time | You want the test runs that were created in a time range. | Select the range in Include test runs created in. |
| Specific Test Run | You want to choose individual test runs from each project. | Click Add, and then select specific test runs. |
Select specific test runs
After you click Add, the Add Test Runs to Report panel opens. It has one tab for each selected project.
- Click a project tab, and then select the test runs to include.
-
Select test runs in the tab of each remaining project. Your selections remain when you switch tabs.
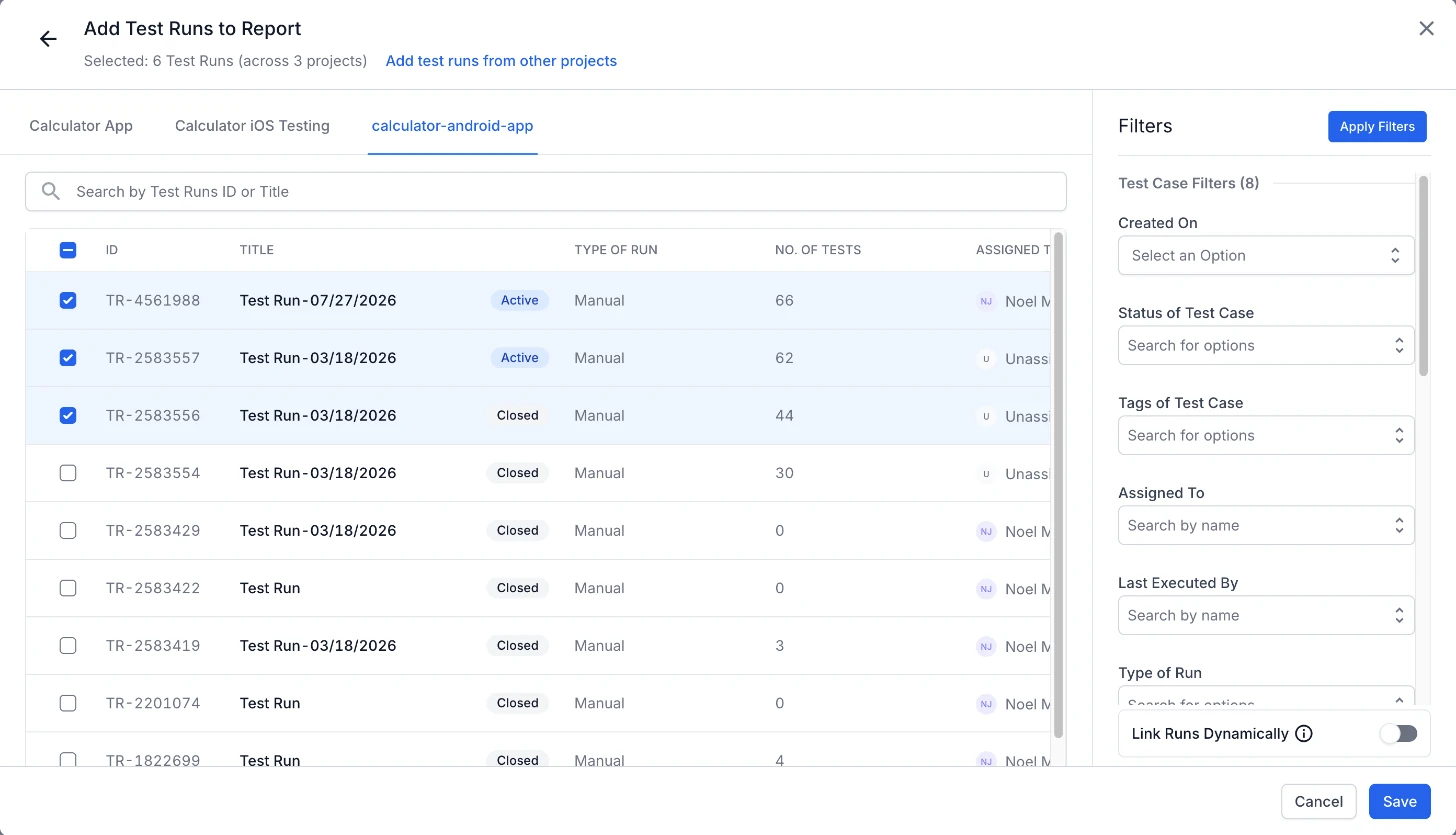
The panel header shows the running total, such as
Selected: 6 Test Runs (across 3 projects). -
To add or remove a project from inside the panel, click Add test runs from other projects. Change the projects in the Project field, and then click Save.
When you remove a project that has selected test runs, Test Management asks you to confirm. The removal drops those test runs from the report.
- Click Save at the bottom of the panel.
The Create Report window shows the number of test runs that you added. Continue with step 5 of Create a cross-project report.
View report data by project
A cross-project report shows combined numbers for all its projects. Use the following options to see which project each number comes from.
See the projects in a report
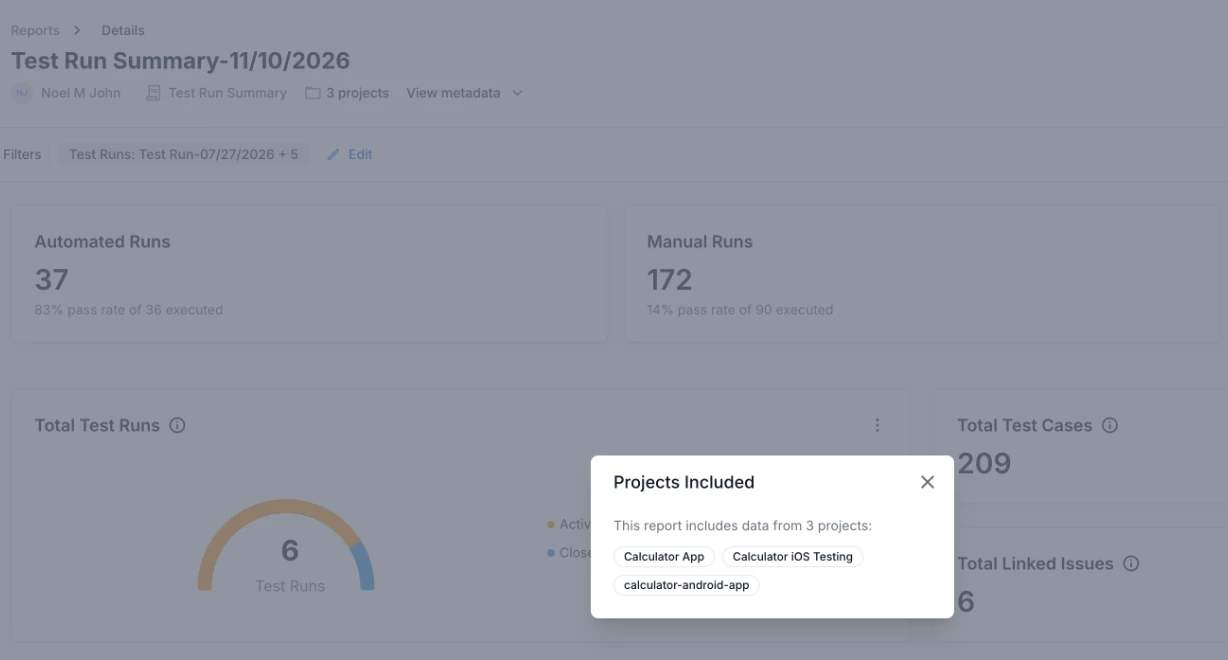
Click the project count below the report title, such as 3 projects. The Projects Included dialog lists every project in the report.
Break down a metric by project
A summary metric, such as Total Test Cases, is a total across all the projects in the report. To see the share of each project:
-
In the report, click a metric value, such as the number under Total Test Cases.
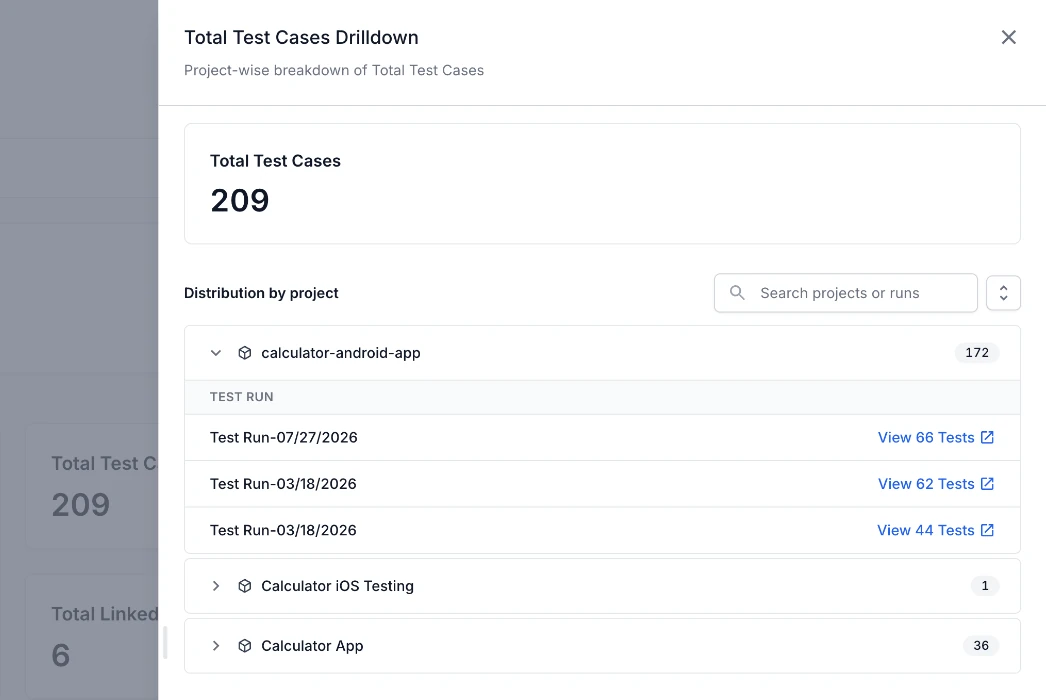
A drilldown panel opens. Under Distribution by project, each row shows one project and its share of the value. In a single-project report, the same panel groups the value by test run.
- To see the test runs behind a project’s value, expand the project row.
- To open the tests of a test run, click the link in its row, such as View 66 Tests.
In a test run summary report, you can break down the following metrics by project:
- Active Test Runs
- Closed Test Runs
- Total Test Cases
- Total Linked Issues
- Test Case Break-up
- Test Runs Break-up
- Issues by Priority
- Issues by Status
- Defects Linked with Test Results
- Requirements Linked with Test Runs
- Test Results across Assignees
Identify the project of each test case
In a cross-project test run detailed report, the table of test cases has a Project column. The column is always visible. Each row shows the project that the test case belongs to.

Find cross-project reports in the reports list
In the reports list, the Project column shows one project name and a count of the other projects. Hover over the count, such as +2, to see every project name.

When you filter the list by project, a cross-project report appears for any project that it includes.
Next steps
- Review the filters that each report type supports in advanced filters in reports.
- Send a cross-project report to other people with share and download options.
We're sorry to hear that. Please share your feedback so we can do better
Contact our Support team for immediate help while we work on improving our docs.
We're continuously improving our docs. We'd love to know what you liked
We're sorry to hear that. Please share your feedback so we can do better
Contact our Support team for immediate help while we work on improving our docs.
We're continuously improving our docs. We'd love to know what you liked
Thank you for your valuable feedback!