Agile testing is a crucial part of the Agile development process, emphasizing collaboration, flexibility, and rapid iterations to deliver high-quality software. To ensure effective testing, key metrics are used to align with these principles and track progress, quality, and efficiency throughout the development cycle.
Overview
Agile testing metrics are data-driven measures that help teams assess the efficiency, effectiveness, and quality of the testing process within Agile projects. These metrics provide insights into the progress, performance, and potential areas of improvement in testing.
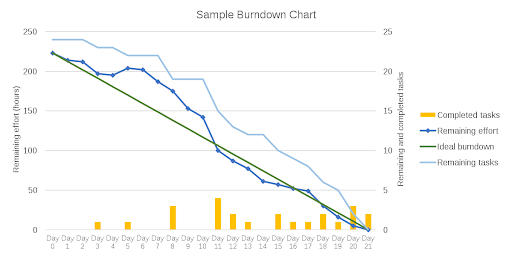
- Sprint Burndown: Tracks the remaining work in a sprint, helping teams visualize progress and manage timelines.
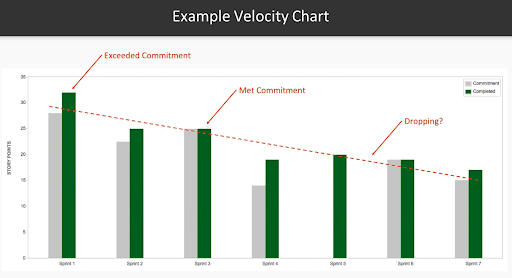
- Velocity: Measures the amount of work completed in each sprint, aiding in predicting future work capacity.
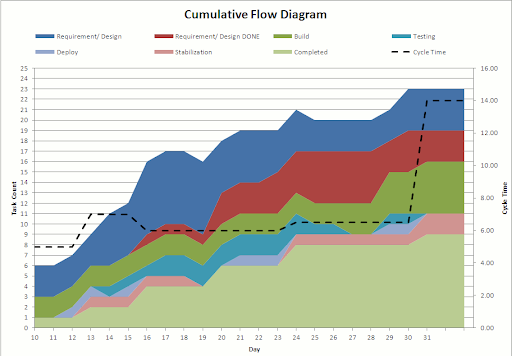
- Cumulative Flow: Visualizes the flow of tasks across different stages, highlighting bottlenecks and workflow efficiency.
- Earned Value Analysis: Assesses project performance by comparing planned progress with actual progress.
- Percentage of Automated Test Coverage: Indicates the extent of test automation, ensuring efficient regression testing.
- Code Complexity & Static Code Analysis: Measures the complexity of the codebase and identifies potential risks or maintenance challenges.
- Defects Found in Production/Escaped Defects: Tracks defects that make it to production, helping teams focus on improving early-stage testing.
- Defect Categories: Categorizes defects by severity and type, aiding in root cause analysis and prioritizing fixes.
This article explores key concepts such as Agile Testing, Agile Testing Metrics, and the benefits of tracking metrics and KPIs. It highlights the qualities of effective testing metrics and guides setting Agile KPIs.
What is Agile Testing?
Agile testing is an integral part of the Agile software development process, designed to provide continuous feedback throughout the development lifecycle.
Unlike traditional methodologies, where testing is a distinct phase that occurs after development, Agile testing begins early in the project, sometimes even before development, and continues throughout the entire process.
This continuous testing ensures that defects are identified and addressed early, fostering the “fail fast” principle that helps teams deliver high-quality software quickly.
In Agile, testing is not a separate activity but a collaborative, ongoing effort that works alongside development. Testers are considered an integral part of the Agile development team, and there are no isolated QA roles in many Agile organizations. Instead, developers and testers work together in cross-functional teams, where everyone shares responsibility for quality.
What are Agile Testing Metrics?
Agile testing metrics, often referred to as Agile quality metrics, are quantitative measures used to assess the effectiveness, efficiency, and progress of the testing process within an Agile development framework.
These metrics provide valuable insights into various aspects of the testing lifecycle, including test execution, defect tracking, team performance, and software quality.
By utilizing Agile quality metrics, teams can make data-driven decisions, identify bottlenecks, and continuously improve the overall quality of the product while ensuring Agile principles like continuous improvement and flexibility are maintained.
Benefits of Tracking Agile Metrics and KPIs
Tracking Agile metrics and Key Performance Indicators (KPIs) provides numerous advantages that help Agile teams improve both the testing process and overall project outcomes.
- Improved Decision-Making: Real-time insights for data-driven decisions, prioritization, and risk management.
- Enhanced Visibility and Transparency: Continuous tracking ensures alignment and early issue detection.
- Faster Problem Identification: Quickly detect bottlenecks, inefficiencies, and defects to address them promptly.
- Continuous Improvement: Metrics foster a culture of ongoing process optimization and refinement.
- Better Resource Allocation: Optimize resource use based on metric-driven insights.
- Quality Assurance: Track defect density, test pass rates, and automation for consistent software quality.
- Increased Team Accountability: Shared metrics boost collaboration, ownership, and responsibility.
- Optimized Delivery Speed: Metrics like velocity and lead time help streamline workflows for faster delivery.
- Alignment with Business Goals: Ensure testing efforts are aligned with broader business objectives like customer satisfaction and cost efficiency.
What are the qualities of the “right” testing metric for Agile teams?
Some of the commonly-agreed characteristics of the “right” agile testing metric are as follows:
- Essential to business objectives and growth: A metric should reflect the company’s primary growth objective. It can be month-on-month revenue growth or the number of new users acquired for a new company. For a more mature organization, it can be customer churn. Since the business objectives will vary from company to company and project to project, the metrics should also be unique.
- Allows improvement: Every metric chosen should allow room for improvement. These should ideally be incremental and pegged against an ideal value after starting from a baseline value. For eg, month-on-month revenue growth is an incremental metric. If a metric (such as customer satisfaction) is already at 100%, the goal might be to maintain that status.
- Opens the way for a strategy: A metric should not be calculated just for measurement. Once a metric sets a team’s goal, it also inspires them to ask relevant questions to formulate a plan.
- Easily trackable and explainable: The final hallmark of a good metric is that it should not be difficult to explain and should be as intuitive as possible.
Read More: Essential Metrics for the QA Process
Testing Metrics for Agile Testing that every tester must know
Software testing has evolved significantly from the days of the waterfall software development model. With an increasing induction of Agile methodologies, several key metrics used by the QA teams of old, including the number of test cases, are irrelevant to the bigger picture. Thus, it is important to understand which metrics are vital to improving software testing in an Agile SDLC.
Before enlisting the metrics themselves, it is interesting to transition from Waterfall to Agile testing metrics and see how vital Agile development metrics are repurposed by QA personnel to quantify the testing activity and measure software quality.
In the Waterfall model of yore, QA was separated from software development and performed by a specific QA team. The waterfall model was non-iterative and required each stage to be completed before the next could begin. An independent QA team would often define the test cases to determine if the software met the initial requirement specifications.
The QA Dashboard would focus on the software application and measure four key dimensions that are:
- Product Quality: The number and rate of defects utilized to measure software quality.
- Test Effectiveness: Code Coverage was used to provide an insight into test effectiveness. Also, QA focussed on requirements-based and functional tests, and these reports would also be used to measure the efficacy.
- Test Status: This would report the number of tests run, passes, blocked, etc, and provide a snapshot of the status of the testing
- Test Resources: This would record the time taken to test the software application and the cost.
Read More: Code Coverage vs Test Coverage: Differences
However, modern Agile development relies on collaborative effort across cross-functional teams. Thus, the above metrics have become less relevant as they fail to be relevant to the bigger picture for the team. Also, with testing and development becoming concurrent, it is imperative to use metrics that reflect this integrated approach. The unified goals and expectations of the Agile teams comprising both developers and testers help create new metrics that aid the whole team from a unified POV.
Generally, all Agile Test metrics can be classified into:
- Type 1: General Agile metrics adapted to be relevant to software testing.
- Type 2: Specific test metrics applicable to the Agile Development Environment.
These are described in some detail below:
Type 1 Agile Metrics
To effectively track and assess progress, Agile teams rely on Type 1 Agile Metrics, which focus on measuring the overall progress, efficiency, and value delivery throughout the development cycle. These metrics provide a clear picture of how well the team is performing in relation to its goals.
Sprint Burndown
Sprint Burndown charts are compulsorily used by Agile teams to graphically depict the rate at which tasks are completed and the amount of work remaining during a defined sprint.
Its relevance to Agile testing is as follows:
Since all completed tasks for an Agile sprint must have been tested, it can double up as a measure of % testing done. Also, The definition of done can include a condition such as “tested with 100 percent unit test code coverage”.
Number of Working Tested Features / Running Tested Features
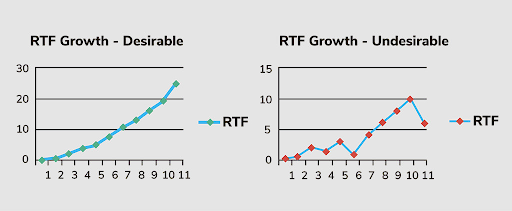
The Running Tested Features (RTF) metric indicates the number of fully developed software features that have passed all acceptance tests, thus becoming implemented in the integrated product.
Its relevance to Agile testing is as follows:
The RTF metric measures only those features that have passed all acceptance tests. Thus providing a benchmark for the amount of comprehensive testing concluded. Also, more features shipped to the client translate well into the parts of software tested.
Velocity
Velocity is an approach for measuring how much work a team completes on average during each sprint, comparing the Actual Completed Tasks with the team’s estimated efforts.
Agile test managers can use this to predict how rapidly a team can work towards a specific goal by comparing the average story points or hours committed to and completed in previous sprints.
Its relevance to Agile testing is as follows:
The quicker a team’s velocity, the faster it produces software features. Thus higher velocity can speed up the completion of software testing.
Read More: How to Accelerate Product Release Velocity
Cumulative Flow
The Cumulative Flow Diagram (CFD) provides summary information for a project, including work-in-progress, completed tasks, testing, velocity, and the current backlog.
It allows the visualization of bottlenecks in the Agile process. Colored bands that are disproportionately fat represent stages of the workflow for which there is too much work in progress. Thin bands represent stages in the process that are “starved” because previous stages are taking too long.
Its relevance to Agile testing is as follows:
As a mandatory part of the Agile workflow, testing is included in all CFDs. CFDs may be used to analyze whether testing is a bottleneck or whether other factors in the CFD are bottlenecks that might affect testing.
Earned Value Analysis
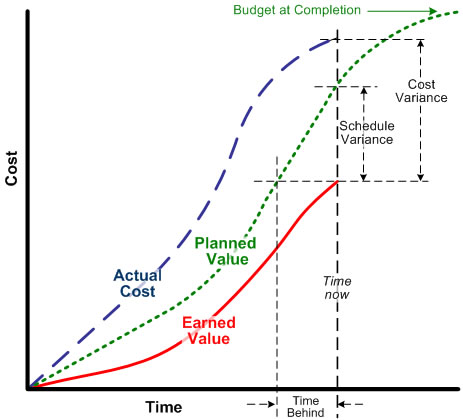
Earned Value Analysis (EVM) encompasses a series of measurements comparing a planned baseline value before the project begins with actual technical progress and hours spent on it. This is typically in the form of a dollar value and requires incorporating story points to measure earned value and planned value.
EVM methods can be used at many levels from a single task to the total project. It ends up looking something like this
Its relevance to Agile testing is as follows:
- EVM techniques in Agile can be used to determine the economic value of the software testing process
- EVM methods help to understand whether the software tests are cost-effective by comparing the planned value with earned value at the single task level.
Read More: How to calculator Test Automation ROI?
Type 2 Agile Metrics
Type 2 Agile Metrics focus on assessing the quality of the software, testing processes, and identifying potential risks. These metrics provide valuable insights into how well the team is ensuring product quality and managing defects throughout the development cycle.
Read More: Agile vs DevOps: What’s the Difference?
Unlike the previous metrics, which were standard Agile metrics repurposed to suit Agile Testing, the ones below are intended for specific purposes.
Percentage of Automated Test Coverage
It measures the percentage of test coverage obtained through automated testing. More tests should get automated with time, and ideally higher test coverage is expected.
It is critical for Agile teams because automation testing is one of the primary ways to ensure high test coverage. Test cases will only increase with added functionality at every sprint. Also, test coverage can serve as a basic measure of risk. The more test coverage attained, the lower the chances of production defects.
Read More: How do you ensure maximum test coverage?
Code Complexity & Static Code Analysis
Code complexity is calculated through cyclomatic complexity. It counts several linearly independent paths through a program’s source code, Static code analysis, and uses tools to examine the code without code execution. This process can unearth issues like lexical errors, syntax mistakes, and sometimes semantic errors.
Agile teams need to create simple, readable code to reduce defect counts, check the code structure and ensure it adheres to industry standards such as indentation, inline comments, and correct use of spacing.
Defects Found in Production/Escaped Defects
This counts the flaws for a release found after the release date by the customer instead of the QA team. These tend to be quite costly to fix, and it is crucial to analyze them carefully to ensure their reduction from a baseline value.
Agile teams can ensure continuous improvement in testing by defining the root cause of escaped defects and preventing their recurrence in subsequent releases. These can be represented per unit of time, per sprint, or release, providing specific insights into what went wrong with development or testing in a specific part of the project.
Defect Categories
It’s not enough to find defects and categorize them to obtain qualitative information. A software defect can be categorized into functionality errors, communication errors, security bugs, and security bugs. Pareto charts can represent these and identify the defect categories to improvise in subsequent sprints.
- Defect Cycle Time
This measures the time taken between starting work on fixing a bug and fully resolving it. As a rapid resolution of defects is critical for product release velocity, reducing the defect cycle time should be a priority for all Agile teams.
- Defect Spillover
It’s the number of unresolved defects in a particular sprint or iteration. Measuring spillover minimizes the chances of teams getting stuck in the future because of a build-up of technical debt and provides an idea of the team’s efficiency as a whole in dealing with such defects.
Read More: Defect Management in Software Testing
How to Set Agile KPIs
Setting Agile Key Performance Indicators (KPIs) is essential for measuring the success and progress of an Agile team in delivering high-quality software. To set effective Agile KPIs, follow these key steps:
- Align with Business Goals: KPIs should be directly linked to the overarching business objectives. Whether it’s improving customer satisfaction, reducing time-to-market, or increasing product quality, ensure that your KPIs reflect these goals.
- Define Clear, Measurable Objectives: KPIs should be specific, measurable, attainable, relevant, and time-bound (SMART).
- Involve the Entire Team: Agile is a collaborative approach, so setting KPIs should be a team effort. Include developers, testers, product owners, and stakeholders to ensure that the chosen KPIs reflect the team’s collective goals and challenges.
- Track Relevant Metrics: Focus on metrics that truly reflect progress toward the goals. For example, track metrics like velocity, sprint burndown, and defect density, depending on the team’s priorities and the stage of the project.
- Monitor and Adapt: Agile KPIs should not be static. Regularly review and adjust them to ensure they remain relevant as the project evolves. Sprint retrospectives and regular team reviews are great opportunities to assess KPI effectiveness and make necessary adjustments.
- Ensure Transparency and Visibility: Make KPIs visible to the entire team and stakeholders. Dashboards, burndown charts, and other visual tools can help ensure that everyone is on the same page and can track progress in real time.
- Focus on Quality and Efficiency: Agile KPIs should balance both quality and efficiency. While metrics like velocity help track productivity, quality-focused KPIs like defect resolution time and test coverage ensure that the product meets the expected standards.
- Review and Refine Regularly: Setting KPIs is an iterative process. Regularly review the KPIs’ relevance and adjust them to reflect changes in the project’s needs, team goals, and business objectives.
By carefully setting and tracking Agile KPIs, teams can ensure they are on track to deliver value, improve their processes, and achieve long-term success.
Conclusion
The Agile Software Development Life Cycle (SDLC) significantly differs from traditional Waterfall models, emphasizing flexibility, collaboration, and continuous delivery. As such, it is essential for QA leaders to adopt the right set of Agile testing metrics to ensure software quality.
These metrics are crucial for tracking sprint goals and maintaining focus on the finer details of each iteration. Accurate, refined metrics help testers stay aligned with project objectives and contribute to the overall success of the Agile process.
In Agile testing, the QA process heavily relies on real device testing to identify potential bugs that users might encounter. Without real device cloud environments, it becomes challenging to detect issues that could otherwise go unnoticed, impacting the accuracy of QA metrics and hindering the ability to track, monitor, and resolve bugs effectively.
Both manual and automated testing efforts depend on this accurate data to establish baselines and measure success.
BrowserStack offers a robust solution with its real device cloud, providing access to over 3500+ real browsers and devices for instant, on-demand testing.
This cloud-based platform integrates seamlessly with popular CI/CD tools such as Jira, Jenkins, TeamCity, and Travis CI, ensuring smooth testing workflows.
Additionally, BrowserStack’s built-in debugging tools allow testers to identify and resolve issues immediately, while the platform’s support for Cypress testing across 30+ browser versions enables instant, hassle-free parallelization.
This comprehensive testing environment ensures more reliable, accurate data for measuring and optimizing Agile testing metrics.


