As mobile browsing becomes the primary mode of access for many users, ensuring that websites perform optimally on mobile devices is essential. Debugging websites on Chrome for mobile involves overcoming unique challenges related to responsiveness, performance, and device compatibility.
This article outlines two methods for debugging websites on Mobile Chrome: Method 1: Android USB Debugging Mode, which provides direct debugging via USB, and Method 2: Interactive Chrome Debugging on Real Devices using BrowserStack, offering cloud-based testing on a variety of real mobile devices.
Method 1: Using Android USB Debugging Mode
Developers can leverage the Android USB debugging mode to debug websites on mobile Chrome. Assuming that the developer has an Android device for testing purposes, they need to follow the steps below to get started with website debugging on mobile Chrome.
Step 1: From the device Settings, enable the Developer options. To enable the Developer options, tap the Build Number option seven times.
Note: As per the official Android documentation, one can find this option in one of the following locations, depending on the Android version:
- Android 9 (API level 28) and higher: Settings > About Phone > Build Number
- Android 8.0.0 (API level 26) and Android 8.1.0 (API level 26): Settings > System > About Phone > Build Number
- Android 7.1 (API level 25) and lower: Settings > About Phone > Build Number
Step 2: Further, enable the USB debugging option in the Developer Options menu. One can find this option in one of the following locations, depending on the Android version:
- Android 9 (API level 28) and higher: Settings > System > Advanced > Developer Options > USB debugging
- Android 8.0.0 (API level 26) and Android 8.1.0 (API level 26): Settings > System > Developer Options > USB debugging
- Android 7.1 (API level 25) and lower: Settings > Developer Options > USB debugging
Step 3: Launch Chrome
Step 4: Navigate to – chrome://inspect#devices.
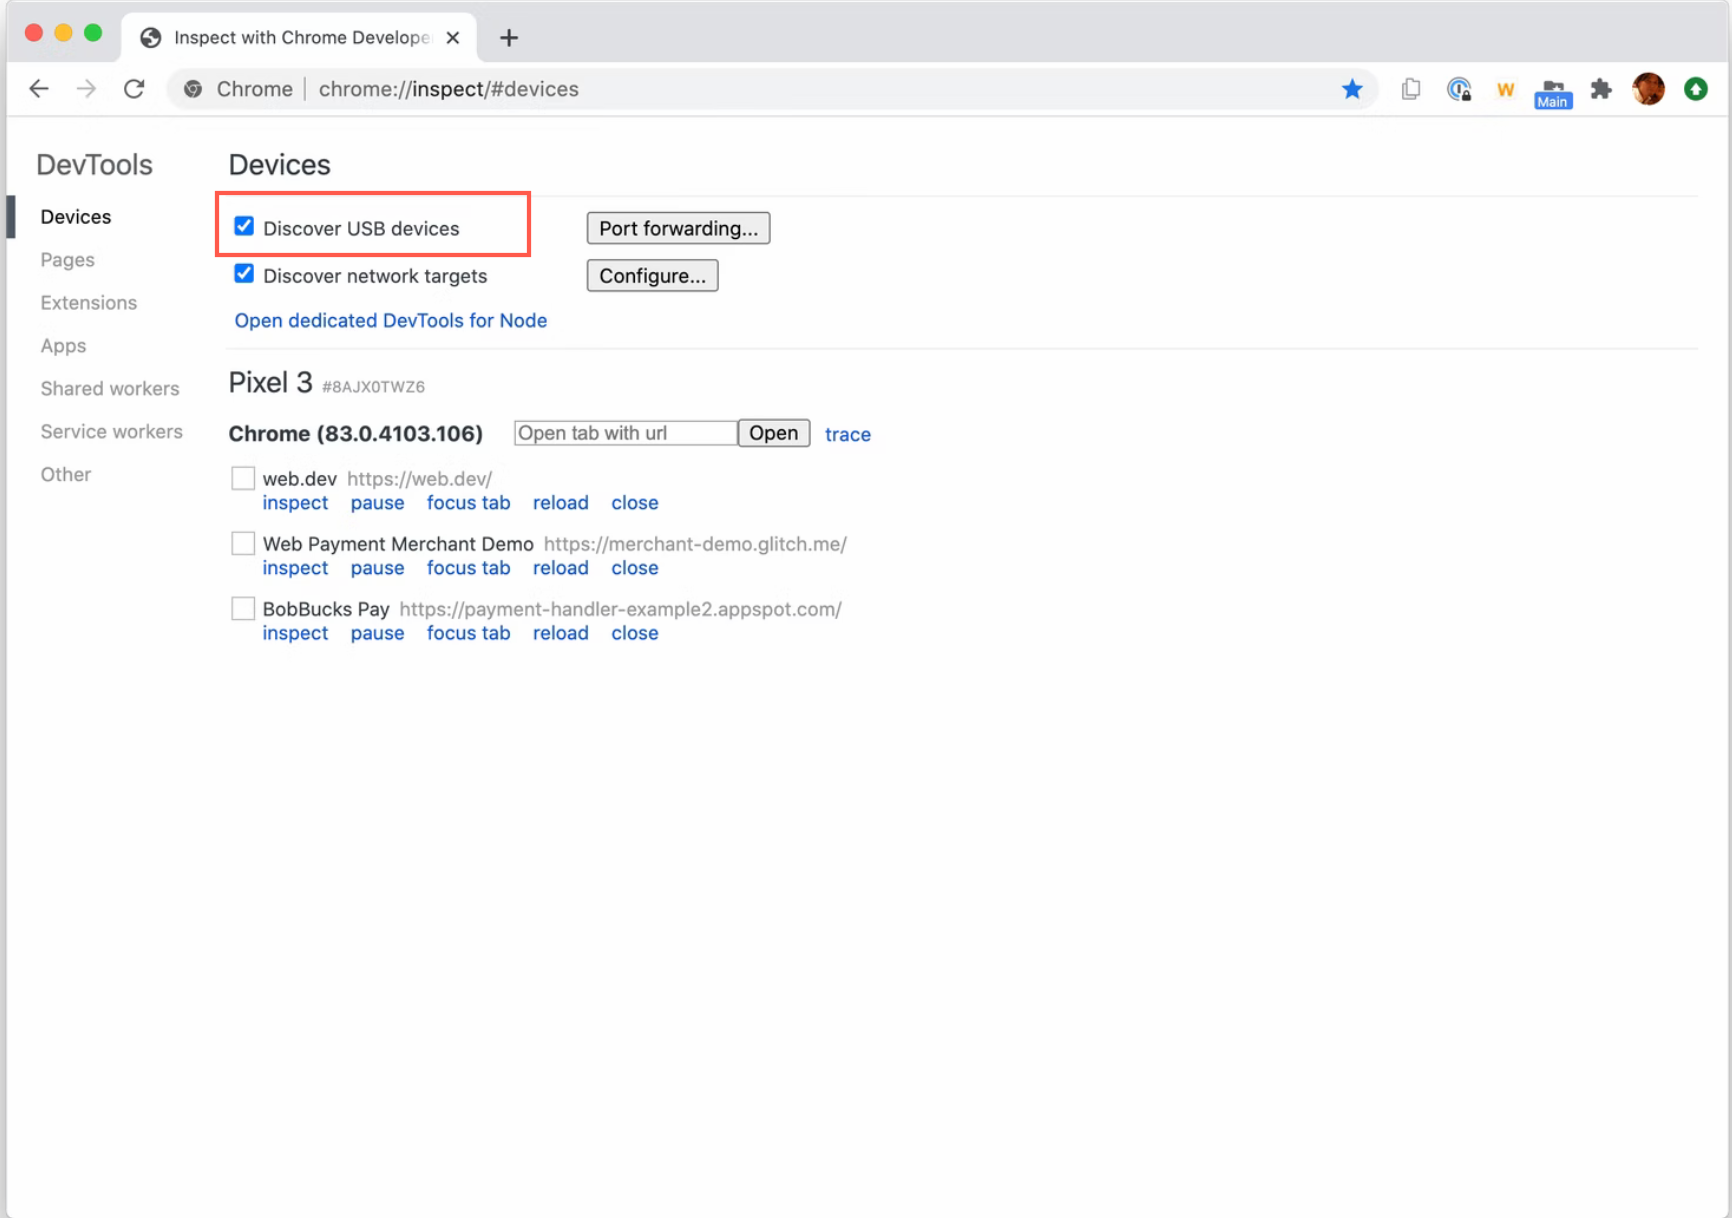
Step 5: Ensure that the Discover USB devices checkbox is enabled as seen below.
Step 6: Now, the developer needs to Connect the Android device directly to the development machine using a USB cable.
Note: If the model name of your Android device is displayed, then DevTools has successfully established the connection to your device. On the contrary, If the device is showing up as Offline, accept the Allow USB Debugging permission prompt on your Android device. Refer to the official documentation for learning about troubleshooting issues.
Step 7: Now, launch Chrome on the Android device.
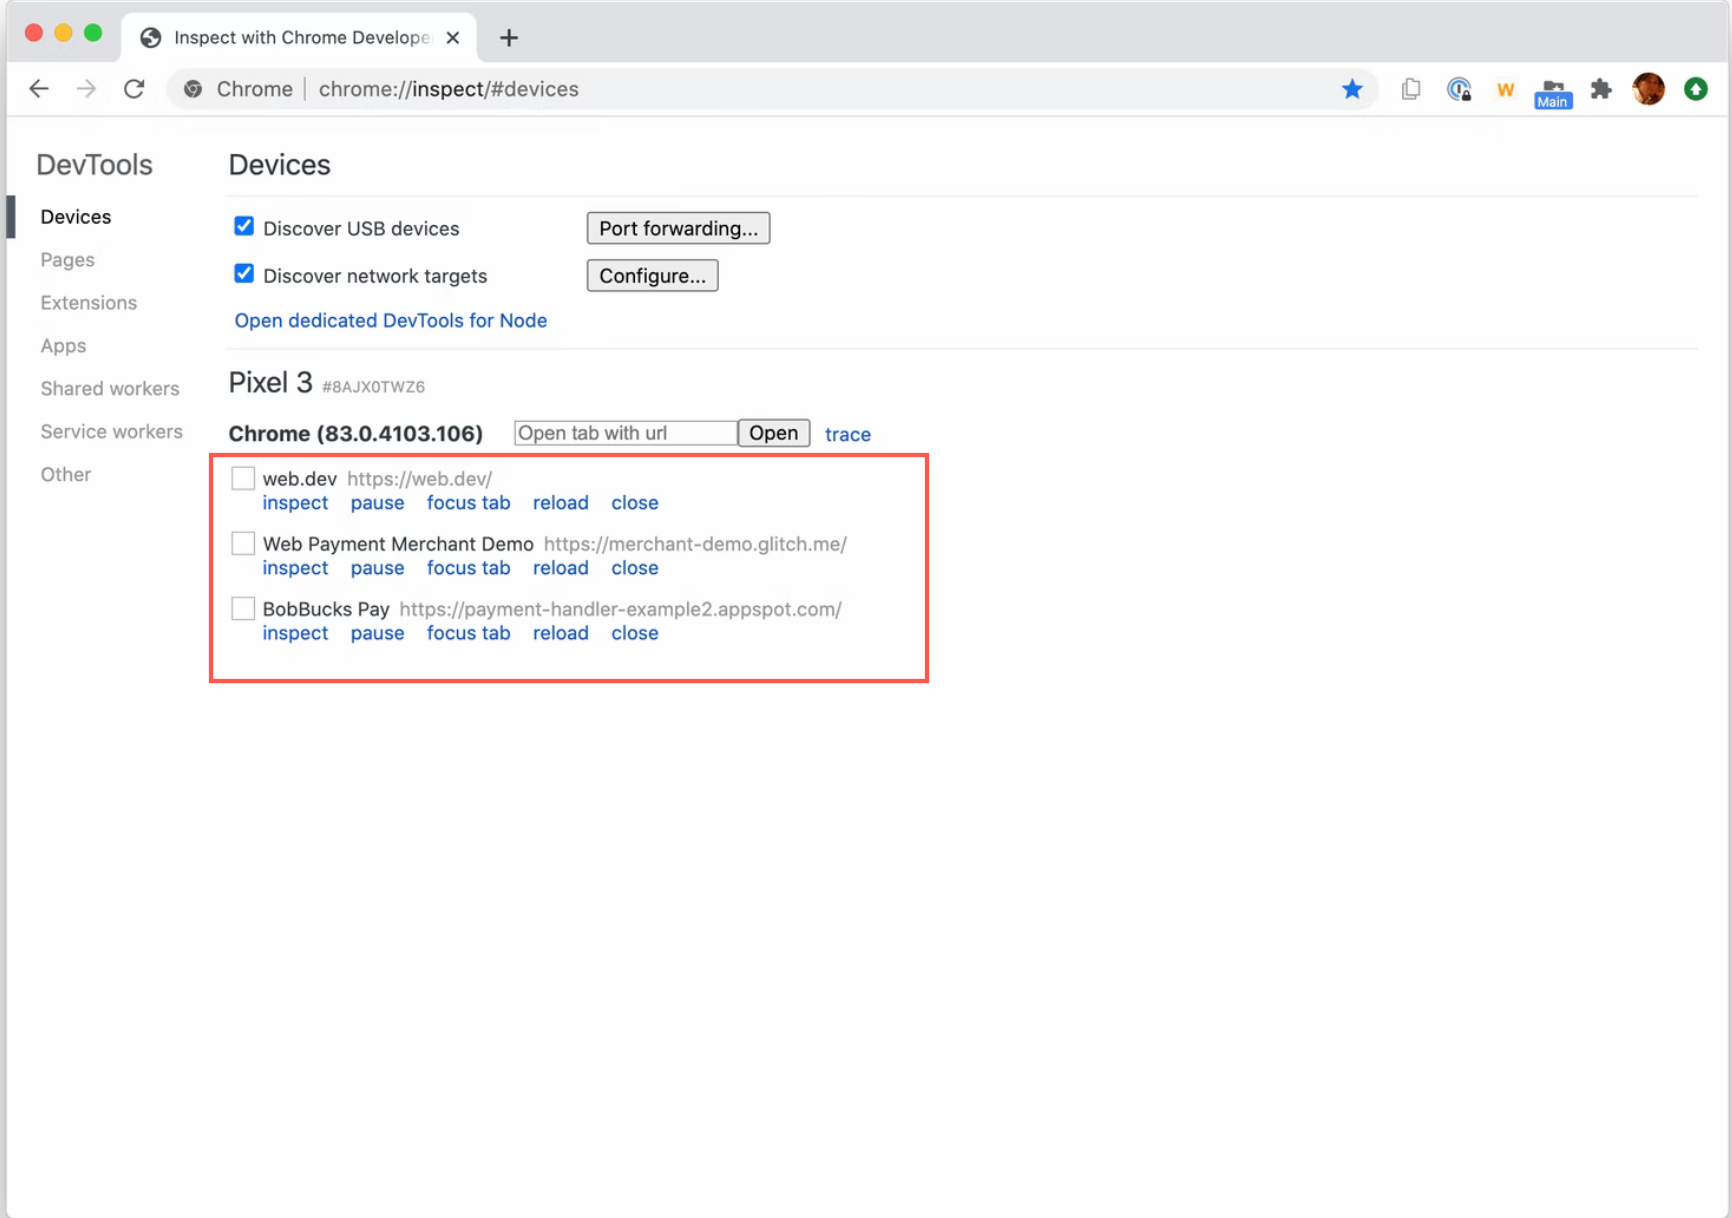
Step 8: On the chrome://inspect/#devices page, you see your Android device’s model name, followed by its serial number. The version of Chrome that’s running on the device is also displayed in the parentheses.
Step 9: A unique section is displayed for every open page in the mobile Chrome, and one can interact with the desired tab from this section.
Step 10: Enter a URL in the Open tab with the URL text box, and click Open. The page opens in a new account on your Android device.
Step 11: Now, click Inspect next to the URL that you just opened. A new DevTools instance opens.
Now you can start live Debugging for the desired web page on your mobile Chrome.

Method 2: Interactive Chrome Debugging on Real Mobile Devices using BrowserStack
In some cases, developers need to test or debug a website on mobile Chrome for a specific handset. Purchasing a new device every time for testing isn’t a scalable solution for most teams.
This is where BrowserStack comes in. It provides access to a real device cloud with over 3500+ real devices and browsers, enabling live, interactive testing and debugging on actual device-browser combinations. This eliminates the need for teams to invest in multiple devices, saving both time and cost.
With BrowserStack, developers can test and debug websites on handsets from leading manufacturers like Samsung, OnePlus, Motorola, Google, and others. The platform allows instant access to Chrome DevTools in live sessions, giving developers the ability to inspect and debug mobile Chrome directly on the selected Android device.
Step 1: Signup for free on BrowserStack Live.
Step 2: Navigate to the Live dashboard.
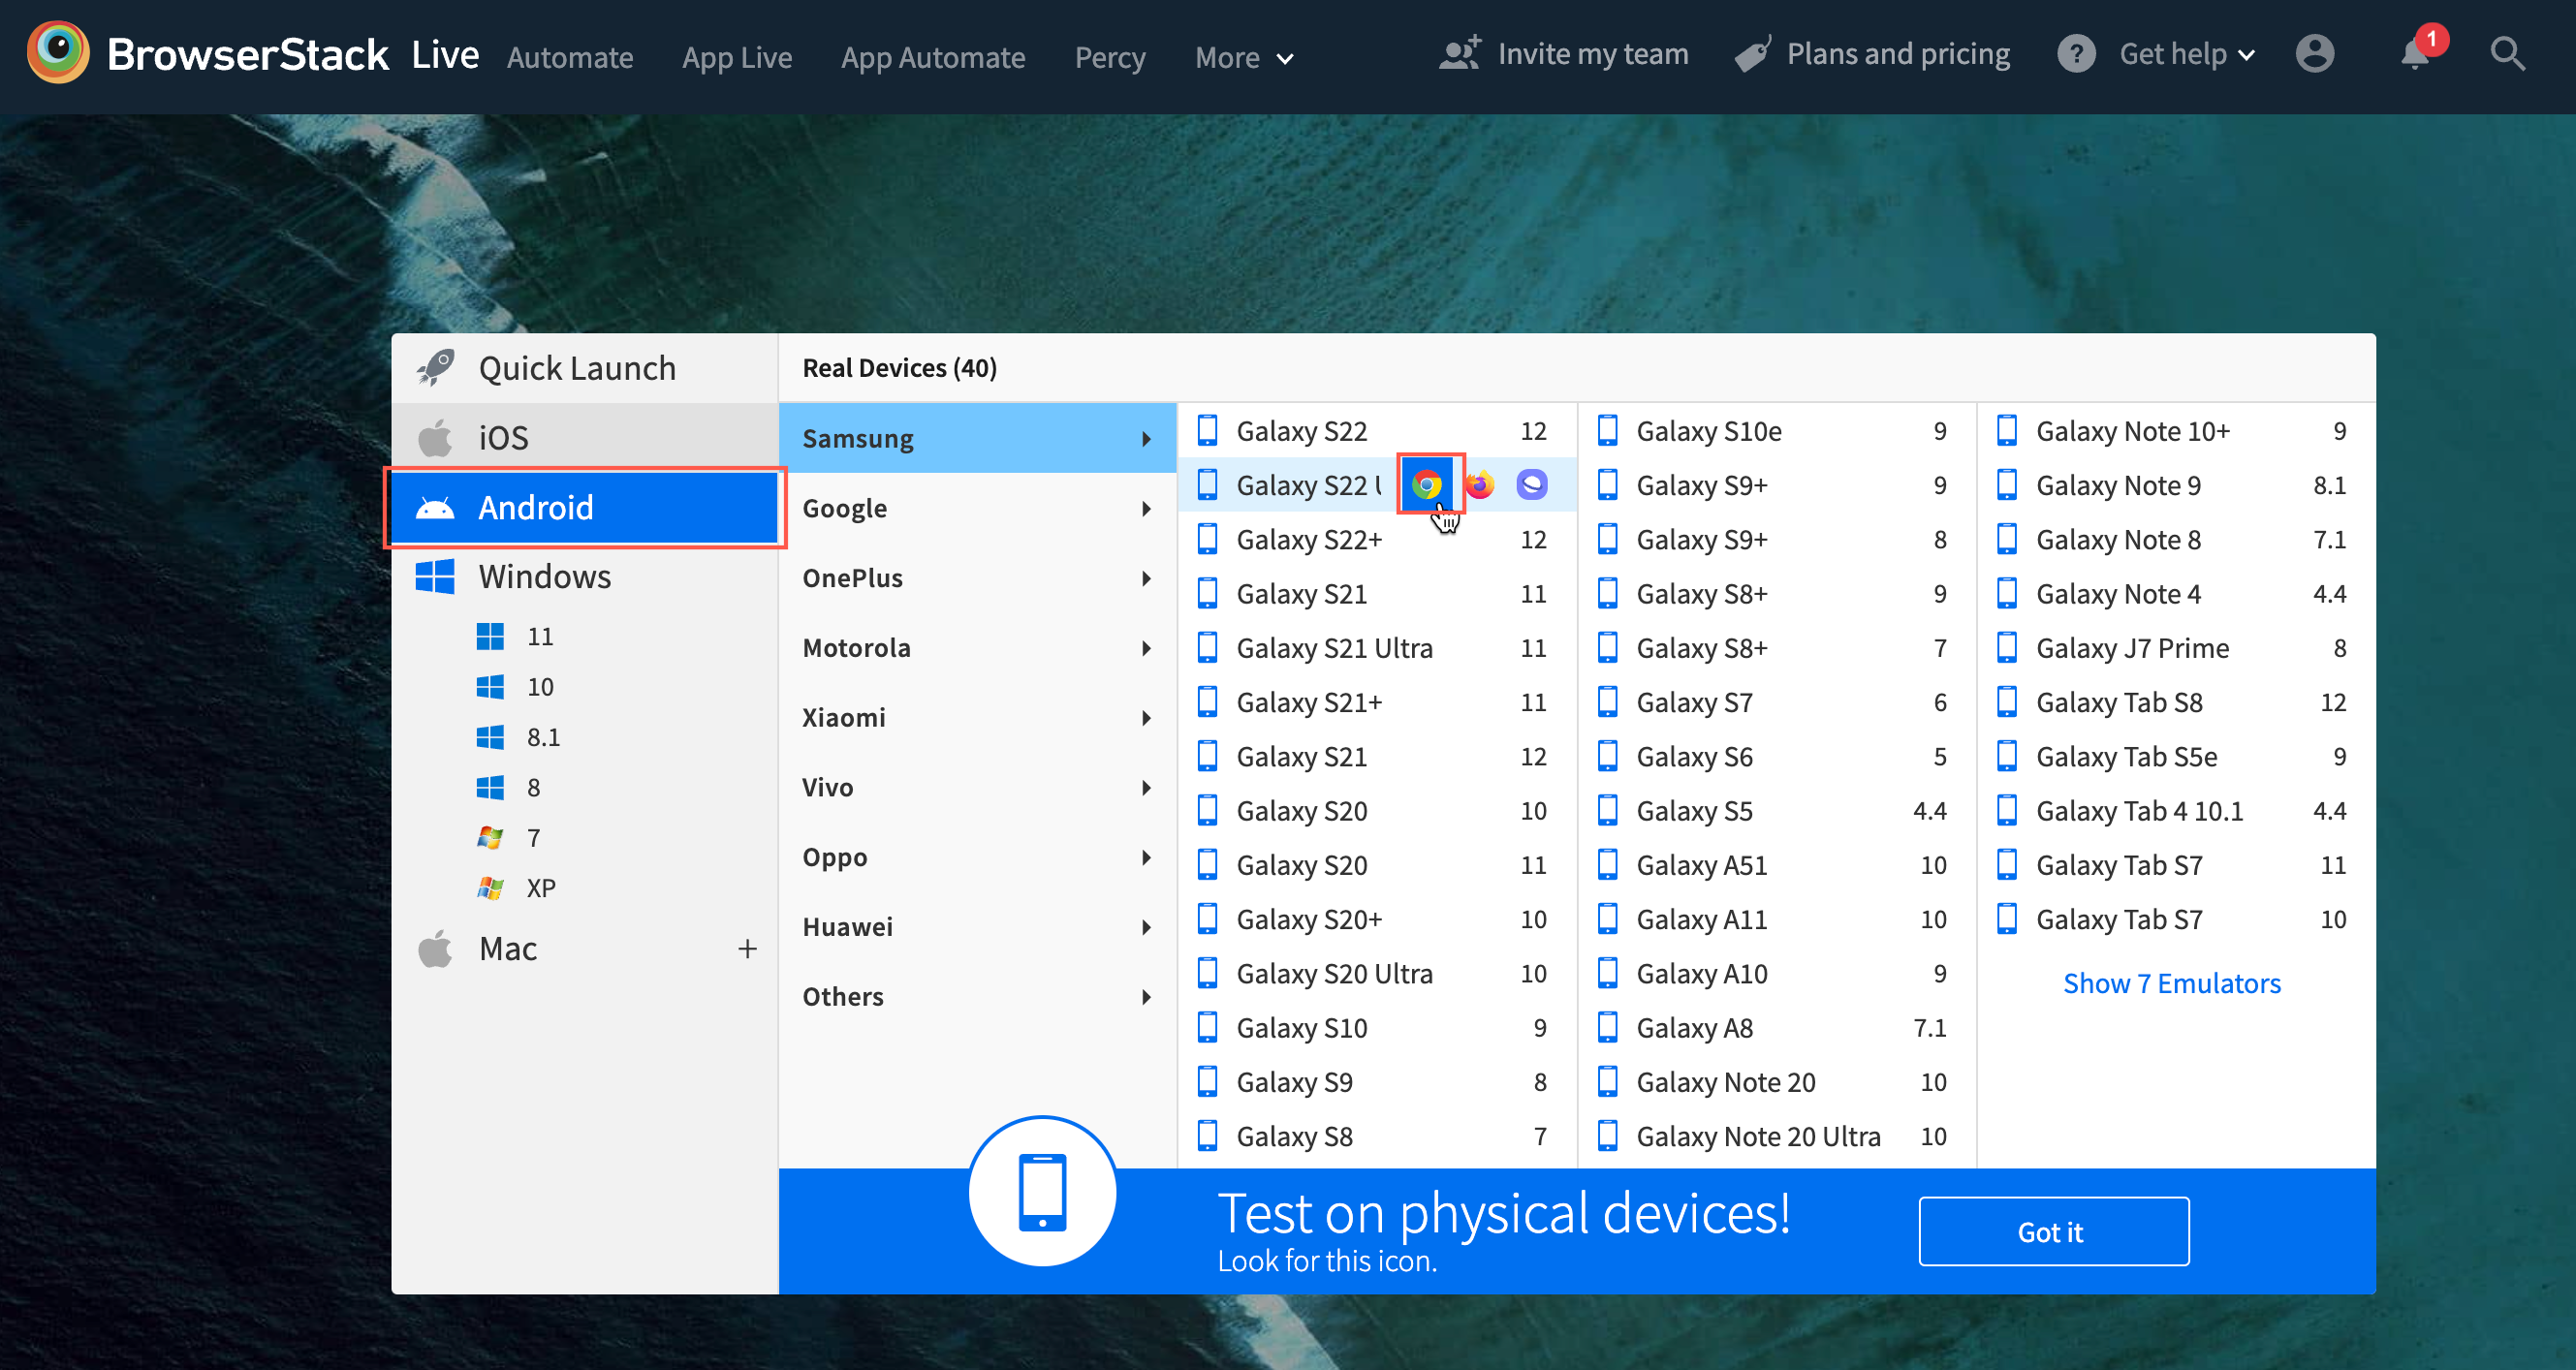
Step 3: From the dashboard, choose Android OS and hover on the desired handset. (For example, Samsung S22 ultra).
Step 4: Click on the Chrome logo once it appears after hovering.
Step 5: A new Live Chrome session will start instantly on a real Samsung S22 Ultra-Chrome once you click on the Chrome logo.
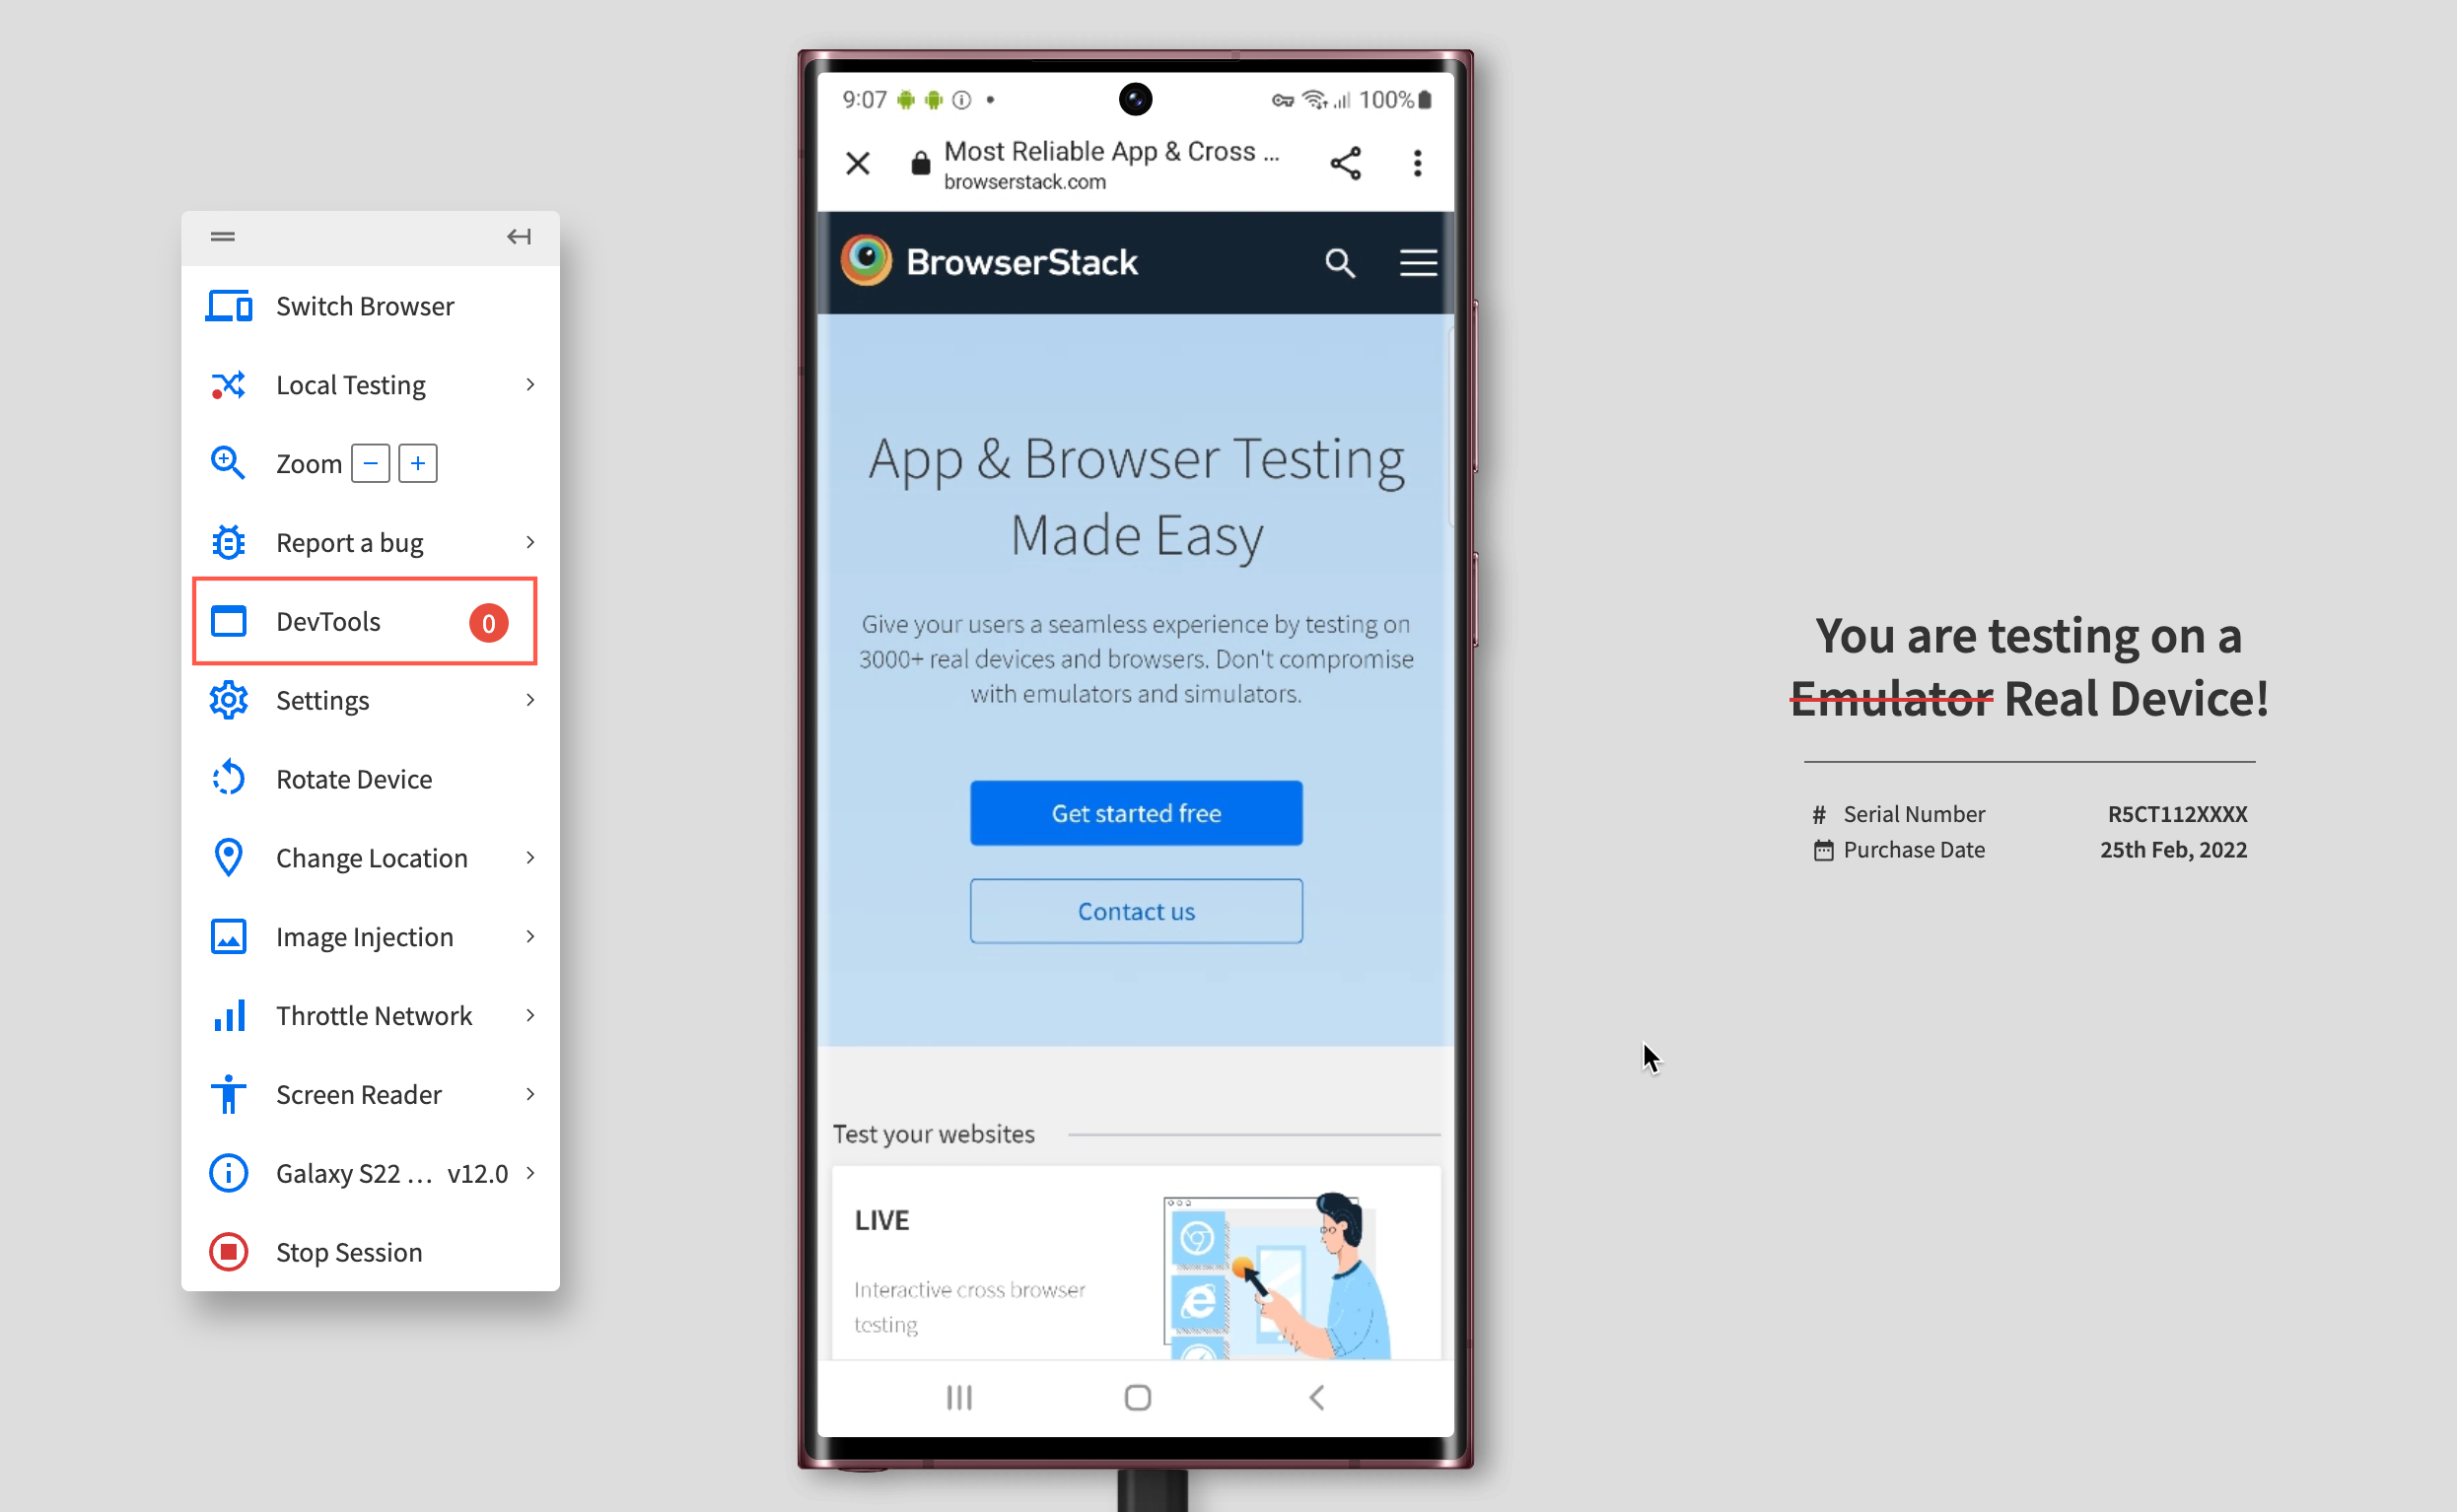
Step 6: Now one can start testing and debugging the desired web page using the Devtools available in the floating toolbar.
That’s how easily one can debug a website on Chrome for the desired real handset without any complex setup.
Debug a Website on Mobile Chrome Now
Additionally, teams also get access to multiple features available in the toolbar once a BrowserStack Live session begins:
- Geolocation testing allows users to examine a website’s performance on mobile when accessed from a unique geographical location.
- Instant bug reporting (through Jira, Trello, Slack, Github) enables the users to report bugs to their team directly from the Live dashboard.
- Responsive testing allows users to test websites in distinct screen resolutions (like 1024×768, 1280×800, 1820×1024, and so on).
- Local Testing enables users to test and debug work-in-progress web applications at scale in local environments without hosting them in public staging environments.
- Network throttler lets the QAs test the website’s performance in poor network conditions.
Why Choose BrowserStack?
When it comes to mobile web testing, accuracy, speed, and flexibility are essential. BrowserStack provides an all-in-one solution for debugging websites on Mobile Chrome, offering access to a wide range of real devices and browsers.
By testing on actual devices, developers can ensure that their websites perform as expected under real user conditions, eliminating the uncertainty that comes with using emulators or simulators.
Beyond just debugging, BrowserStack enhances the testing experience with a suite of powerful features available during Live sessions:
- Geolocation Testing: This feature enables users to simulate accessing a website from different geographical locations, helping developers test how location-based services and content behave in varying regions.
- Instant Bug Reporting: Teams can seamlessly report bugs directly from the Live session dashboard, with integrations available for Jira, Trello, Slack, and Github. This streamlines collaboration and ensures issues are quickly logged and tracked.
- Responsive Testing: Developers can test websites on various screen resolutions (such as 1024×768, 1280×800, 1820×1024) to verify that the layout and design adapt correctly across different device sizes.
- Local Testing: This feature allows developers to test and debug websites in local or development environments without hosting them in a public staging area. This is especially useful for testing in-progress web applications before they are deployed publicly.
- Network Simulation: It allows developers to simulate different network conditions, allowing them to test how websites perform under slow or unreliable internet connections. This ensures the site remains functional even in less-than-ideal conditions.
Conclusion
Debugging on Chrome can be tricky in some cases, particularly when a bug needs to be traced on a specific handset. The methods explained above will help developers and QAs effectively test and debug websites on mobile Chrome without any complex setup. No matter which method you choose, testing on real devices helps understand the bottlenecks faced under real user conditions for accurate test results.

