Apple’s Safari is a widely used web browser across millions of iPhones, iPads, and Mac devices worldwide. Ensuring that your website performs reliably on Safari is essential for delivering a seamless user experience. Safari Developer Tools provide built-in capabilities to inspect, debug, and optimize web applications on Apple devices. Testing across different Safari versions helps identify browser-specific issues before release.
Overview
Enable Developer Tools To Debug Safari Website
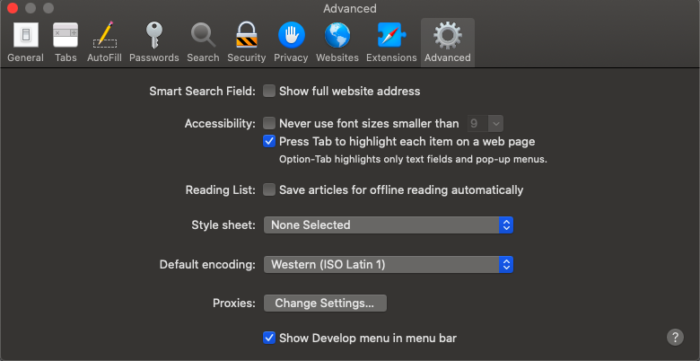
- Path: Safari → Preferences → Advanced → “Show Develop menu in menu bar”
- Web Inspector: Develop → Show Web Inspector
- Console Shortcut: ⌥ + ⌘ + C
Safari Website Debugging Methods
A. Responsive Design Mode (Mac)
Use: Test mobile layouts without a physical device.
Steps:
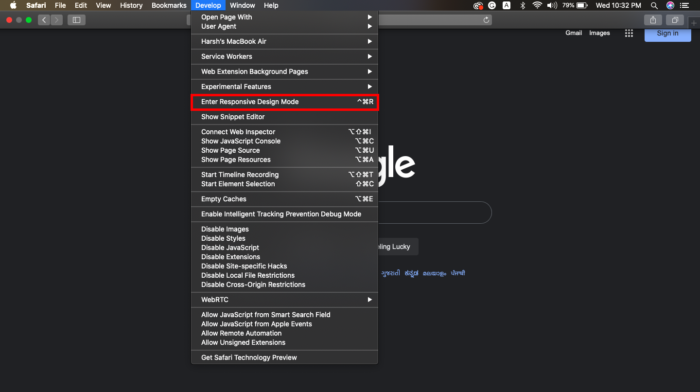
- Develop → Enter Responsive Design Mode
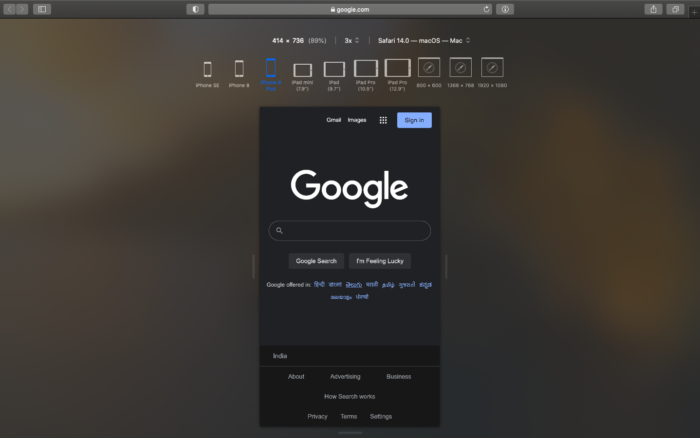
- Select device model (iPhone, iPad)
- Inspect elements via Web Inspector
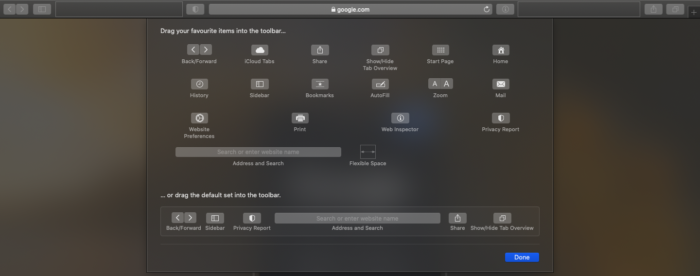
Tip: Drag Web Inspector icon to toolbar for quick access.
B. Debug Console
Use: Identify JavaScript errors, logs, and runtime issues.
Steps:
- Develop → Show JavaScript Console
- Inspect Console tab messages
- Execute commands directly to test fixes
Key Safari Developer Tools
- Inspector – Inspect HTML, CSS, JS, network resources
- Console – Log errors, test JS code, debug runtime issues
- Debugger – Set breakpoints & step through JS code
- Network – Monitor requests, size, and timing
- Resources – View & edit page resources (scripts, images, stylesheets)
- Timeline – Analyze performance: load, render, memory
This guide explains how to debug websites using Safari Developer Tools and alternative solutions like BrowserStack Live.
What is Safari Developer Tools?
Safari Developer Tools is a set of web development tools built into Apple’s Safari web browser. It allows developers to inspect, debug, and optimize their web applications.
It has several components as follows:
- Inspector: It allows developers to inspect the HTML, CSS, and JavaScript code of a web page, as well as the network traffic and resources loaded by the page.
- Console: It enables developers to log messages and errors from JavaScript code running on the page, as well as execute JavaScript commands directly in the browser.
- Debugger: It allows developers to set breakpoints in their JavaScript code and step through the code to identify and fix issues.
- Network: The Network tab allows developers to monitor the network requests made by the web page, including the timing and size of each request.
- Resources: The Resources tab allows developers to view and modify the resources loaded by the web page, such as images, scripts, and stylesheets.
- Timeline: The Timeline tab allows developers to record and analyze the performance of the web page over time, including the time it takes to load and render the page.
Before moving on to the debugging process, let’s understand what bugs are and what the process of debugging encompasses.
Random glitches are commonly experienced in web applications. It can be in the form of an app crash, screen freeze, or other functionality issues. These glitches or errors arise mainly due to ‘bugs’ in the website’s source code. The debugging process involves the detection and rectification of the faulty component of the source code or bugs.
You can debug the bugs in your website using the iOS Safari Developer Tools or BrowserStack Live.
| Debugging using iOS Safari Developer Tools | Debugging using BrowserStack’s Live [Recommended] |
|---|---|
| You need to plug in Physical Devices. | You just need to Sign up to BrowserStack |
| You must enable Web Inspector. | You can access more than 3000+ real browsers and devices on the cloud. |
| You must enable the Develop menu to access the dev tools in Safari. | You can seamlessly navigate to a website on Safari using a real iPhone or any device. |
| You need to replicate the bugs and debug them on the device. | You can use built-in DevTools to debug the website. |
| You can easily switch and test websites on multiple real iPhones and Safari browser versions. You do not need any physical devices. |
Debug Websites using the Safari Developer Tools
Let us start with the question, What are Safari developer tools?
Safari Developer tools are specific to Apple devices that can be used to debug your websites. Below are some of the methods that can be used to debug websites using the Dev tools in Safari.
Method 1: Debug Websites using the Responsive Design Mode on Safari
Responsive Design mode helps you to debug the mobile version of a website. To debug your website using the Responsive Design mode on Safari, follow the steps mentioned below:
- Enable the Developer Menu. To do that, launch the Safari Browser on your Mac computer. Go to Preferences > Advanced and check the Show Develop menu in the menu bar.
- Navigate to the website you want to debug. Go to Develop > Enter Responsive Design Mode from the Develop menu.
- View the mobile version of a website by selecting the particular model from the screen.
- Now, if you want to debug a website with a specific defect for a particular screen size or review a particular webpage element, you need to use the Web Inspector on the Safari Developer Tools.
- To enable Web Inspector, go to Develop > Show Web Inspector
- Then, click View > Customise Toolbar. In the dialog box, drag the Web Inspector icon and place it in the toolbar. You will see that the Web Inspector icon appears on the toolbar.
- Navigate to the webpage of your choice (say google.com) and select the device type (iPhone 8 Plus).
- Click the Web Inspector icon to open the inspector. Now, you can inspect, preview, or debug the web pages directly from the Mac computer. You can click on the elements from the Web Inspector toolbar and debug the web page.
Also Read: How to Debug Websites on iPhone Safari

How to use Safari debug console menu to identify errors?
In order to debug errors using the Safari debug console menu, you must:
- Activate the developer mode – Safari > Preferences > Advanced > Develop > Show Error Console.
- Close the tab.
- Next, open the console by selecting Develop > Show JavaScript Console.
- Select the Console tab. Alternatively, you can also open the Safari debug console using the shortcut option + command + C on Mac.
Method 2: Debug Websites using BrowserStack Live
BrowserStack offers a real device cloud with more than 3000+ real browsers and devices. Testers can seamlessly log in and conduct manual and automated tests of websites and applications. The advantage of using BrowserStack is that you don’t need to purchase a new device or install different browsers or operating systems for testing.
To debug the websites on real iPhones and iPads using BrowserStack Live, follow the steps mentioned below:
- Sign up and create a free account on BrowserStack’s Live platform.
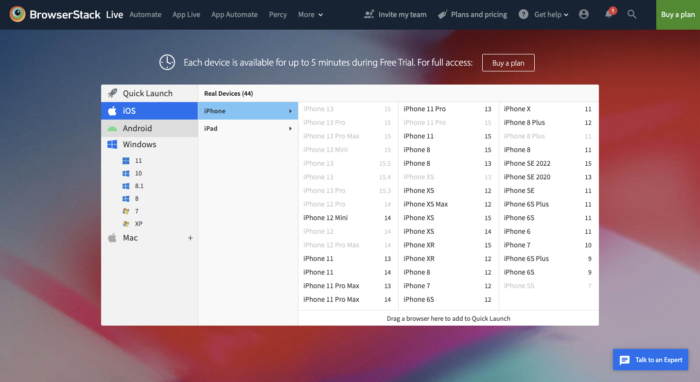
- Go to the Live Dashboard and select iOS from the Operating System
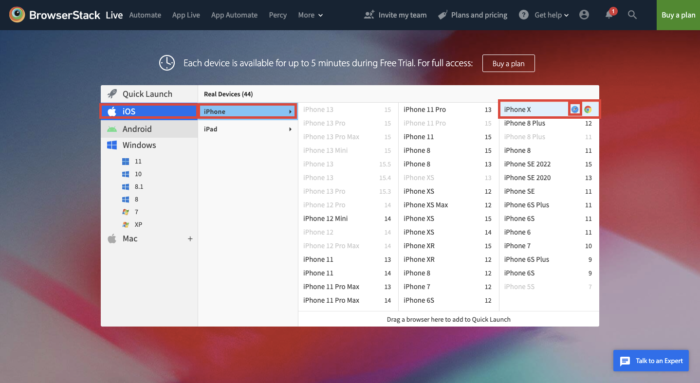
- Then, hover the cursor over the device you are experiencing issues with. Let’s make the assumptions for the device to be iPhone and the model to be iPhone X.
- As soon as you do that, you can view the browser options. Select the Safari option.
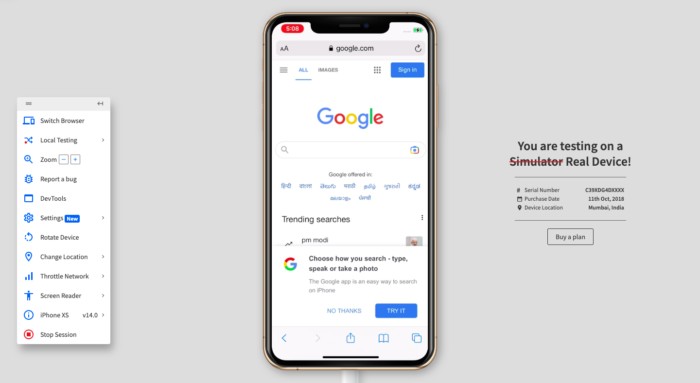
- Then, a real Safari browser will start loading on a real iPhone X from our device cloud.
- Now, you can visit any website on the Safari browser dashboard. Let’s assume we want to debug the Google homepage.
- Using the DevTools from the toolbar, you can explore the specific webpage elements and start debugging under real user conditions.

