Cypress testing framework is a popular end-to-end automation tool favored by QAs for its many features. One of those features is its debuggability. The Cypress debugger provides readable error messages that help testers debug quickly. It even allows debugging using popular developer tools.
Overview
Cypress offers a variety of built-in tools and commands that make debugging straightforward for developers and QA teams.
Methods to debug in Cypress
- Using stack trace
- Using debugger
- Using console logs
- Using .debug() command
- Using .pause() command
This article explores debugging methods in Cypress, including Cypress logs, Cypress log elements, and Visual Studio Code IDE.
Why is debugging important?
Debugging is a key factor when selecting an automation framework. For instance, if a test script spans ten lines and results in an error or failure, it becomes essential to investigate the cause. While trial-and-error can be used to pinpoint the issue, it is often time-consuming and inefficient, requiring multiple test runs and code adjustments.
A framework with strong debugging capabilities significantly speeds up this process, allowing testers to identify and fix issues in minutes rather than hours. Effective debugging tools typically offer:
- Clear and readable error messages
- The ability to pause test execution
- The flexibility to modify script values at runtime
With these features, testers can efficiently trace problems and apply accurate fixes, improving both test reliability and development speed.
Tools like BrowserStack enhance this further by enabling Cypress tests to run on real devices and browsers. It provides features like screenshots, video recordings, and access to test logs to help teams quickly identify and fix issues during debugging.
How to debug in Cypress
To start debugging in Cypress, ensure that Cypress is installed. Once set up, you can easily debug your test scripts, which helps improve test stability, reduce flaky tests, and ensure accurate test results.
1. Debug Cypress tests using the stack trace
Here is a simple test script:
describe('Verify Browser Stack Home Page', () => {

    it('Verify Browserstack logo is visible', () => {

        cy.visit('https://www.browserstack.com/');

        cy.get('#logo').should('be.visible');

    })

    it('Click on Product Menu', () => {

        cy.get('#product-menu-toggle1').click();

    })

})
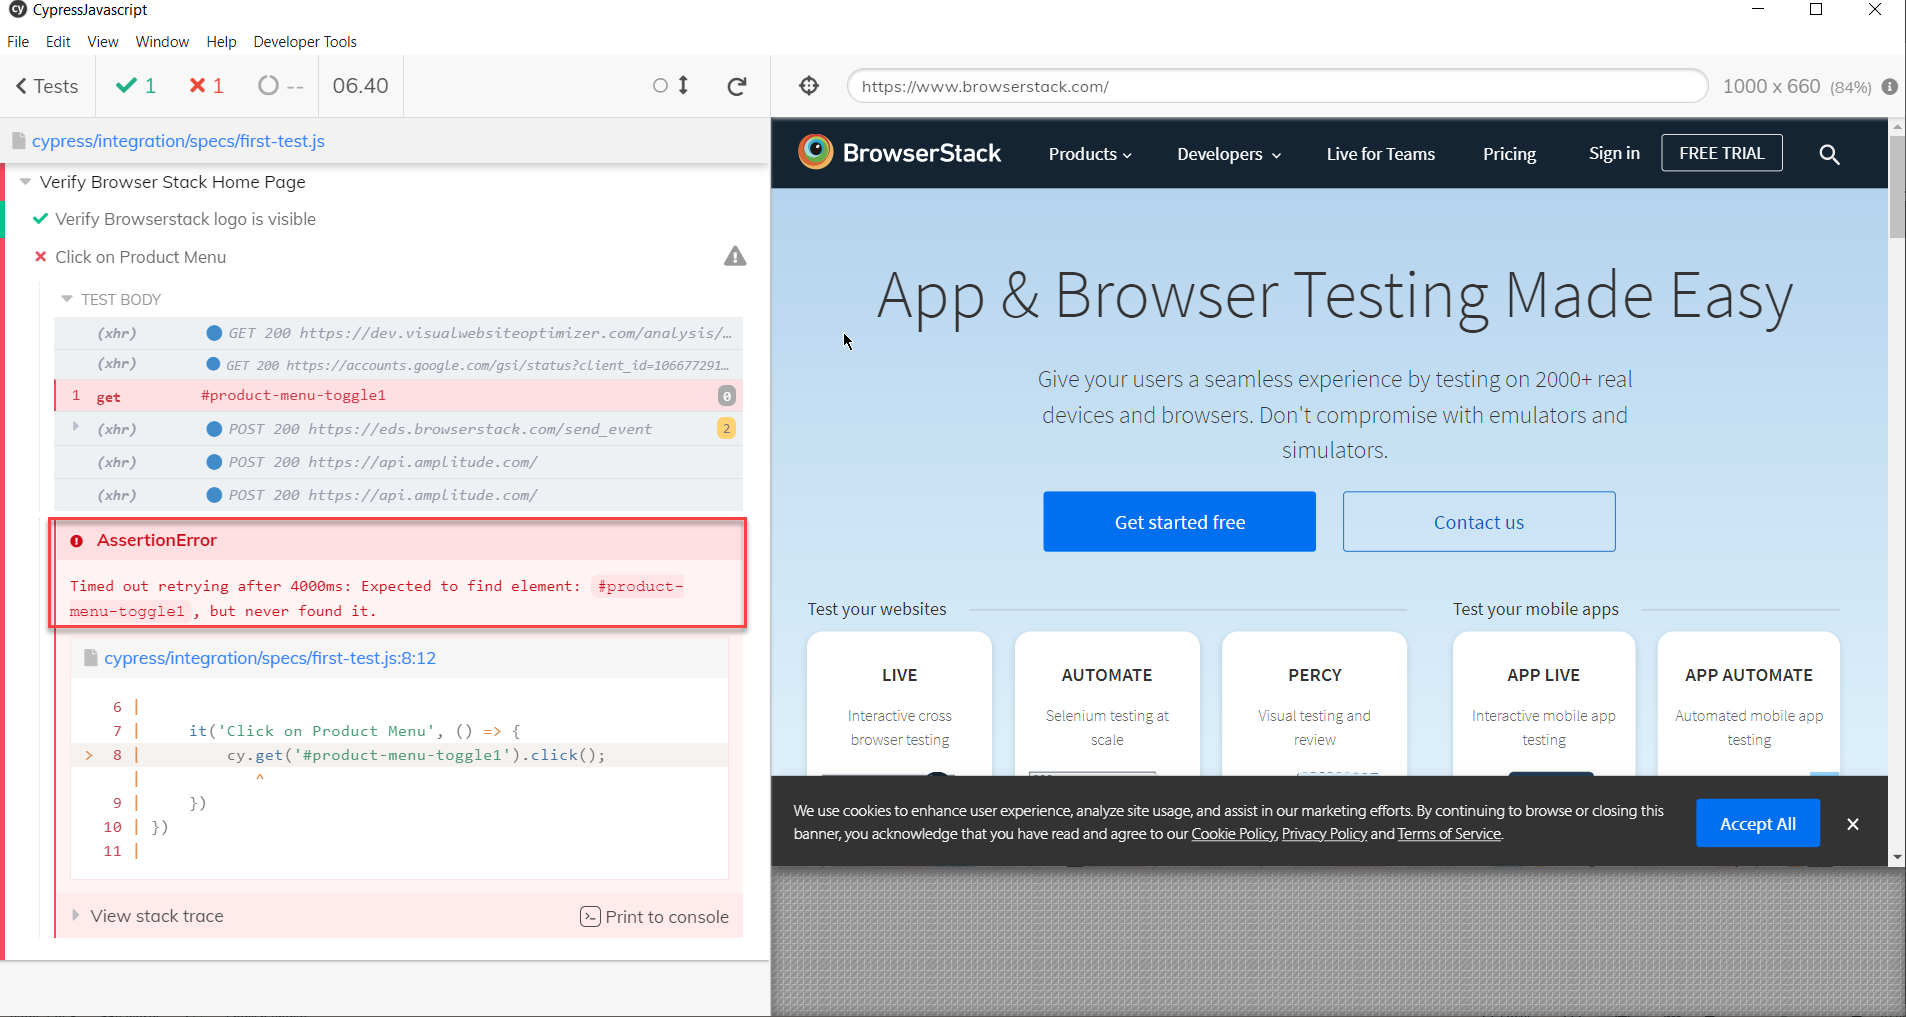
In the code above, the selector #product-menu-toggle1′ doesn’t exist in https://www.browserstack.com. So when the script runs, Cypress throws up a clear error message.
Testers can use the View stack trace option to view the detailed stack trace, and can even print the stack trace to the browser console as follows:
Timed out retrying after 4000ms: Expected to find element: #product-menu-toggle1, but never found it.
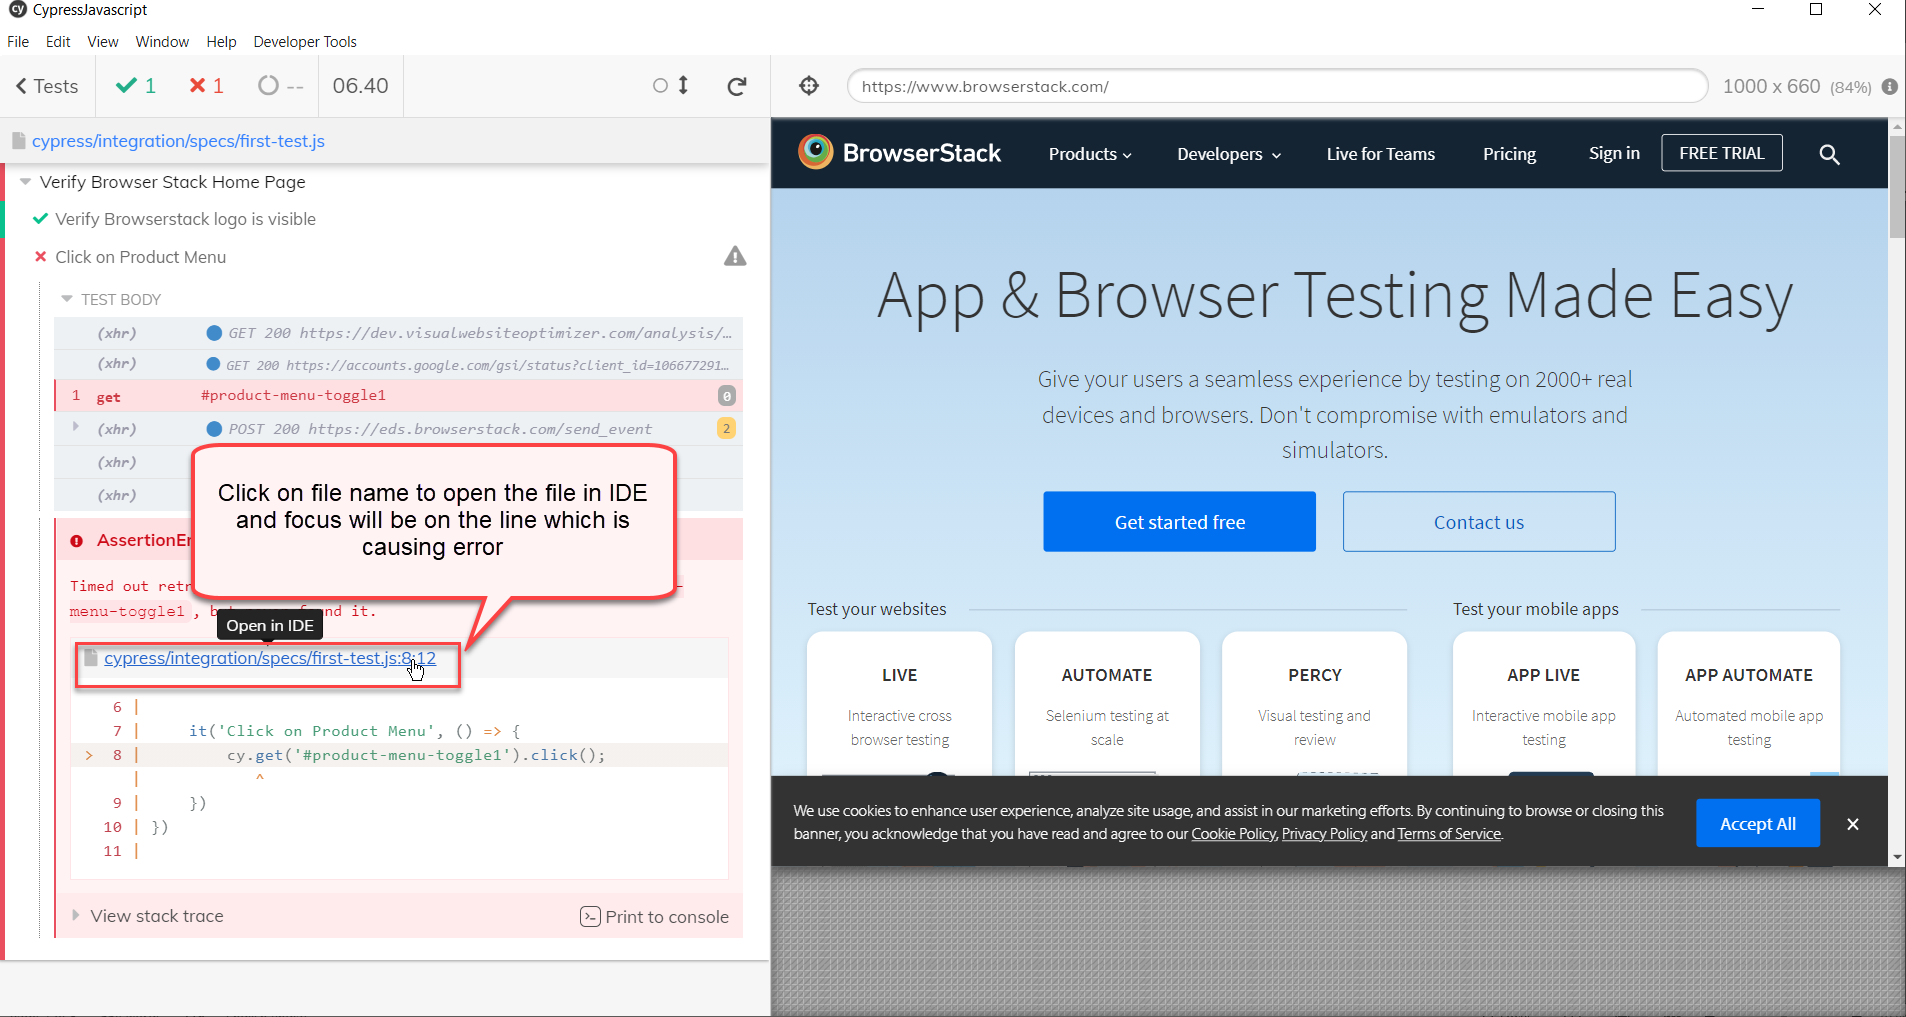
Cypress even allows the option to open the error-containing line in the IDE if one configured the Cypress IDE / File Opener options beforehand.
How to configure Cypress IDE/File Opener Options in Cypress
With Cypress, one can directly open files from a stack trace in their IDE. For example, suppose a tester sets the File Opener preference as Visual Studio Code IDE, then from stack track. In that case, they can directly open the file causing the error, and the cursor focus will be on the exact line with the error.
This is useful as testers don’t have to search and open files and lines with issues.
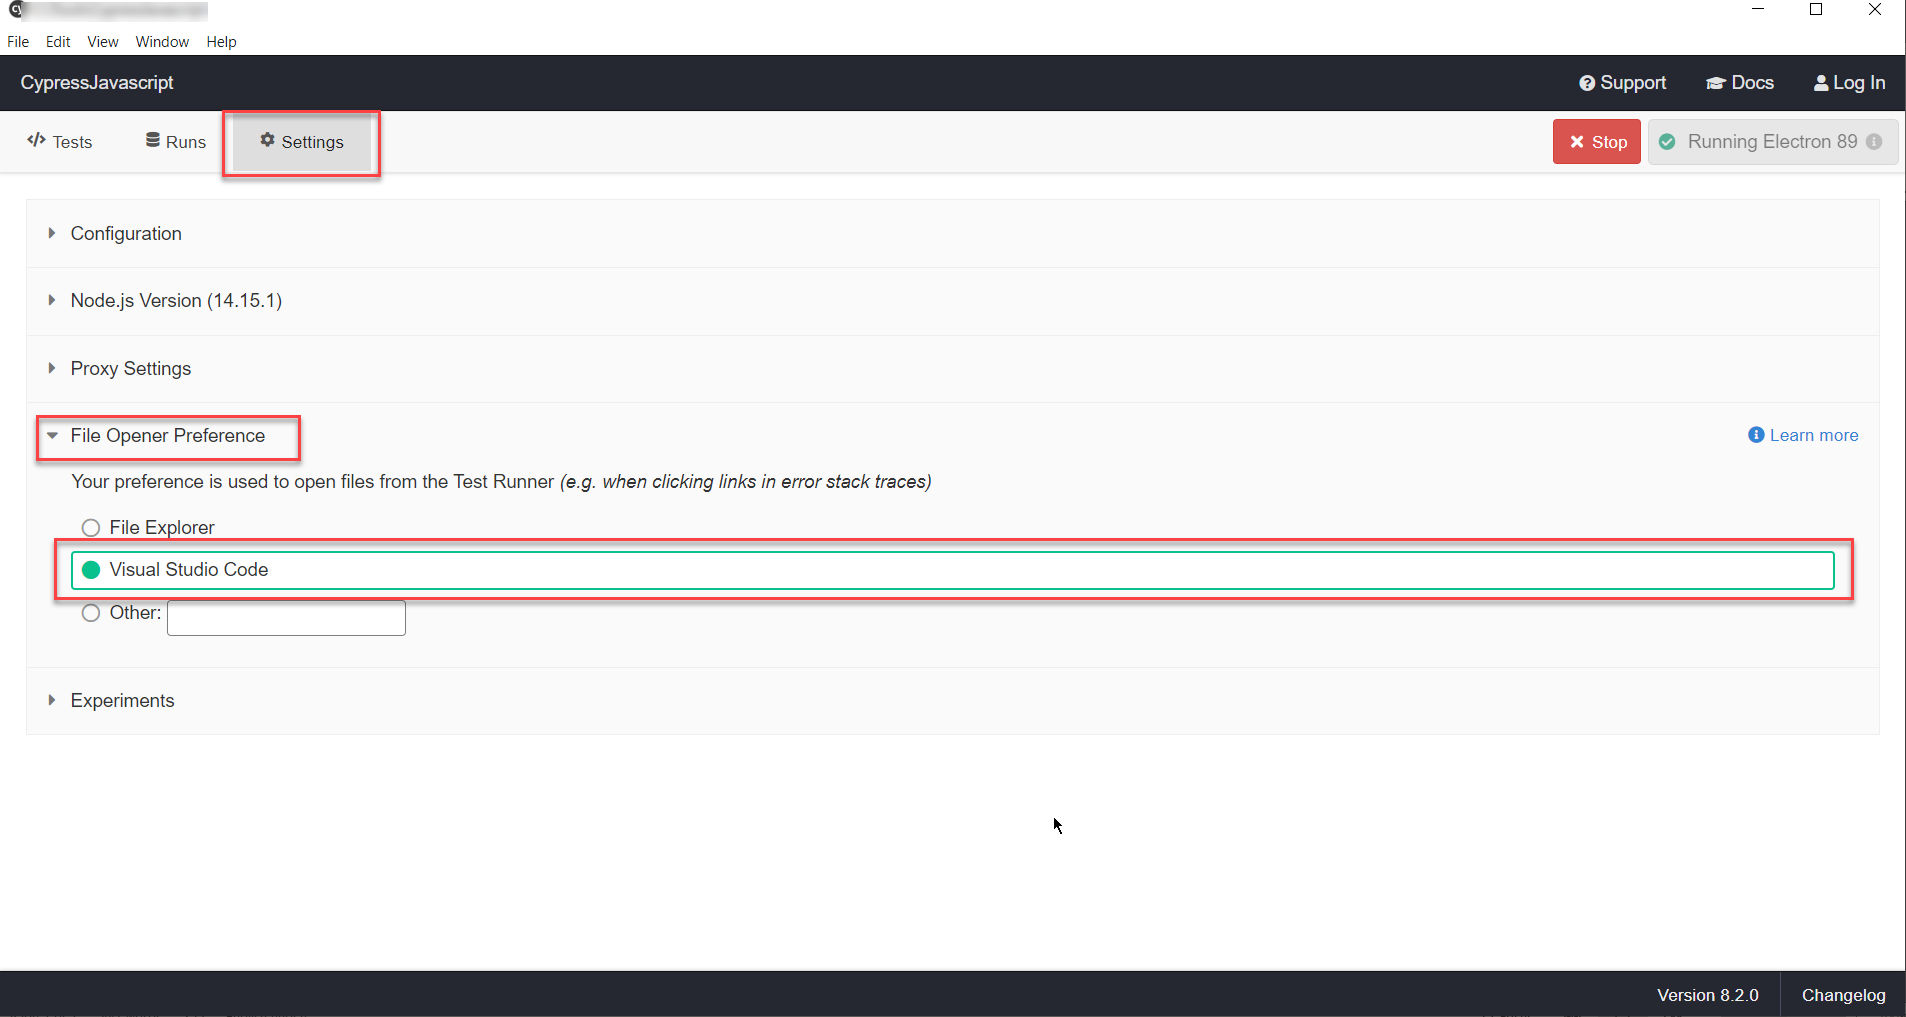
Setup a File Opener Preference in Cypress
- Navigate to Cypress’s main window.
- Click on Settings.
- Expand the “File Opener Preference” Tab.
- Click on the desired IDE.
This example sets Visual Studio Code as the default IDE for Cypress.
After setting up the preference, click on stack trace, which will take you to the concerned file or line.
For example, in the code above, cy.get(‘#product-menu-toggle1’).click(); throws an error. So the file causing the issue can be opened directly in the IDE from Cypress.

2. Debug Cypress Tests using the Debugger
Cypress provides options to use the native debugger keyword in tests. Just put the debugger keyword at the juncture in which test execution should pause.
 describe('Verify Browser Stack Home Page', () => {

    it('Verify Browserstack logo is visible', () => {

        cy.visit('https://www.browserstack.com/');

        cy.get('#logo').should('be.visible');

    })

    it('Click on Sign In', () => {

        cy.get('a[title="Sign In"]').then(($selectedElement) => {

            debugger;

            $selectedElement.get(0).click()

        })

    })

})
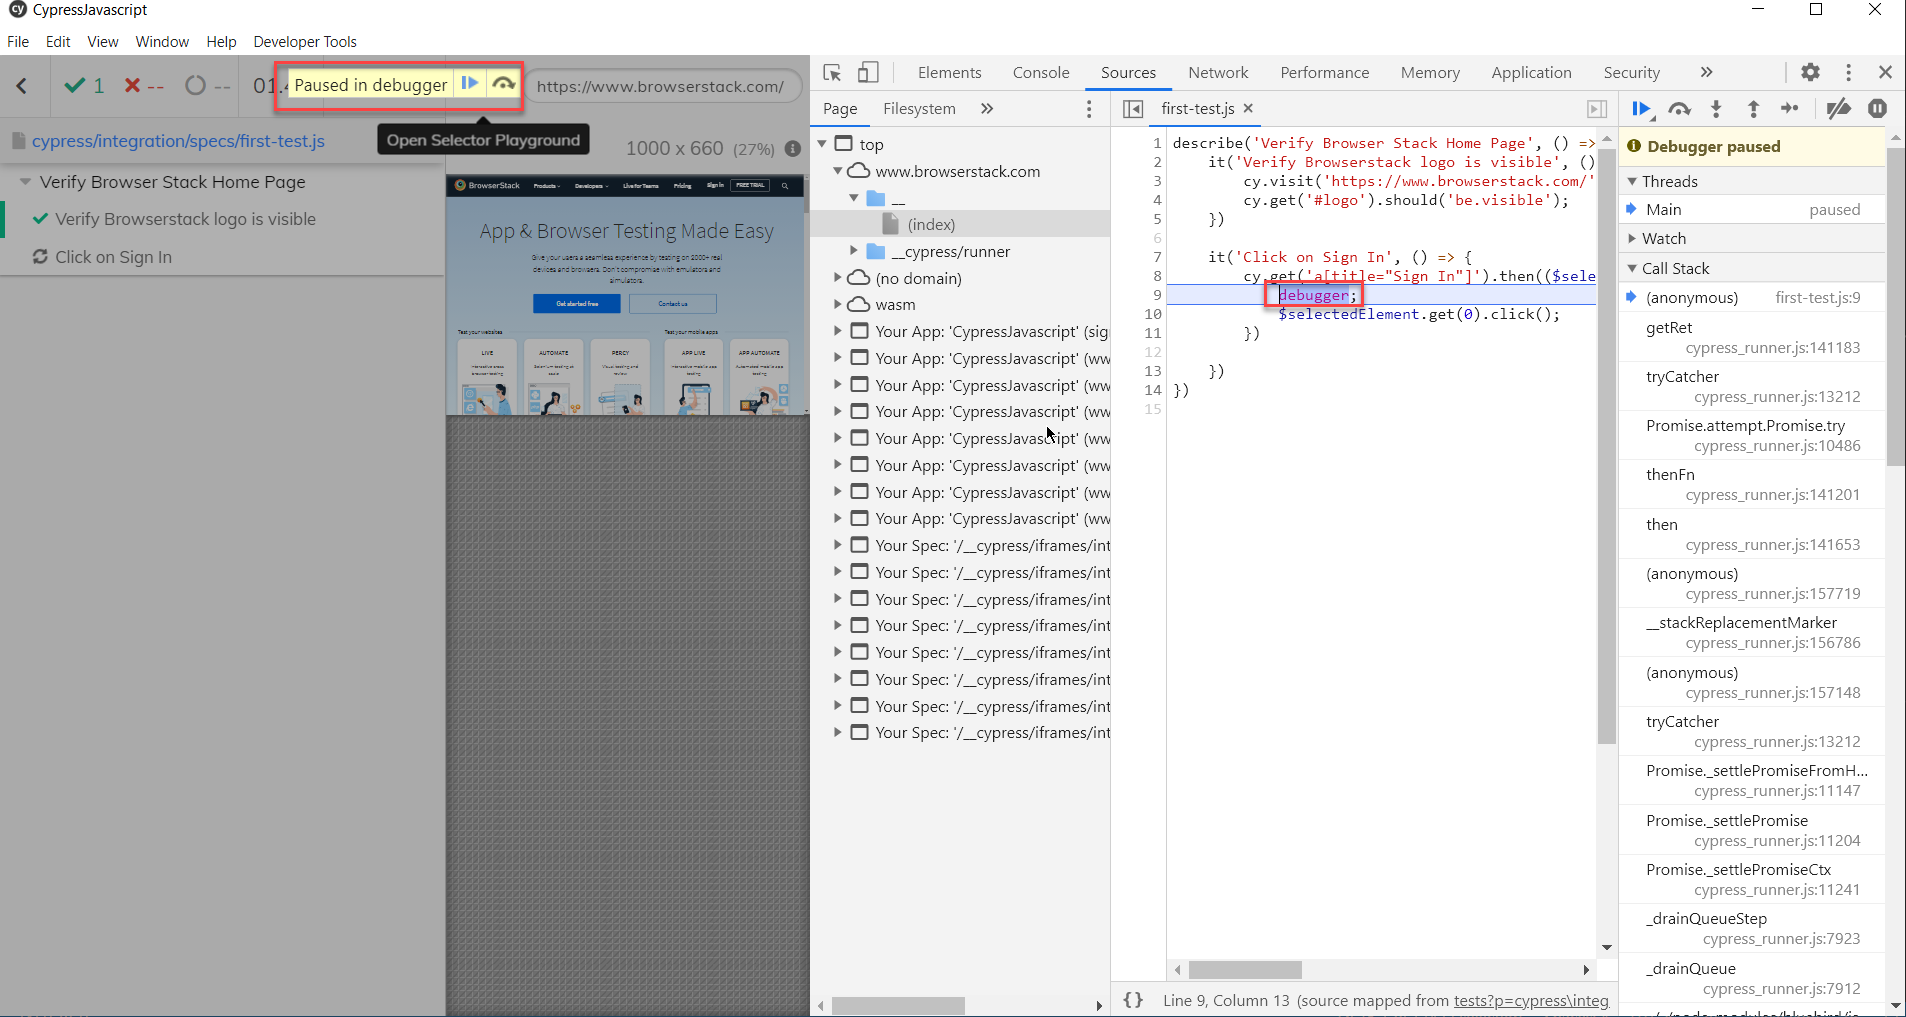
In the above example the debugger is deployed in the second it(). When the test runs, it will pause as soon as it encounters the debugger keyword.
At this point, testers can easily navigate to different tabs in developer tools like console, Elements, etc. to inspect or check what is happening at that part of the script.
Note: The Debugger keyword should always be a chain with then(). Using the debugger keyword directly without using then() may cause it to work incorrectly. For example, the code snippet below might not work as expected.
  //debugger might not work in expected way

    it('Click on Sign In', () => {

        cy.get('a[title="Sign In"]').click()

            debugger;
    })
3. Debug Cypress Tests using console logs
With Cypress, testers can print logs on the browser console and the Cypress window console. They can even print the stack trace to the browser console.
There are two ways to use console logs in Cypress:
- cy.log() command
- console.log() by configuring cypress tasks
1. Using Cypress cy.log()
cy.log() is exclusively provided by Cypress. It helps print a message to the Cypress Command Log. It is quite useful to print a message or value after execution of a particular line of code.
Code Snippet
describe('Verify Browser Stack Home Page', () => {

    it('Verify Browserstack logo is visible', () => {

        cy.visit('https://www.browserstack.com/');

        cy.get('#logo').should('be.visible');

        cy.log("Navigated to home page")

    })

})
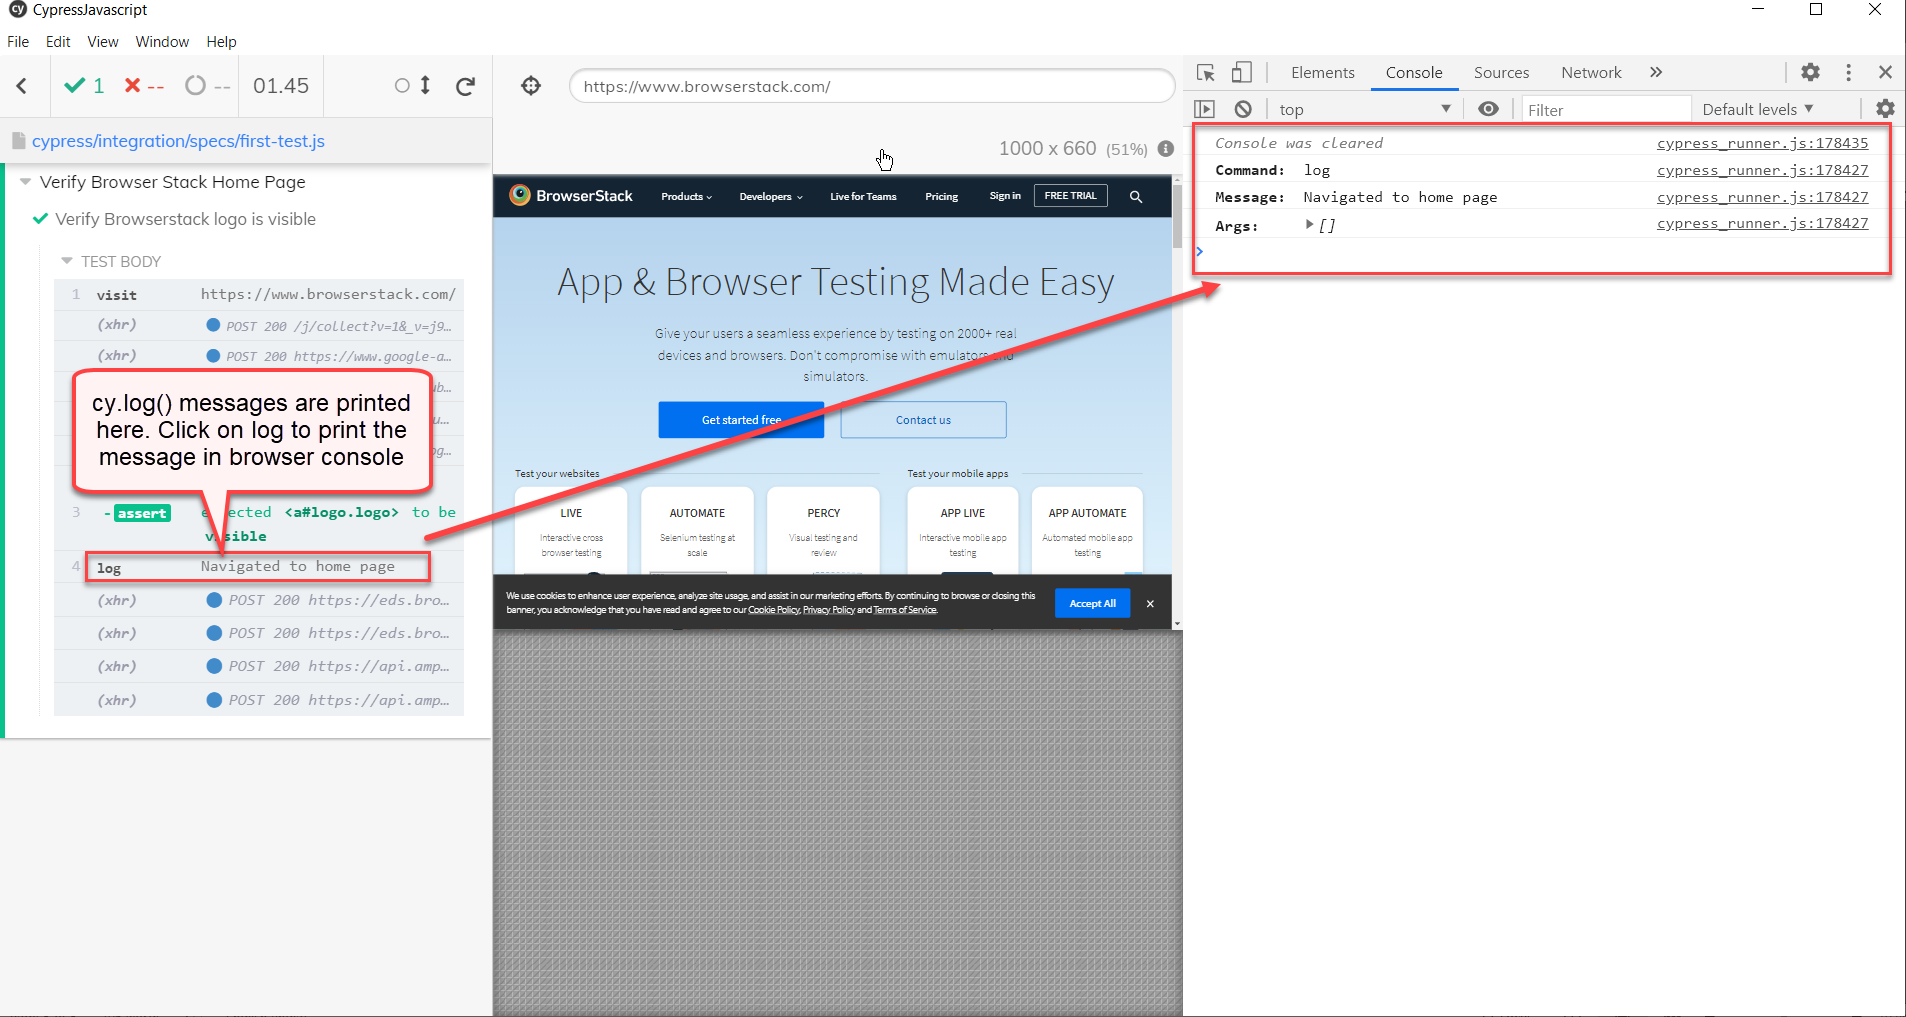
In the above example, cy.log() is used to print the message Navigated to the home page after execution of above code, Cypress prints the message in the Cypress command log. One can also click on the log to print the message in the browser console.
Note: Cypress doesn’t print logs directly in the browser console. First, it prints on the Cypress window and from there one can print it on the console.
2. Using console.log() in Cypress
As seen earlier, cy.log() prints the message Cypress window first. Only when the user clicks on that will it print the message on the console. So, if executing tests on headless, testers will find console.log() very useful as they can see the printed message on the command line.
However, Cypress doesn’t directly support the use of console.log(). But it can be done as shown below.
console.log() helps print the message in the browser console. If users leverage headless mode, console.log() prints the message in the command line.
Follow the steps below to use console.log () in a Cypress script (the one used above):
- Navigate to the cypress/plugins folder.
- Open index.js file inside plugins folder.
- Add a task to log messages as done below.
//index.js

module.exports = (on, config) => {

  on('task', {

    log(message) {

      console.log(message)


      return null

    },

  })

}
4. Now use the task log in the script.
//inside test script ex: first-test.js


describe('Verify Browser Stack Home Page', () => {

    it('Verify Browserstack logo is visible', () => {

        cy.visit('https://www.browserstack.com/');

        cy.task("log","This is console log : Navigated to home page")

    })

})
Considering the example above, this script uses:
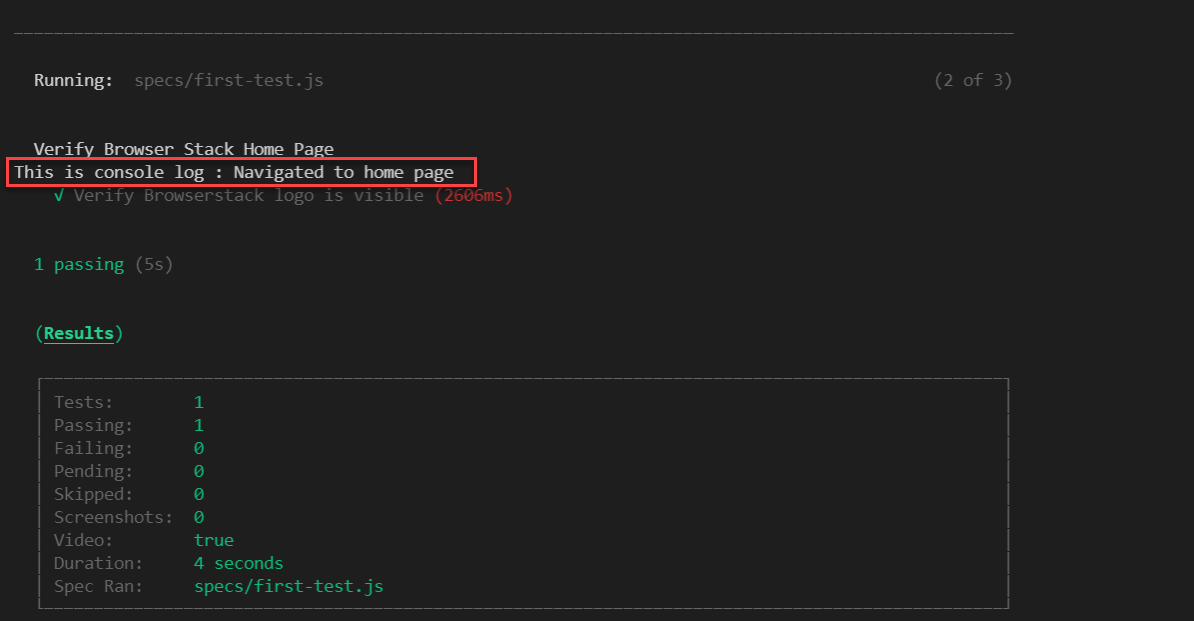
cy.task("log","Navigated to home page")console.log() can be used with both headless mode (command-line) and headful mode tests. In the case of headless mode, the message will be printed in the command line. In headful mode the message will be printed in the Cypress command window.
Below is a snapshot of the headless mode execution of Cypress with console.log()
4. Debug Cypress with .debug() option
Cypress provides a powerful utility command to debug test scripts called .debug(). This command sets the debugger and logs what the previous command yields. .debug() can be chained with cy or off another command. It yields the same subject it was given from the previous command.
Note: One must have their Developer Tools open for .debug() to hit the breakpoint.
Code Snippet
describe('Verify Browser Stack Home Page', () => {

    it('Verify Browserstack logo is visible', () => {

        cy.visit('https://www.browserstack.com/');

        cy.get("a[title='Sign In']").first().debug().click()

    })

})
The example above uses.debug() in this line
cy.get("a[title='Sign In']").first().debug().click()Considering this, .debug() is placed after getting an element and before clicking on that element, so Cypress pauses execution after getting the element. Once the script hits debug point, it stops execution and testers can perform desired operations on developer tools to identify or resolve issues.
5. Cypress debug tests with .pause() option
The .pause() command stops cy commands from running and allows interaction with the application under test. Testers can then “resume” running all commands or choose to step through the “next” commands from the Command Log.
Read More: Cross-Browser Testing with Cypress: Tutorial
Difference between Cypress .pause() command and .debug() command
The following points highlight the key differences between the Cypress .pause() and .debug() commands, illustrating when and how each should be used during the debugging process.
- .pause() will stop test execution to inspect the web application, the DOM, the network, but .debug() will stop only when the developer tools are open.
- The .pause() command does not provide any debugging information. .debug() provides debugging information when Cypress hits the .debug() command.
- Using the .pause() command can stop the execution and continue step by step using the next option but .debug() doesn’t provide this function.
Code Snippet
describe('Verify Browser Stack Home Page', () => {

    it('Verify Browserstack logo is visible', () => {

        cy.visit('https://www.browserstack.com/').pause();

        cy.get("a[title='Sign In']").first().click()

    })

})
Consider the code snippet above. The .pause() command is applied in the line:
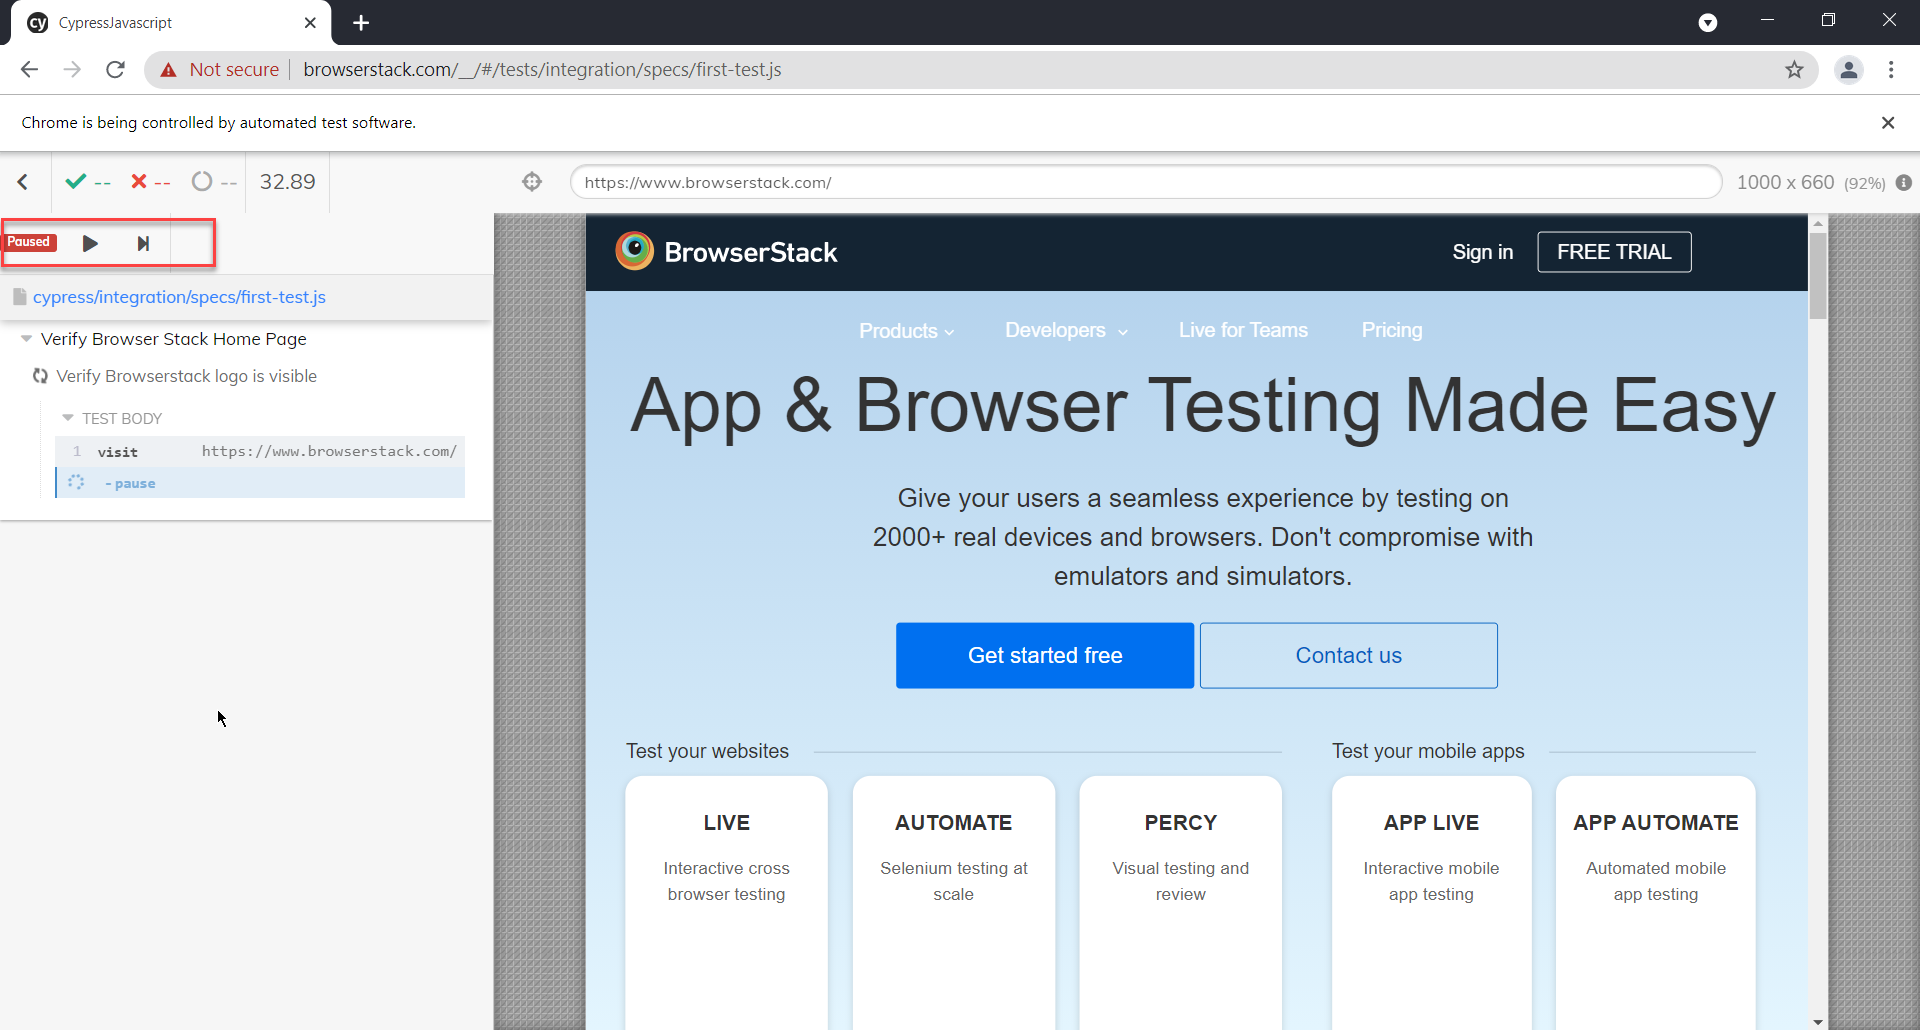
cy.visit('https://www.browserstack.com/').pause();So when Cypress navigates to the page it hits the .pause() command and stops execution. At this point, one can analyze the rendered DOM or perform desired activity using browser developer tools. Once the analysis is completed, they can just hit the Next button to see the next step or the Resume button to continue execution.
Debug Cypress Tests with Visual Studio Code IDE
Debugging Cypress tests using Visual Studio Code was possible earlier but with the latest version of Cypress, there is no direct way to do so. Even with the latest version of Cypress, a workaround was possible using Debugger for Chrome – a Visual Studio Code Extension and cross-env npm package. However, the Debugger for Chrome Extension for Visual Studio Code is deprecated and the cross-env npm package has gone into maintenance mode.
So if testers try to configure Visual Studio Code and Cypress to debug tests, using an outdated package and extension might cause Cypress to behave unexpectedly. Hence, this is not a recommended option for debugging. In short, there is no direct way to use Visual Studio Code for debugging Cypress tests.
Read More: TestCafe vs Cypress: Core Differences
Conclusion
Effective debugging is essential for ensuring the reliability of Cypress tests and streamlining the development process. By utilizing the various debugging techniques, such as stack traces, the debugger, console logs, and commands like .pause() and .debug(), testers can quickly identify and resolve issues. Each method has its own strengths, and knowing when to use them can significantly reduce debugging time and effort.
For teams looking to elevate their Cypress testing experience, BrowserStack Automate offers powerful features that go beyond basic debugging. It enables testing on real devices and browsers, ensuring that tests are performed in real-user conditions.
BrowserStack provides features such as screenshots on failure, detailed video recordings of test executions, live debugging with remote access, network logs, and even mobile-specific insights.
Additionally, its cloud-based platform allows for parallel test execution, drastically speeding up test cycles. With BrowserStack, testing becomes faster, more reliable, and easier to scale across different environments.


