I used to think debugging was just about adding logs and rerunning tests until they passed. But Playwright made me realize something else: debugging only works when the right tool is used at the right moment. Browser tools, logs, screenshots, and video recordings are all available, yet failures still take hours to understand.
Debugging is an essential part of test automation, and Playwright provides powerful ways to investigate failures.
Overview
Methods for debugging Playwright tests
- Playwright Inspector
- Playwright Trace Viewer
- Browser Developer Tools
- Visual Studio Code debugger
- Verbose API logs
- Headed Mode
- UI mode
Common Challenges in Playwright Debugging
- Flaky tests
- Element Not Visible or Detached
- Debugging Timeouts
- API and Network Issues
- Browser Compatibility and Environment Differences
- Complex Authentication Flows
This article shows how to use those debugging features effectively to find real issues faster instead of relying on repeated reruns.
What is Playwright?
Playwright is an open-source test automation tool shipped with an Apache license. While Playwright launches browsers in the headless mode by default, it can also run them in headful mode. By passing a flag, when the browser is launched, Playwright can be used to run browsers in the headful mode for tests.
Browsers supported for Playwright
- It has gained traction due to benefits, such as support for multiple languages such as Java, C#, NodeJS, and Python.
- Playwright tests can be run on Firefox, Webkit, and Chromium-based browsers.
- It is compatible with Windows, Linux, and macOS and can be integrated with primary CI/CD servers such as Jenkins, CircleCI, Azure Pipeline, TravisCI, etc.
Note: With BrowserStack, Playwright Browser Compatibility extends to WebKit, Mozilla Firefox, and Chromium for Playwright versions 1.10.0 – 1.25.1
What is Debugging and Tracing in Playwright
Debugging and tracing are essential for creating reliable and efficient test scripts in Playwright.
Debugging helps identify and fix issues like failing tests, timing problems, or unexpected browser behavior, ensuring your scripts run as intended.
Tracing, on the other hand, provides a detailed step-by-step record of test execution, including screenshots and logs, making it easier to analyze and understand failures.
Together, these tools save time, improve test accuracy, and help catch potential issues early in the development cycle. By mastering debugging and tracing in Playwright, you can create robust automated tests that ensure the quality of your applications.
Read More: Best Practices for Debugging Website Issues
How to run Playwright debug mode?
Playwright is a powerful end-to-end testing framework that allows developers to automate interactions with web browsers. One of its important features is the ability to run tests in “debug mode” which provides detailed insights into test execution, helping identify and resolve issues efficiently. Debug mode enables a number of debugging techniques, each designed to suit different scenarios and workflows.
Below are some of the methods for debugging Playwright tests:
- Playwright Inspector
- Playwright Trace Viewer
- Browser Developer Tools
- Visual Studio Code debugger
- Verbose API logs
- Headed Mode
- UI mode
1. Debugging using Playwright Inspector
Playwright Inspector is a GUI tool that comes with the framework by default, and no additional configuration is required to use this tool.
To launch your test with Playwright Inspector mode, you need to prefix the test command with PWDEBUG=1 depending on the command-line tool you are using, the syntax might differ.
Powershell
$env:PWDEBUG=1

npx run test
Bash
PWDEBUG=1 npx run test
Batch
set PWDEBUG=1

npx run test
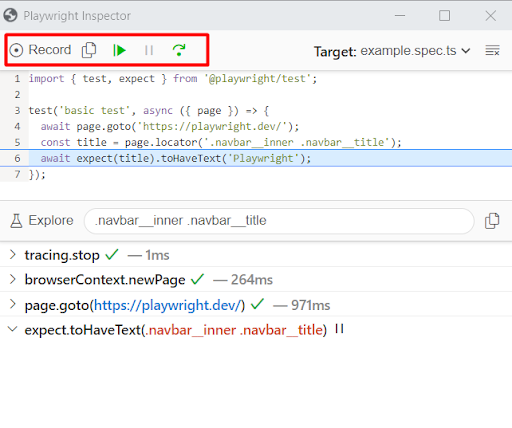
Once you enter the command, the UI window also known as Inspector windows opens and shows the line is being executed. You can debug the test line by line using this window.
Points to Remember when using PWDEBUG=1 flag:
- The browser launches in headed mode by default.
- There will be no default time-out.
- Playwright Inspector window is split into two parts: the upper part shows your code, and the lower part code shows the execution log.
- The Playwright provides two options either you can resume the script or you can step over.
- If you want to pause the test at the desired line use await page.pause(); in your script.
- If you add the await page.pause() playwright automatically opens the Inspector Window even though you have not set the PWDEBUG=1 flag.
Any time, if you don’t want to attach the Playwright inspector, change the PWDEBUG flag to 0 i.e PWDEBUG=0
Recording Scripts using Playwright Inspector Tool
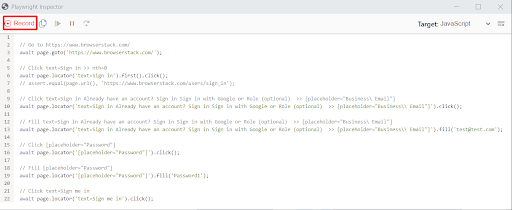
Sometimes you might find it challenging to understand how the locators simulate flows using scripts. Playwright Inspector Tool also provides a command called codegen, Popularly known as Playwright codegen that allows us to record the scripts automatically.
The codegen is like a recording tool. However, you can use this to generate complex scripts and later paste them inside our test case.
From the terminal, you can enter the below command to record the tests using Playwright Codegen Tool
npx playwright codegen <webpage_url>
Example:
npx playwright codegen browserstack.com
Once the above command is entered in the terminal, the Playwright inspector window launches. The record button in the inspector window helps to start or stop the recording at any desired point. As the browser opens baseURL, you can navigate the actions or workflows.
Upon completing the recording, stop the recording, Save/Copy the recorded script, and close the Playwright inspector window.
2. Playwright Debugging using Browser Developer Tools
DevTools are part of the browser, which enables easy debugging. While most browsers have this functionality, the shortcut key might differ from browser to browser. On your browser window right click and choose inspect element. If you are using a chromium-based browser, you can also choose CTRL +SHIFT + I or F12 to open DevTools windows.
Browser Developer tools are popularly known as DevTools. The browser developer tools are still accessible when running playwright tests.
Some of the actions that can be performed using Browser Developer Tools are:
- Inspect DOM Element
- Run commands in the browser console.
- Check console logs during execution
- Verify Network calls/requests in the Network tab
Apart from the actions listed above, any action that can be performed on a normal browser while working with webpages can be done using browser developer tools with Playwright.
Working with Playwright Object in Browser Developer Tools console (Chrome DevTools Console).
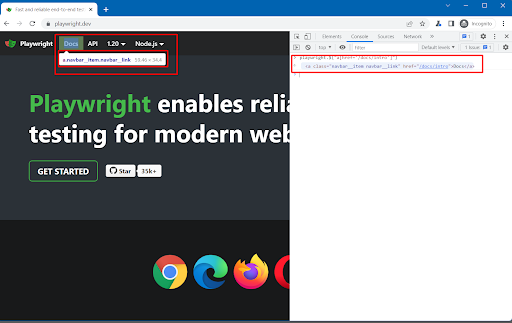
The Playwright allows you to highlight selectors in your browser console with the Playwright object. This is the most useful option, it helps debug locators and view the locators rendered during run time.
To utilize this option, Playwright needs to be launched in debug mode as explained above (using PWDEBUG=1 flag). Once you launch the Playwright test with debug mode, the Playwright Object is available in the browser console.
There are many ways to highlight the locators using playwright objects, such as:
- playwright.$(selector): Highlights the first occurrence of the selector. This is equivalent to a page.$ usage in the script.
- playwright.$$(selector): Highlights all occurrences of the selector. This is equivalent to a page.$$ usage in the script.
- playwright.inspect(selector): Inspects the selector in the Elements panel.
- playwright.locator(selector): Highlights the first occurrence of the locator.
- playwright.clear(): Clears existing highlights.
- playwright.selector(element): Generates a selector that points to the element.
Example:
playwright.$("a[href='/docs/intro']")The above command in the browser console highlights the web element containing with locator a[href=’/docs/intro’]
3. Playwright Debugging using Visual Studio Code
Playwright works well with Visual Studio Code. Suppose you are familiar with Java or C# and seek to debug using IDE breakpoints or the traditional debugging style by setting and unsetting breakpoints. In that case, Playwright provides the same way of debugging options.
To debug Playwright scripts using VS Code, follow the below steps.
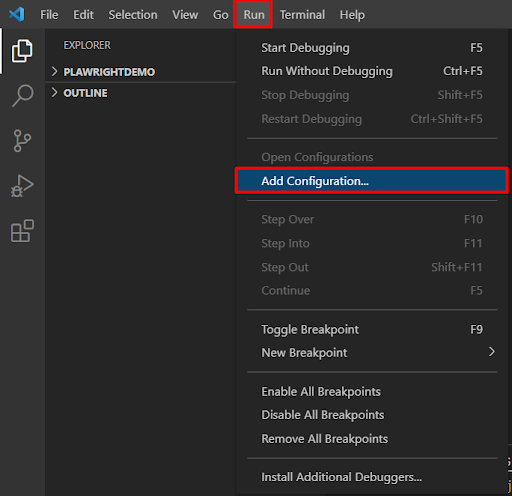
Step 1: Navigate to Visual Studio Code Run Menu > Click on Add Configuration
Step 2: Choose NodJS as an Environment
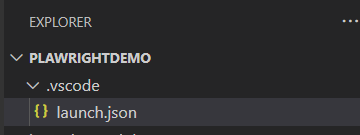
Step 3: The launch.json will be created inside our project folder automatically. You can check the file under
<Project_Folder>/.vscode/launch.json
Step 4: Edit launch.json file and enter the below code to it.
{

    "version": "0.2.0",

    "configurations": [

        {

            "type": "pwa-node",

            "request": "launch",

            "name": "Launch Program",

            "skipFiles": [

                "<node_internals>/**"

            ],

            "program": "${file}",

            "runtimeExecutable": "npm",

            "runtimeArgs": [

                "run-script",

                "test"

            ],

        }

    ]

}
Step 5: Add test command/value to script property in package.json. The package.json should be located in the project root directory (Note: If package.json is not available in your Project root directory, then you can create one using npm init command). Enter the below code to the package.json and save the configuration.
  "scripts": {

    "test": "npx playwright test --headed"

  }
Step 6: Run with Configuration in Visual Studio Code by following the below steps
- Set the breakpoint in your code with VSCode IDE
- Launch the test with Run (Menu) > Start Debugging or F5
- The test starts with the debugger attached, the test execution should halt when it hits your breakpoint.
4. Debugging Playwright Tests with Trace Viewer
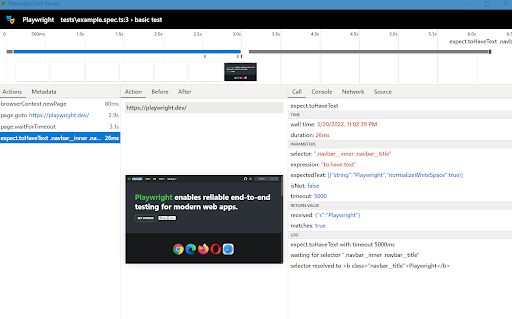
Trace Viewer is another functionality that can be used while Playwright debugging. Trace Viewer is a GUI tool that shows the traces recorded during test execution. Trace viewers can be opened using CLI or on the browser.
Recording Trace in Playwright
To record Trace, you need to configure it in the Global config file, and then follow these steps:
Step 1: Create a Global Playwright Config File i.e playwright.config.ts
Step 2: Place the playwright.config.ts under the Project root directory
Step 3: Add the below code in it
// playwright.config.ts

import { PlaywrightTestConfig } from '@playwright/test';

const config: PlaywrightTestConfig = {

  use:{

    trace:'on'

  },

};

export default config;
In the above code, the trace option has on value, likewise, you can provide different values from the list of available options for trace
- ‘off’ – Do not record a trace.
- ‘on’ – Record a trace for each test.
- ‘retain-on-failure’ – Record a trace for each test, but remove it from successful test runs.
- ‘on-first-retry’ – Record a trace only when retrying a test for the first time.
Once you run the test after configuring the trace option to the global config file. Trace will be recorded and stored in the test-results directory.
Traces of your tests will be recorded action-wise. Each action contains
- action snapshots,
- action log,
- source code location,
- network log for this action
Viewing Traces in Playwright
You can view the recorded Traces by following the below steps:
Step 1: Run/Execute your test
Step 2: Look for traces.zip inside your test-results folder
Step 3: From CLI you can enter the path to trace file in the following format
npx playwright show-trace <path_to_trace.zip_directory>/trace.zip
For Example:
npx playwright show-trace test-results\tests-example-basic-test\trace.zip
Step 4: Open trace.zip from the browser (Optional). Navigate to https://trace.playwright.dev/ and then drag and drop the trace.zip folder as seen below
5. Debug tests with Playwright Verbose Logging
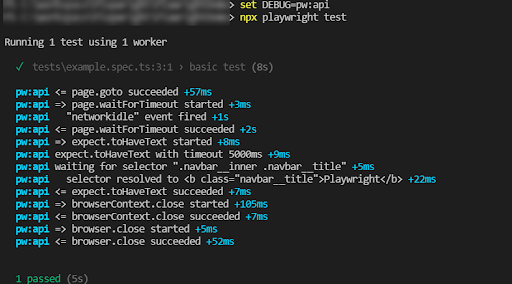
Amidst the several debugging options provided by Playwright, Verbose logging is another way to debug Playwright tests where the QA can see the verbose logs and analyze the scripts.
Enabling Verbose Logging in Playwright
The enabling of verbose logging depends on which type of CLI/Terminal you use.
Enable Verbose Logging with Bash
DEBUG=pw:api npx playwright test
Enable Verbose Logging with Powershell
$env:DEBUG="pw:api"
npx playwright test
Enable Verbose Logging with Batch
set DEBUG=pw:api
npx playwright test
Once you enable the Verbose Log, Playwright continuously feeds the logs to the command line so you can see what’s happening during the script execution.
6. Playwright Debugging in Headed Mode
By default, Playwright runs browsers in headless mode where the browser operates in the background without a visible UI.
To run tests with the browser’s UI visible (headed mode), you can set the headless option to false. Additionally, you can use the SlowMo option to slow down the execution of each operation, making it easier to follow the test steps in real-time.
Here’s how to run Playwright in headed mode with a delay between actions:
// Chromium, Firefox, or WebKit


const { chromium } = require('playwright');

(async () => {

const browser = await chromium.launch({

headless: false, // Run in headed mode

slowMo: 100 // Slow down execution by 100ms per operation

});

// Your code for interacting with the browser goes here


// Close the browser when done

await browser.close();

})();
With this setup, the browser will be visible during the test, and actions will be slower, allowing you to observe the behavior more easily and catch any issues as they occur.
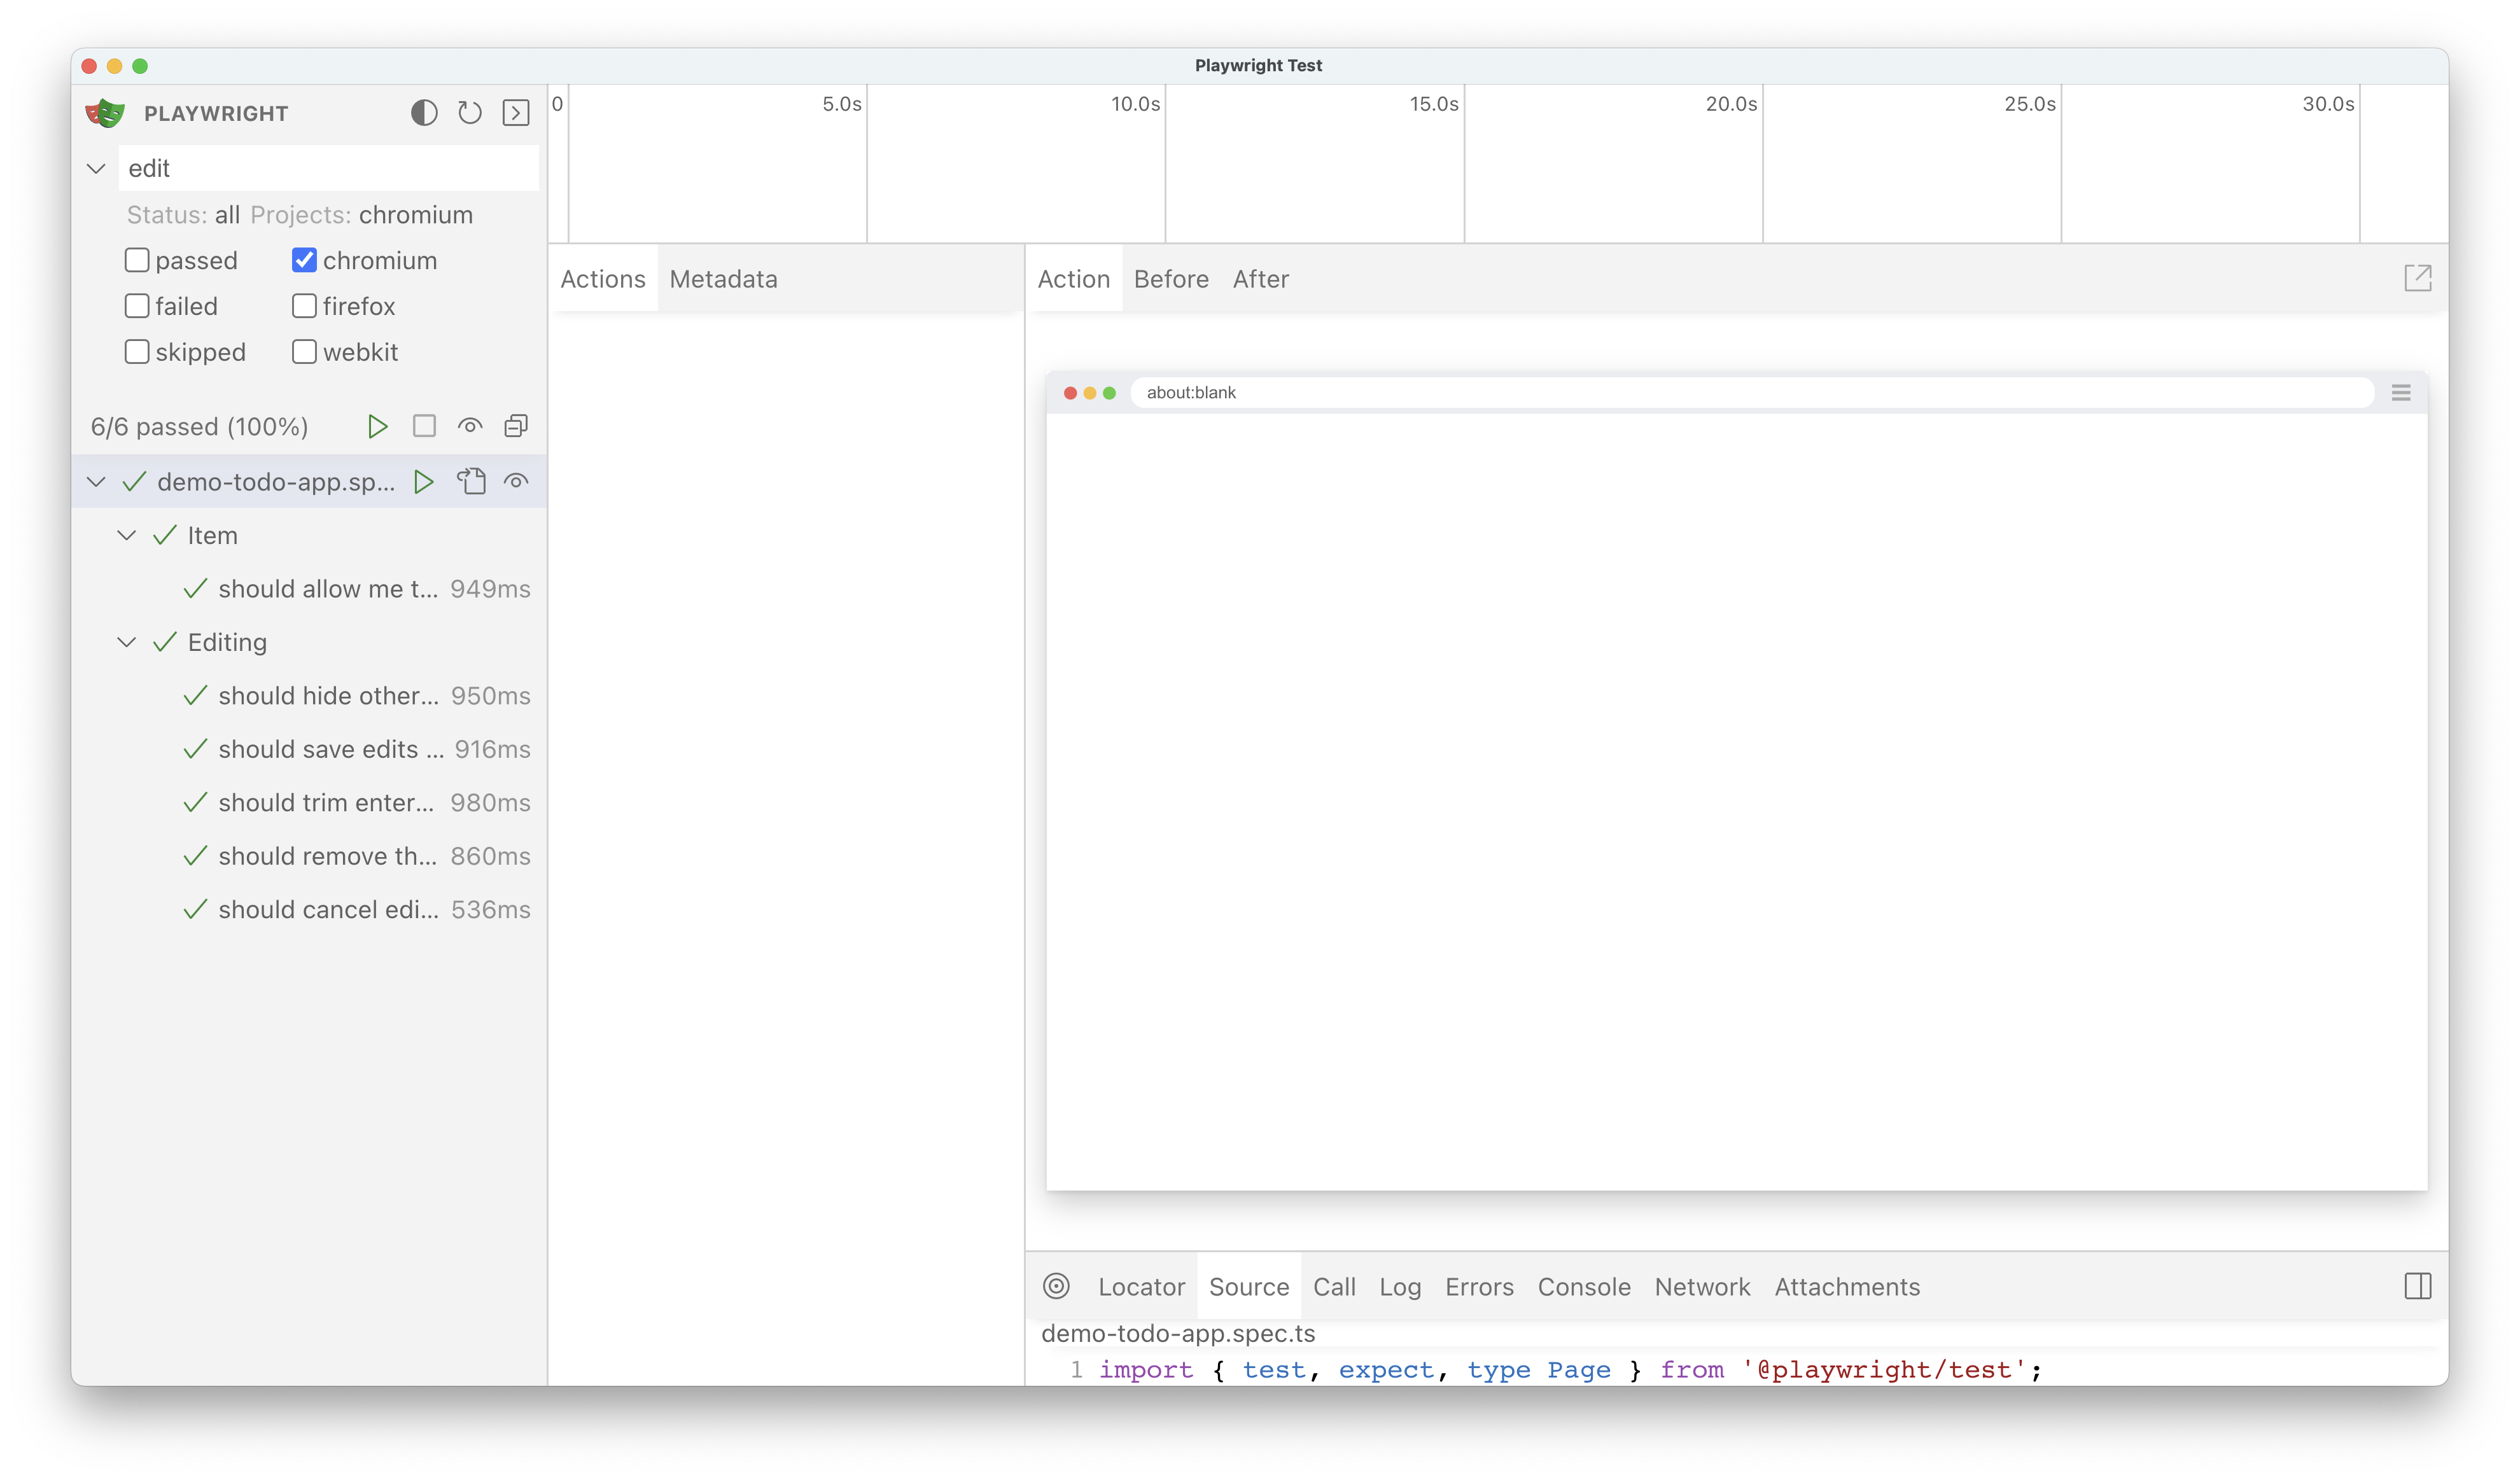
7. Debug tests in UI mode
Playwright’s UI mode is a feature of the Playwright Test Runner. It makes it easy to debug tests by providing a visual interface to inspect and troubleshoot test execution.
To start UI mode, run the following command in your terminal:
npx playwright test --ui
This will open the Playwright Test Runner, where you can view and interact with your test files.
In UI mode, you’ll see a list of all your test files. You can:
- Run All Tests: Click the triangle icon in the sidebar to execute all tests.
- Run a Single Test File: Hover over a file name & click the triangle icon next to it.
- Run Specific Tests: Expand a file to see individual tests & click the triangle icon next to a test or group of tests.
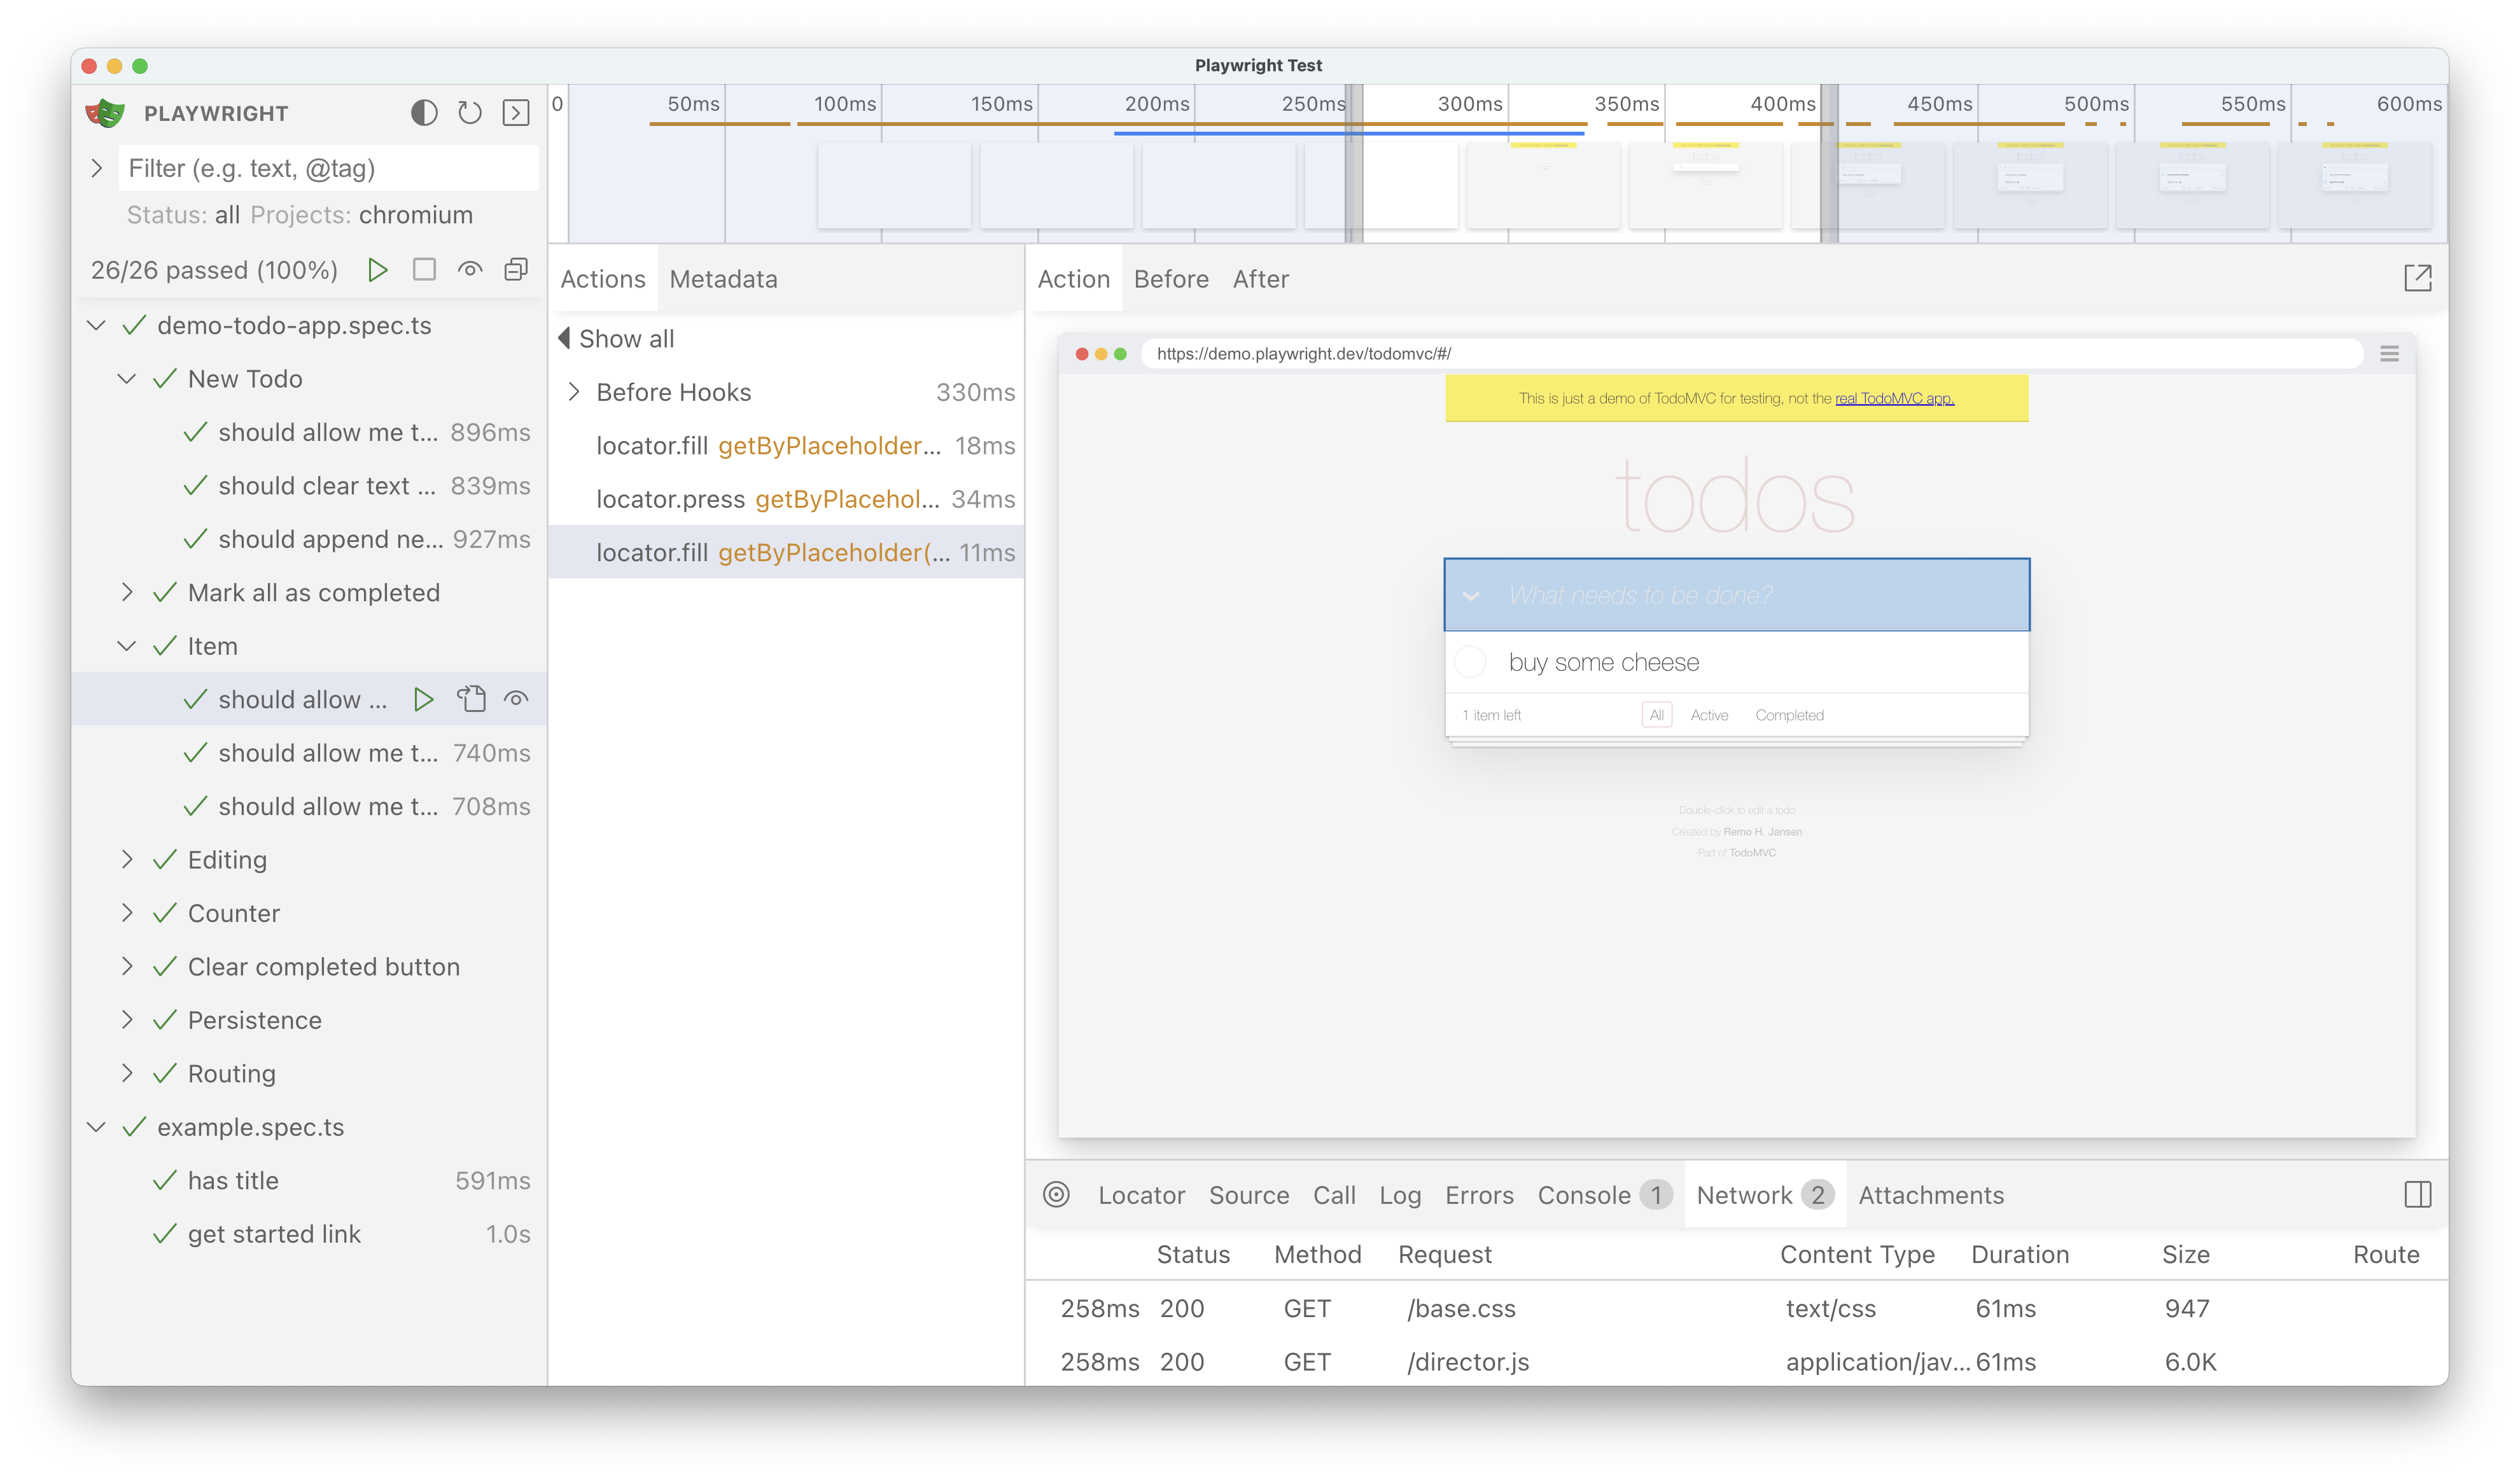
Debugging Features in UI Mode
1. Timeline View
The timeline provides a visual overview of your test execution. Use the timeline to locate problematic steps.
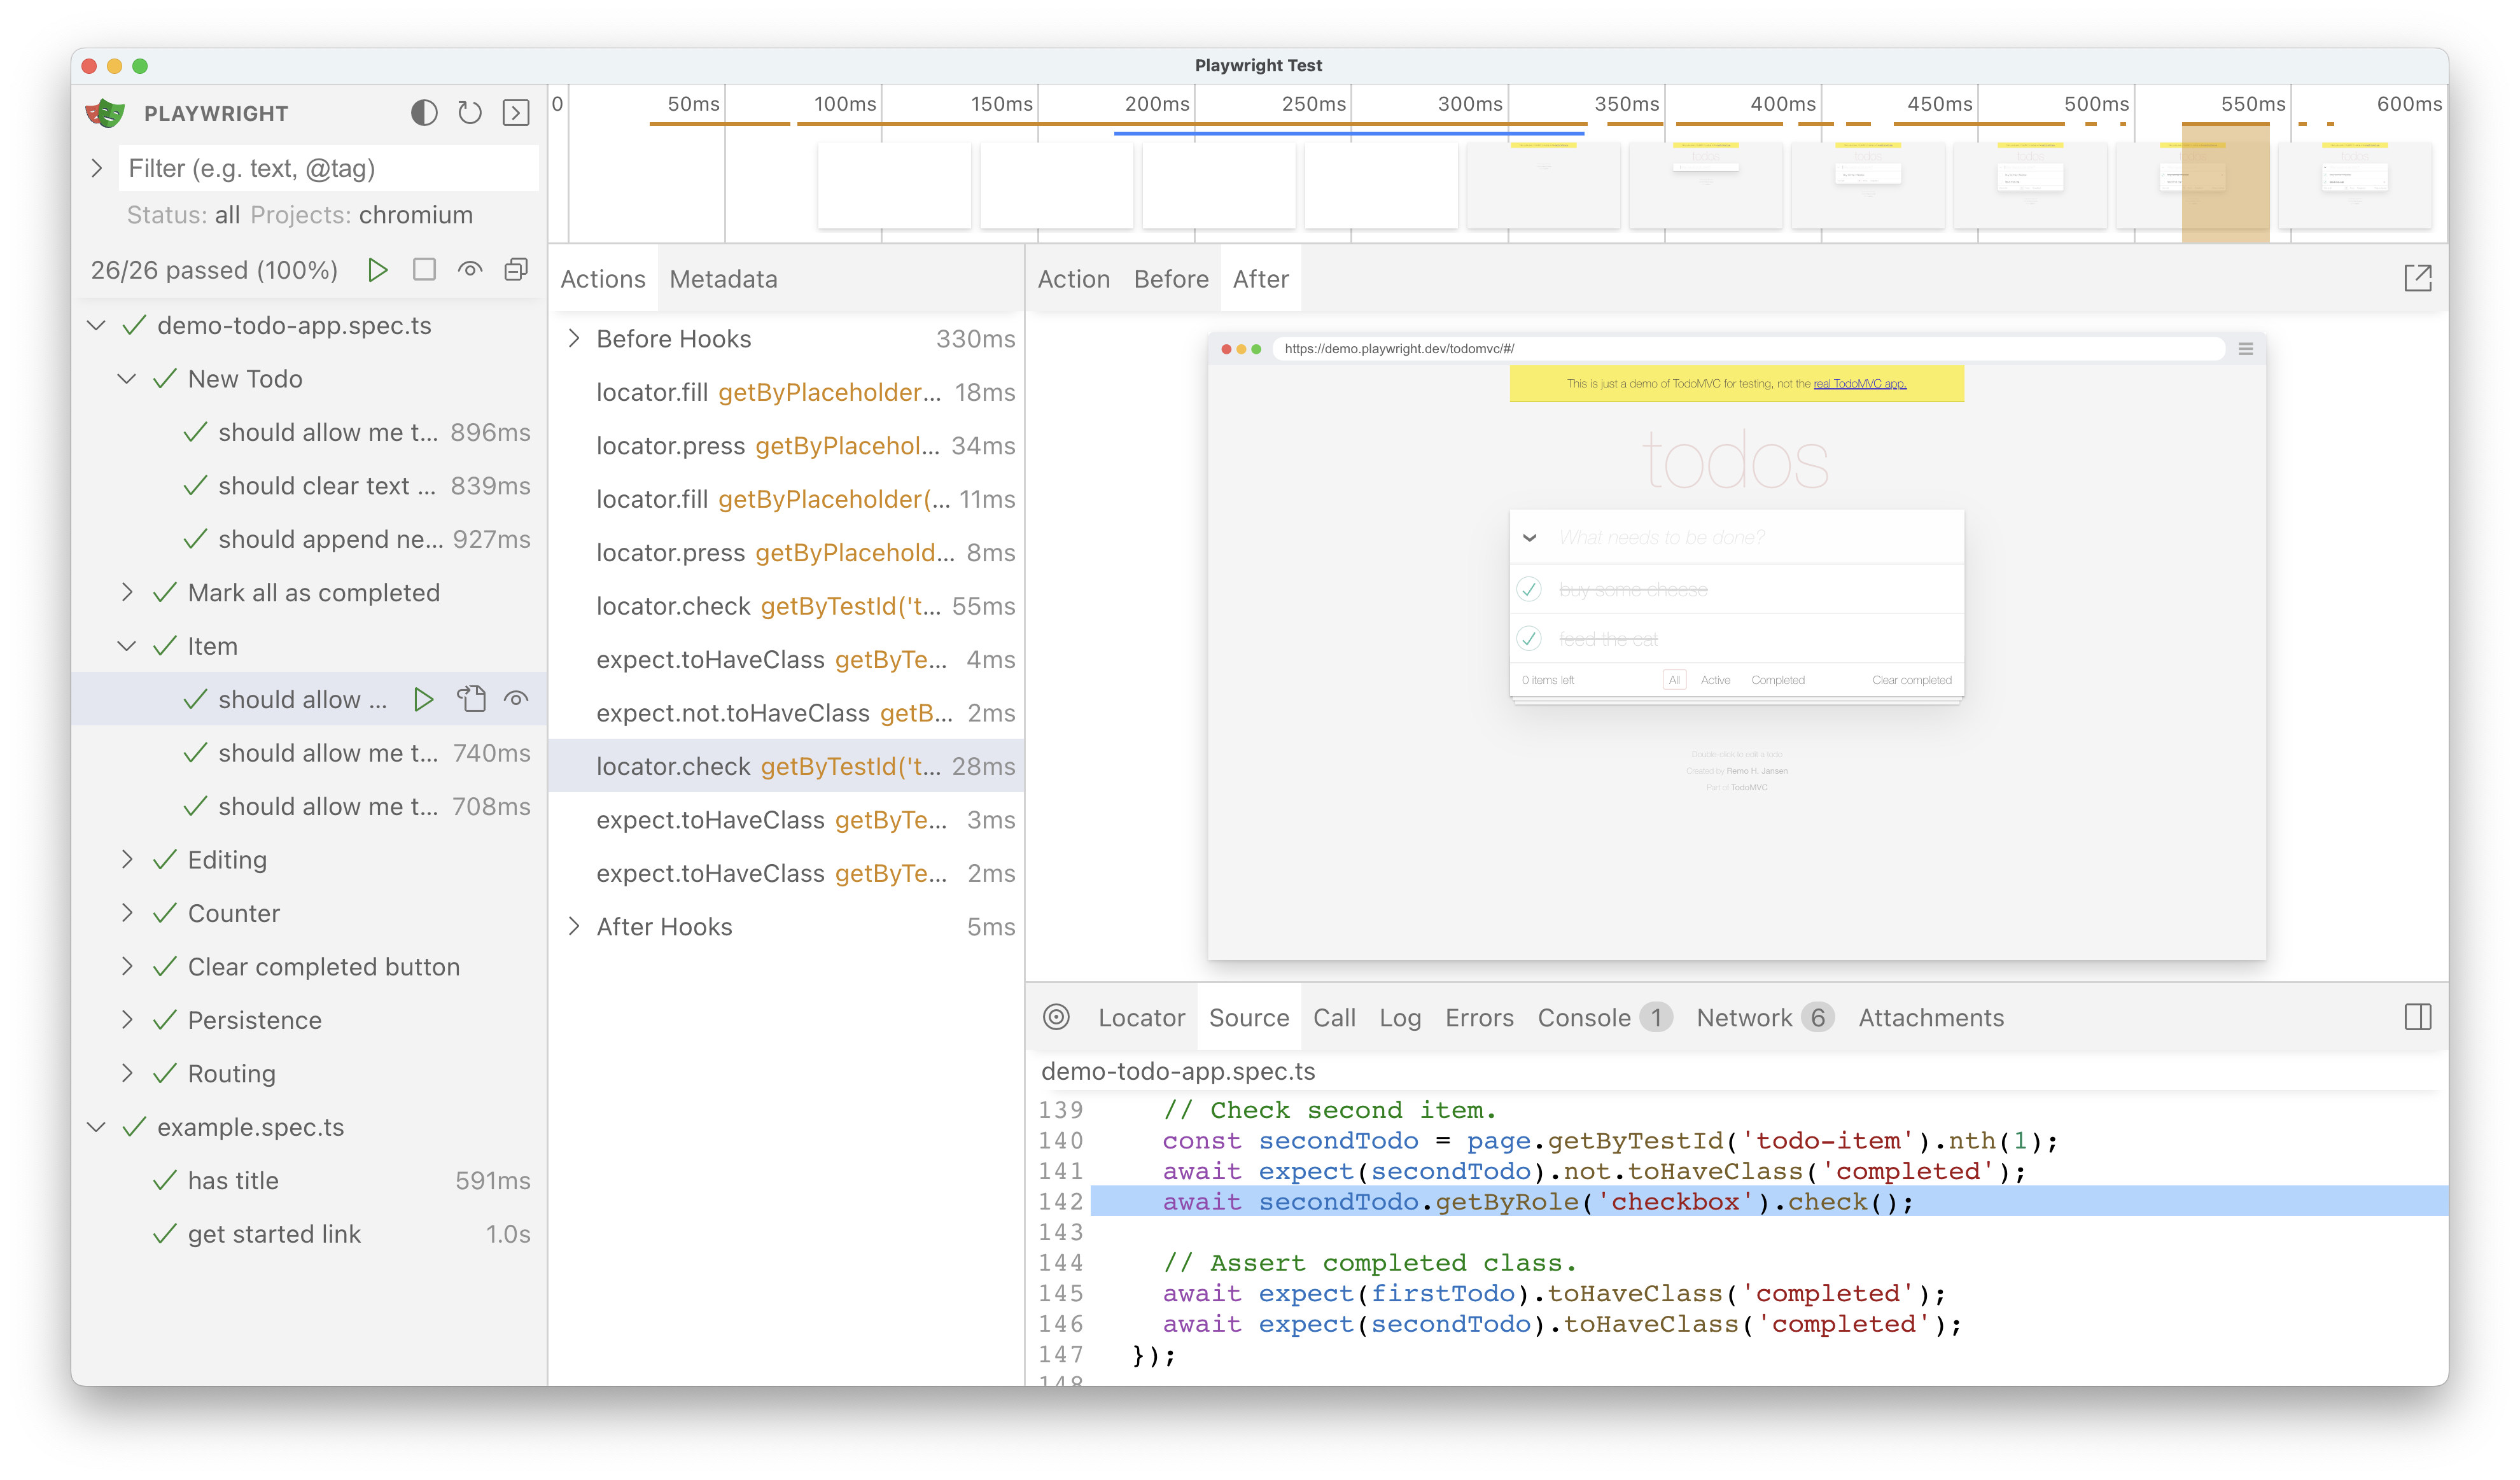
2. Actions Tab
The Actions tab gives detailed information about each test step. Inspect details in the Actions tab, including locators and DOM changes.
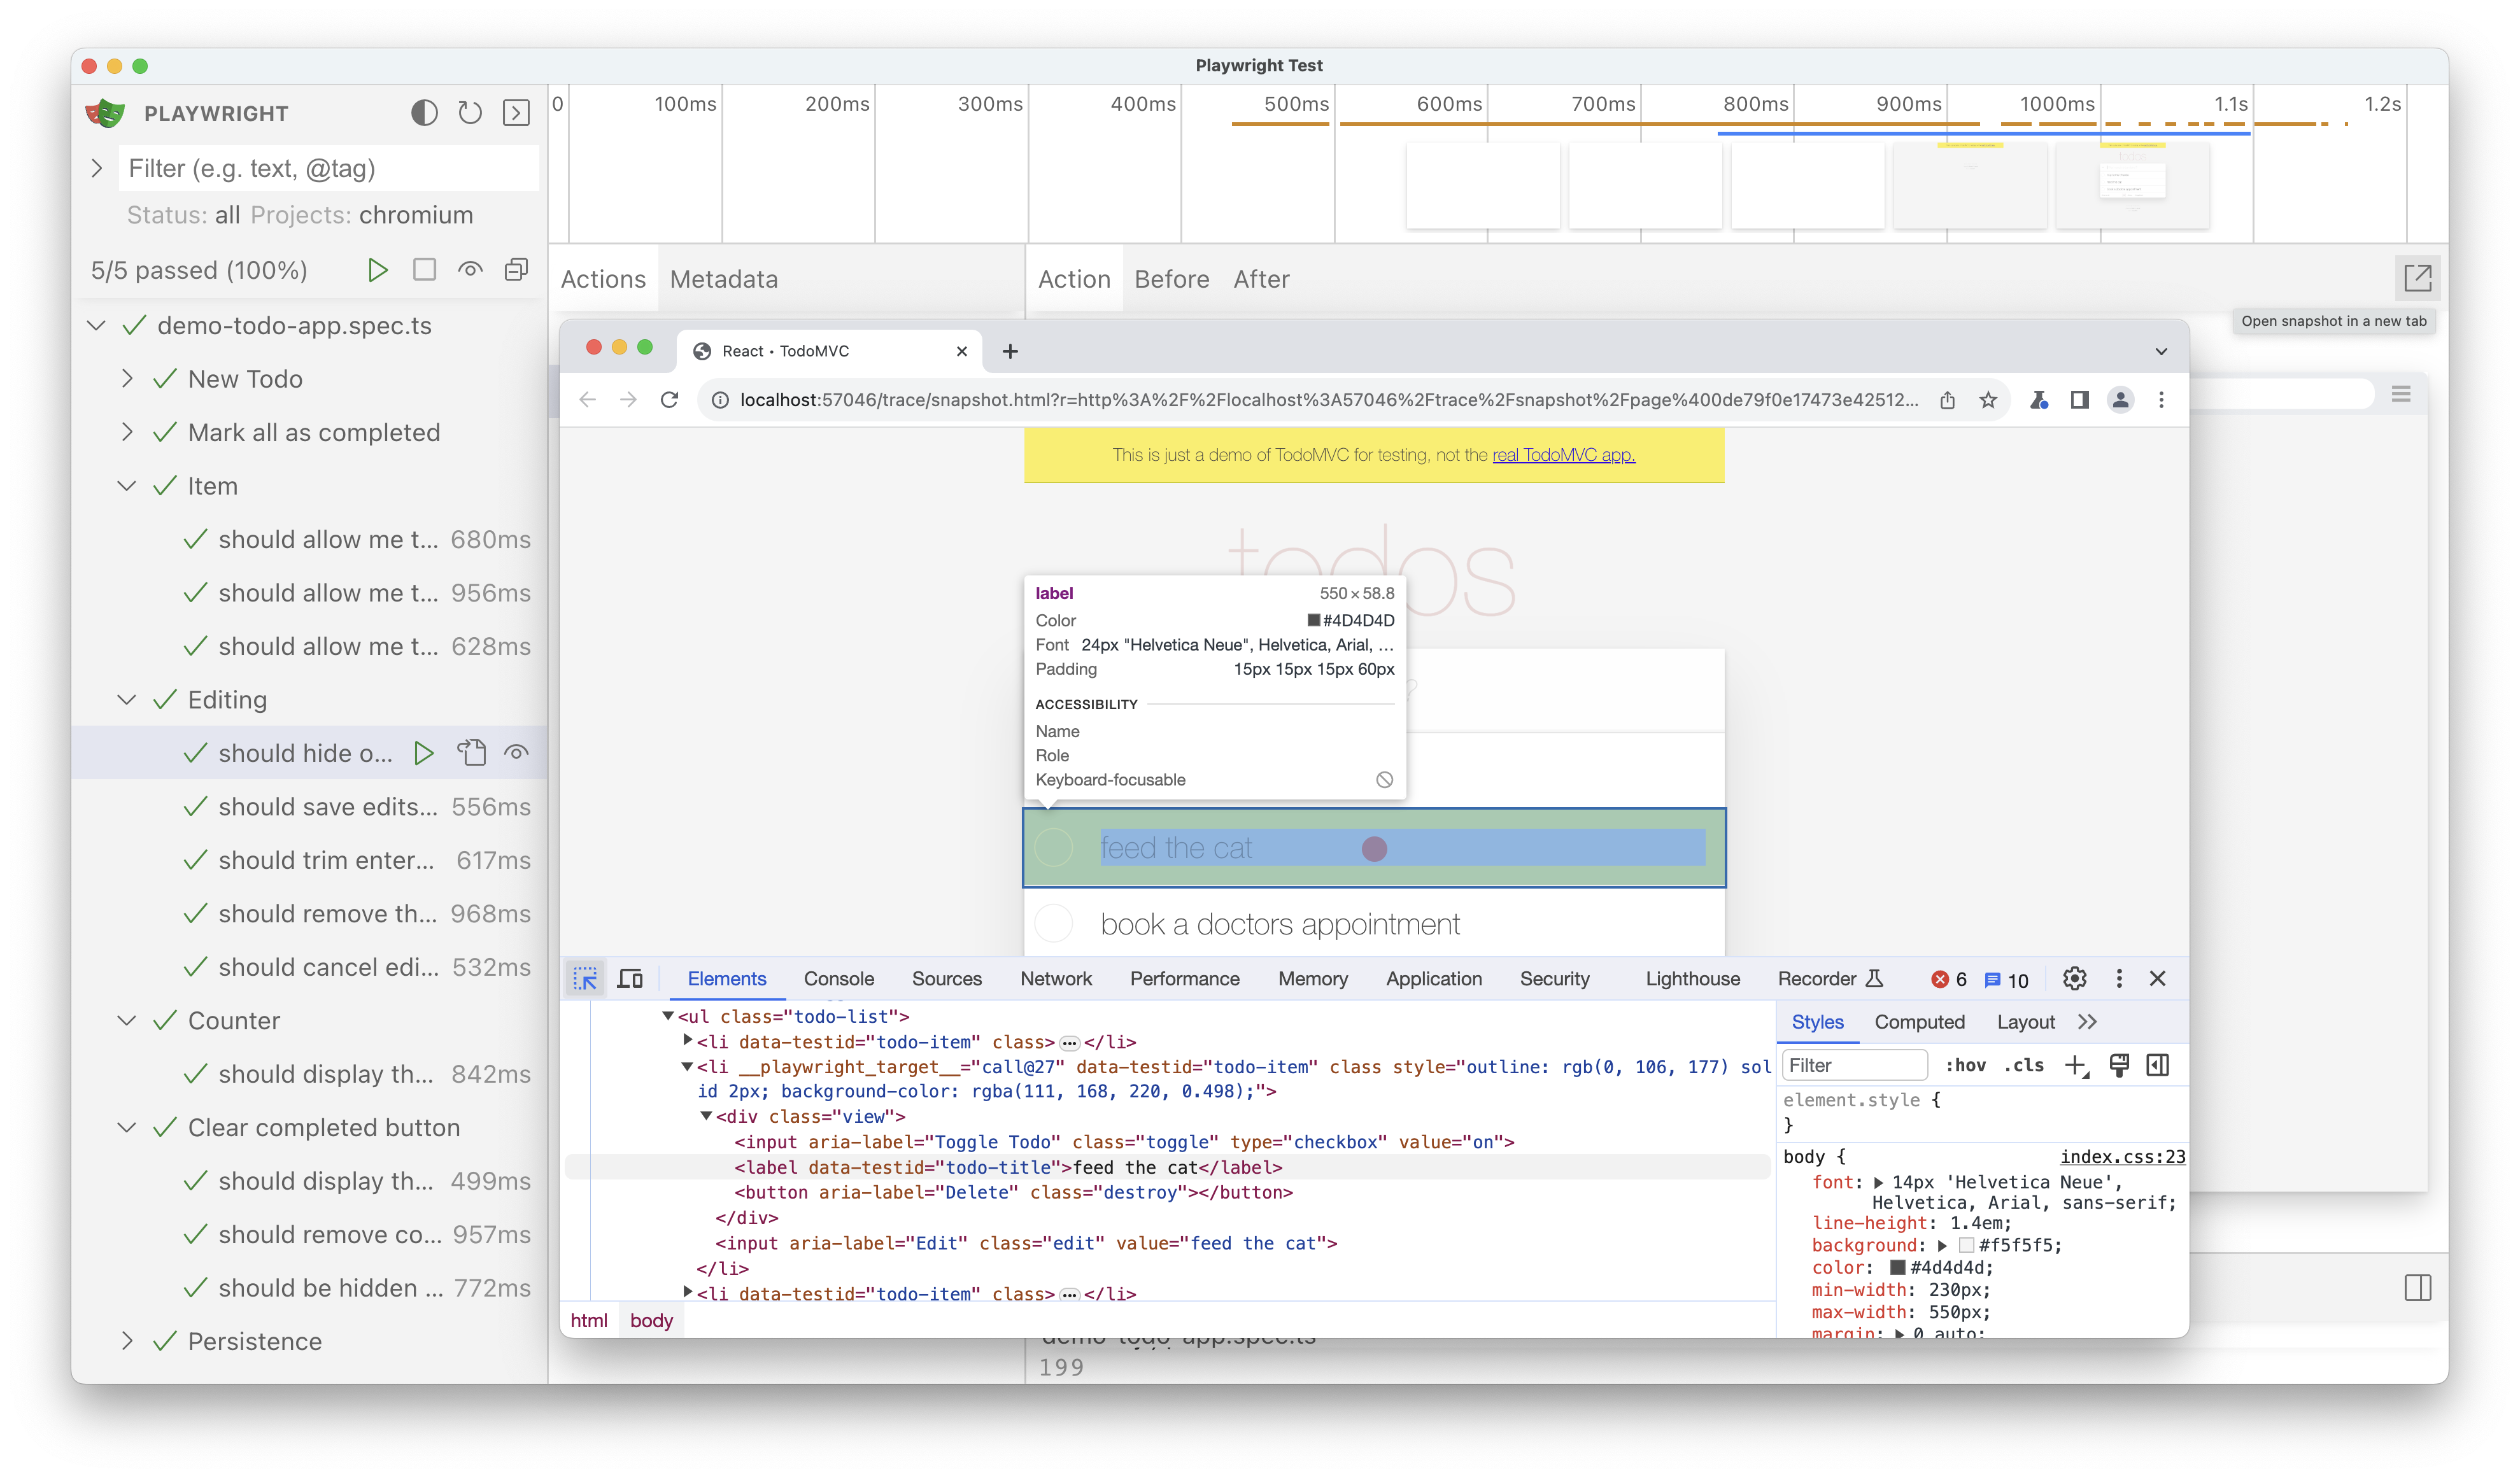
3. DOM Inspection
Open and compare DOM snapshots to debug specific actions.
Debugging vs Tracing in Playwright
Debugging and tracing in Playwright solve different problems, even though they are often used interchangeably. Knowing when to use each determines how quickly a failure can be diagnosed, especially in CI and parallel execution.
| Aspect | Debugging | Tracing |
|---|---|---|
| Execution style | Interactive and live | Recorded and replayable |
| Requires pause | Yes | No |
| Works in CI | Limited | Yes |
| Captures history | No | Yes |
| Handles flaky tests | Poorly | Effectively |
| Parallel execution | Difficult | Reliable |
| Best use case | Local development | CI and flaky failures |
When to use debugging vs tracing
Use debugging when reproducing an issue locally and inspecting behavior step by step. Use tracing when failures are non-deterministic, environment-specific, or occur only under CI and parallel execution. Together, they form a complete Playwright debugging strategy.
Advanced Playwright Debugging Techniques
Modern Playwright failures usually fall into a few repeatable buckets: network uncertainty, timing issues, missing artifacts, fixture setup problems, or assertions that fail without obvious reasons. The sections below explain how to debug each category without relying on repeated reruns.
Debugging Network, Timeouts, and Waits
Network and timing issues often surface as locator timeouts or navigation failures even when the real cause is a delayed request or incorrect wait condition.
- Identify whether the failing step depends on an API call or async update
- Correlate failure timing with network activity using traces
- Log failed API responses instead of only UI actions
- Distinguish locator, navigation, and assertion timeouts to pinpoint the cause
Replace hard waits with waits tied to real application signals
page.on('response', async (res) => {

  if (res.url().includes('/api/') && res.status() >= 400) {

    console.log(res.status(), res.url());

  }

});
Analyzing Traces, Videos, and Screenshots
Debug artifacts provide the most reliable insight for CI and flaky failures when local reproduction is not possible.
- Start with the trace timeline to find the last successful action
- Use DOM snapshots to verify element presence and visibility
- Compare screenshots to detect overlays, loaders, or blocked UI
- Use video playback to identify animation or timing issues
- Correlate console errors and network failures inside traces
Debugging Fixtures and Setup Failures
Fixture issues often prevent tests from running at all, making failures harder to interpret.
- Check whether the test failed before executing the first step
- Validate fixture dependency order and explicit dependencies
- Watch for incorrect worker-scoped fixtures sharing mutable state
- Add logs around use() to separate setup and teardown failures
- Avoid assertions inside fixtures, which hide root causes
authedPage: async ({ page }, use) => {

  console.log('setup start');

  await use(page);

  console.log('teardown end');

};
Debugging Assertion Failures
Assertion failures usually indicate timing gaps, stale locators, or incorrect assumptions about UI state.
- Confirm the locator targets the intended element
- Differentiate between locator resolution failures and expectation mismatches
- Prefer user-visible assertions such as text, visibility, or URL
- Log minimal state like URL or key text when assertions fail
- Re-query locators after rerenders or route transitions
Read More: Understanding Playwright Assertions
await expect(page.getByRole('heading', { name: 'Checkout' })).toBeVisible();

console.log('Current URL:', page.url());
Common Challenges in Playwright Debugging
Debugging tests in Playwright can sometimes be tricky due to the complexity of modern web applications. Here are some common challenges:
- Unstable Tests (Flakiness): Tests fail intermittently due to timing issues, dynamic content, or network delays. Try using waitfor strategies and mock dynamic content and network responses to ensure a deterministic setup.
Read More: How to avoid Flaky Tests?
- Incorrect Selectors: Selectors do not match the desired element, especially when dealing with dynamic or complex DOMs. Use selectors like data-testid or text content. You can then validate them via Playwright’s inspector.
- Element Not Visible or Detached: Tests fail because elements are hidden or removed from the DOM before interaction. Before interacting, use locator.waitFor() to wait for elements to be visible or stable in the DOM.
- Debugging Timeouts: Actions or assertions exceed the default timeout due to slow loading or animations. Adjust action timeouts and use page.waitForTimeout() or handle slow-loading elements with locator.waitFor().
- Complex Authentication Flows: Tests fail due to login mechanisms like CAPTCHA or multi-factor authentication. In such cases, you can mock authentication or use browser context persistence.
- API and Network Issues: Tests break due to API failures or unexpected server responses.Use Playwright’s route and request interception features to stub network requests.
- Environment Differences: Tests behave differently across environments (local, staging, production). Use environment-specific configuration files. Verify test setups with consistent test data and mocking when possible.
- Browser Compatibility: Tests fail or behave differently on different browsers. So, running your tests on multiple browsers is very important to validate compatibility.
Tips for Running and Debugging Tests in Playwright
Playwright is a powerful framework for end-to-end testing, offering tools and features to write reliable tests and debug effectively.
Here are some best practices and tips to help you get the most out of Playwright and overcome challenges.
1. Use Locators Effectively
- Playwright’s locators are built for reliability, with features like auto-waiting and retry capabilities.
- Locators are strict, meaning any operation implying a target DOM element will throw an error if more than one matching element exists. Hence, create locators uniquely identifying the target element to avoid strictness issues and ensure reliable tests.
- Prefer user facing attributes, such as roles or text, over CSS or XPath selectors to make tests more resilient.
Example:
// Good Practice

page.getByRole('button', { name: 'Submit' });

// Avoid selectors tied to specific styles

page.locator('button.buttonIcon.submit-button');- Use chaining and filtering to narrow down elements.
await page

.getByRole('listitem')

.filter({ hasText: 'Product 2' })

.getByRole('button', { name: 'Add to cart' })

.click();2. Generate Locators Automatically
- Use Playwright’s test generator to create robust locators.
- Run npx playwright codegen <url> to open a browser and record interactions.
- You can inspect, modify, and copy locators directly in the Playwright Inspector or VS Code extension.
3. Leverage Web-First Assertions
- Playwright’s web-first assertions wait for conditions to be met, ensuring stable tests.
// Recommended

await expect(page.getByText('Welcome')).toBeVisible();

// Avoid manual assertions without waiting

expect(await page.getByText('Welcome').isVisible()).toBe(true);
4. Debugging Tips
Here are some debugging tips you can follow:
Local Debugging:
- Use the VS Code extension to debug directly in your editor.
- Run tests in debug mode with npx playwright test –debug.
- Add breakpoints to pause execution and inspect elements.
Debugging on CI:
- Use the Playwright trace viewer to explore test failures.
- Configure traces in the Playwright config and enable them for retries.
npx playwright test --trace on
Read More: Top 15 Debugging Tools
5. Optimize Tests for CI
- Run tests frequently on CI, ideally on each commit or pull request.
- Use Linux environments for cost efficiency.
- Download only the browsers you need to save time and space:
npx playwright install chromium --with-deps
6. Use Parallelism and Sharding
- Run tests in parallel to improve efficiency.
test.describe.configure({ mode: 'parallel' });- Shard test suites across multiple machines for larger test sets:
npx playwright test --shard=1/3
7. Keep Playwright Updated
- Regularly update Playwright to ensure compatibility with the latest browser versions.
npx playwright install @latest
8. Test Across All Browsers
- Ensure your application works for all users by testing across Chromium, Firefox, and WebKit.
- Configure projects in the Playwright config:
projects: [

{ name: 'chromium', use: { ...devices['Desktop Chrome'] } },

{ name: 'firefox', use: { ...devices['Desktop Firefox'] } },

{ name: 'webkit', use: { ...devices['Desktop Safari'] } },

];
9. Use Playwright Tooling
- The VS Code extension improves the development experience.
- The trace viewer helps analyze failures with detailed logs.
- UI Mode enables a time-travel-like experience for exploring and debugging tests.
Read More: Top 20 Best VS-Code Extensions
10. Lint and Optimize Your Code
Use TypeScript and linting with ESLint to catch errors early.
Ensure asynchronous Playwright calls are properly awaited.
Example:
// ESLint rule to prevent missing awaits

@typescript-eslint/no-floating-promises
Conclusion
While Playwright offers different debugging options for tests, it is up to you to choose the most suitable way to debug your tests to deliver a high-quality web application. No matter which debugging option you opt for, it is crucial to consider the real user conditions which only possible by testing on real devices.
- Access 3500+ browser-device-OS combinations to integrate Playwright tests with BrowserStack Automate.
- It can be integrated with CI/CD pipelines like Jenkins, Travis CI, CircleCI, Gitlab, Azure, Bamboo, etc., and help Agile teams run Parallel tests for a faster and more accurate testing experience.
View all BrowserStack Integrations
Useful Resources for Playwright
- Playwright Automation Framework
- Playwright Java Tutorial
- Playwright Python tutorial
- Playwright Debugging
- End to End Testing using Playwright
- Visual Regression Testing Using Playwright
- Mastering End-to-End Testing with Playwright and Docker
- Page Object Model in Playwright
- Scroll to Element in Playwright
- Understanding Playwright Assertions
- Cross Browser Testing using Playwright
- Playwright Selectors
- Playwright and Cucumber Automation
Tool Comparisons:

