Did you also think inspecting elements on Android is just like on desktop? Like most testers I assumed it works the same way.
But when I tried, things did not add up. Layouts looked fine on one device but broke on another, buttons refused to respond, and some elements seemed impossible to access.
It took me a while to figure out the techniques and tools that actually make inspecting elements on Android reliable, even for tricky layouts and dynamic content.
Overview
How To inspect elements on Android in 2026?
This is how to access and debug HTML, CSS, and interactive elements without a computer.
Kiwi Browser (Recommended)
It is a Chromium-based browser with full developer tools built into the mobile app.
- Install Kiwi Browser from the Play Store
- Open the website you want to inspect
- Tap the three dots menu and select Developer Tools
- This opens full DevTools on your phone where you can inspect, edit HTML and CSS, and use the console
Chrome Bookmark Trick (Workaround)
This is a simple way to inspect elements in Chrome on Android using a bookmarklet.
- In Chrome, bookmark the page using the star icon
- Edit the bookmark name to “Inspect” and paste a JavaScript snippet (search for “inspect element javascript bookmarklet”) into the URL field
- Open the site, tap the URL bar, search “Inspect,” and tap the bookmark to activate a floating inspector
For Native Android Apps Using a Computer
Follow these steps to inspect app layouts and elements by connecting your device to a PC.
- Setup: Enable USB Debugging in Developer Options and connect your Android device to the computer
- Android Studio Layout Inspector: Use Layout Inspector to view your app’s UI hierarchy in 3D and check element attributes
Chrome DevTools for WebViews
Debug web content inside apps by connecting via Chrome DevTools.
- Set debuggable=”true” in AndroidManifest.xml for debug builds
- Connect via USB, open Chrome on your computer, go to chrome://inspect, and select your WebView
In this article, I will walk you through all the methods and techniques to reliably inspect elements on Android devices, from built-in developer tools to advanced approaches for tricky layouts and dynamic content.
What is an Inspect Element?
Inspect Element is a browser feature that lets you view and interact with the underlying structure of a web page. It shows the page’s HTML, CSS, and JavaScript so you can understand how elements are built and styled.
On Android, Inspect Element is commonly used to check layouts, identify UI issues, verify responsive behavior, and debug interactions that may behave differently across devices, screen sizes, or browsers.
Why use the Inspect Element?
Using the Inspect element on an Android device helps testers and developers facilitate a smooth user experience. Here’s why using the inspect element is important:
- Debug UI issues: Detect and resolve issues related to layout, styling, and responsiveness.
- Test Web Elements: Inspect and modify HTML, CSS, and JavaScript in real-time.
- Validate Responsive Design: Verify that the web pages adapt seamlessly to different screen sizes.
- Analyze Network Requests: Track and monitor performance metrics, resource loading times, and API calls.
- Web Automation and Scripting: Spot element selectors for testing frameworks like Selenium.
Different Ways to Inspect Element on Android Devices in 2026
There are several methods to inspect elements on Android devices. This section provides a brief overview of the available techniques.
Methods to Inspect Elements on Android Devices
- Using Developer Tools in Chrome & Firefox
- Using Real Android Devices on BrowserStack Live
- Using Google Chrome on Android
- Using Third-Party Applications
- Using Android Developer Mode
Method 1: Using Developer Tools in Chrome & Firefox
Chrome and Firefox provide the feature of Device Simulation in their DevTools.
Note: This method is helpful for checking responsive layouts, but it does not reflect real Android device behavior.
You can learn how to inspect elements on Android from the below steps:
Step 1. Press F12 to start DevTools on the desktop browser (applicable for both browsers)
Step 2. Click on the Toggle Device Bar option

Step 3. Now from the available options choose an Android device
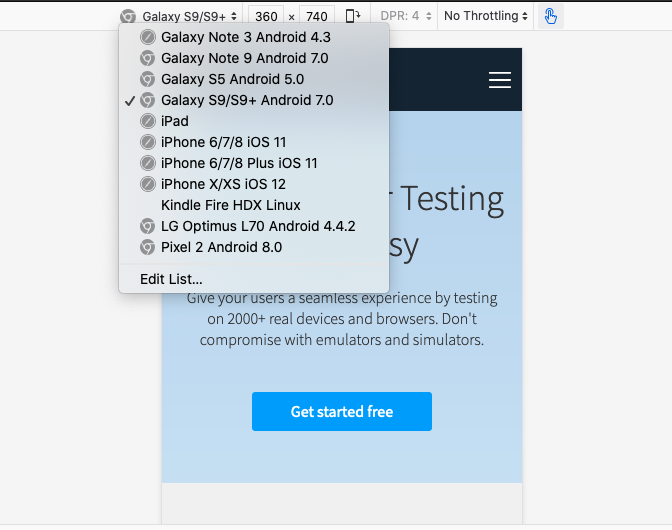
Step 4. Once the user selects a specific Android device, the mobile version of the desired website starts
Step 5. Developers can now start inspecting the website on the desired Android device from their desktops
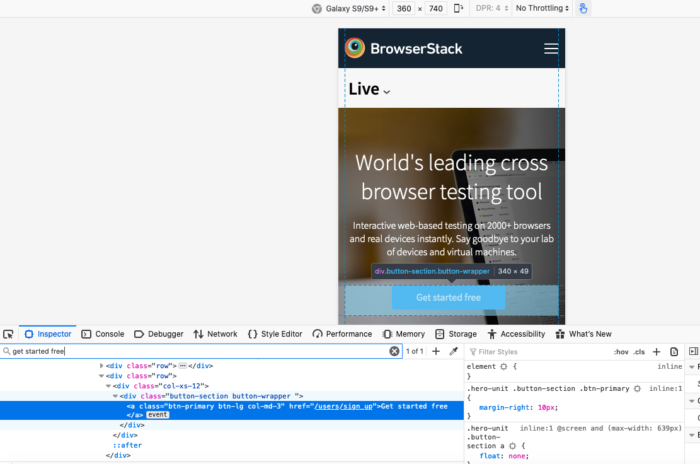
Similar steps can be taken to inspect an element on an iPhone. One needs to select the device accordingly.
Read more: How to Inspect Elements in Chrome
Method 2: Using Real Android Devices on BrowserStack Live
Though the developer tools on chrome and firefox offer the ability to test for responsiveness across some popular devices, your chances of launching a seamless experience across devices are limited. Using a real device cloud can help you mitigate this limitation.
This example includes opening the browserstack.com website, accessing the developer tools to inspect elements, and temporarily modifying the name of a button. he Chrome DevTools is currently only available in Android 7 and above.
Note: This method is helpful for catching device-specific rendering and interaction issues that simulations often miss.
To inspect elements on Samsung Galaxy S22, do the following:
Step 1. Sign up for Free on BrowserStack Live.
Step 2. Click Android > Samsung Galaxy S22 with the Chrome browser.
Wait for the device to be booted.

Step 3. In the browser on the device, enter www.browserstack.com.
Step 4. Inspect specific elements to access the HTML code and debug in real time.
- Hover on App & Browser Testing Made Easy, right-click, and then click Chrome DevTools.

- In the Elements tab, edit the text and replace with Let’s start testing.
- Click anywhere on the Live dashboard to apply the changes.
You can see the following change applied.

It is important to note that these changes are not permanent and just apply to the current session. Using this feature helps you simulate situations that you might encounter as part of your testing.
Method 3: Using Google Chrome on Android
You can use Google Chrome on your Android device to quickly inspect the elements. It allows you to remotely debug any element on your Android device from your desktop and laptop.
Note: This method is helpful for debugging mobile websites on a physical device, but each device must be connected and tested individually.
Here’s how to do this:
- Enable developer options for the Android device
- Select USB Debugging. This creates a debug mode when the USB is connected.
- In your deployment system, open Google Chrome and type chrome://inspect#devices
- Ensure that Discover USB devices is enabled. This will list all the devices connected to the system via an USB.
- Once connected, you will see a label box next to the device name. Enter the URL and click Open.
- Now click Inspect next to the URL.
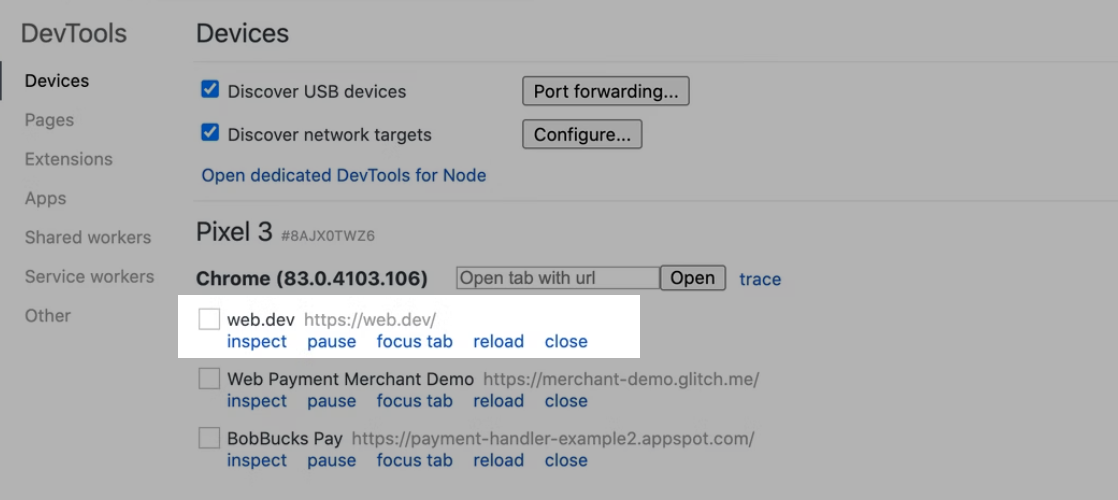
The problem with this option is that you will have to test every other device individually. This becomes cumbersome and time-consuming. It is also difficult to scale as you should have your device lab to test on different devices using this feature.
Read More: How to Debug Website on Mobile Chrome
Method 4: Using Third-Party Applications
Numerous applications like Web Inspector, VT View Source, HTML/CSS Website Inspector, etc., available in the Play Store allow you to inspect elements. These apps allow you to inspect any element and edit it. But, the problem with this approach is that these apps open on a mobile phone with a smaller resolution, making it difficult to edit.
Note: This method is helpful for quick on-device inspection, but limited by smaller screens and lack of scalability.
Also, to use this option, you must install the app on multiple devices, for which you need to have an in-house device lab. Using a real device cloud to test and inspect elements is much easier than using these third-party applications.
Method 5: Using Android Developer Mode
Android devices offers a Developer Mode feature that comes with different debugging tools and has the ability to inspect web elements. You can enable Developer Mode to access USB Debugging that allows interaction between a device and a computer for inspection through Chrome DevTools.
Note: This method is helpful for enabling debugging capabilities, but it does not allow element inspection by itself.
To inspect elements using Android Developer Mode, you can follow the given steps:
1. Enable Developer Mode
- Go to Settings and select About phone
- Unlock Developer Mode by tapping Build Number 7 times
2. Enable USB Debugging
- Select Developer Options in Settings
- Turn on USB Debugging
3. Connect Device to a Computer
- Open chrome://inspect in Google Chrome on a PC using a USB cable
- To detect your phone, enable Discover USB devices
4. Inspect
- Open a webpage in Chrome on Android
- Click Inspect in Chrome DevTools on your PC to start inspecting
Read More: How to debug Angular App in Chrome
Method 6: Using Built-in Developer Tools in Android Browsers
Some Android browsers provide built-in developer tools that allow users to inspect elements directly on the device. This approach does not require a desktop computer, USB debugging, or remote connections, making it useful for quick, ad-hoc inspection.
Using Firefox Browser on Android
Firefox Developer Edition includes built-in web developer tools that run directly within the mobile browser.
- Install Firefox Developer Edition from the Google Play Store
- Open the webpage to be inspected
- Tap the three-dot menu and navigate to Web Developer
- Select tools such as Web Inspector or Console to view and modify HTML, CSS, and JavaScript
This method allows basic inspection directly on the device but offers limited capabilities compared to desktop DevTools.
Also Read: How to Inspect Element in Firefox
Using Kiwi Browser on Android
Kiwi Browser is a Chromium-based Android browser that supports developer tools similar to Chrome DevTools.
- Install Kiwi Browser from the Play Store
- Open the target webpage
- Tap the three-dot menu and enable Developer Tools
- Use the DevTools interface to inspect elements and styles
Note: This method is helpful for inspecting elements directly on the device, but is limited to specific browsers and reduced tooling.
Method 7: Using Remote Debugging via ADB (For Advanced Users)
Android Debug Bridge (ADB) allows advanced users to inspect and debug web content and WebViews running inside Android apps. This method is commonly used when working with hybrid applications or scenarios where browser-based inspection is not sufficient.
Steps to inspect using ADB
- Install Android SDK Platform Tools on your computer
- Enable Developer Options and USB Debugging on the Android device
- Connect the device to the computer using a USB cable
- Use ADB to establish a debugging connection and inspect elements through supported debugging tools
Note: This method is helpful for advanced debugging of WebViews and hybrid apps, but requires technical setup and expertise.
What is the Best Way to Inspect an Element on Android in 2026?
Inspecting elements on real Android devices is the most reliable way to understand how a website behaves for actual users. Android ecosystems vary widely across devices, screen sizes, OS versions, and browsers, and these differences directly affect layout, rendering, and interactions.
Platforms like BrowserStack provide access to real Android devices and browsers through the cloud, allowing teams to inspect elements in conditions that closely match how users experience the web. This removes guesswork by exposing issues that only appear on specific devices, browsers, or network environments.
Here’s why real device testing is the best approach
- Accurate rendering and layout: Elements behave exactly as they do on physical devices, including font rendering, viewport handling, and touch interactions.
- Device and browser coverage: Inspect elements across multiple Android devices, OS versions, and browsers without maintaining an in-house device lab.
- Real interaction debugging: Validate hover states, tap targets, scrolling behavior, and dynamic UI changes that simulations often miss.
- Network and performance realism: Observe how elements load and respond under real network conditions, including slower or unstable connections.
- Higher release confidence: Catch device-specific UI and interaction issues early, reducing production defects and post-release fixes.
Conclusion
Inspecting elements on Android requires choosing the right approach based on accuracy, scale, and the type of application being tested. While desktop simulations and on-device tools are useful for quick checks, they often fall short in capturing real device behavior.
BrowserStack simplifies this process by removing the constraints of physical device availability and complex setup. With access to a wide range of real devices and browsers, teams can inspect elements under real-world conditions, identify device-specific issues early, and release with greater confidence, without maintaining an in-house device lab.
