Inspect Element on a Mac lets you see the structure behind any webpage and understand how the components are built.
Whether you’re checking styles, tracking down bugs, or simply learning how things work, it gives you direct access to the code that shapes what you see.
Overview
To inspect an element on a Mac, you can use:
Method 1: Keyboard Shortcut
- Press Option + Command + I to open Inspect Element in Safari, Chrome, or Firefox.
- This instantly brings up the browser’s developer tools, where you can view and modify the page’s HTML, CSS, and live states.
Method 2: Right-Click
- Right-click (or two-finger click on a trackpad) on the element you want to inspect.
- Choose Inspect or Inspect Element from the context menu to open DevTools directly at that node.
In this article, I will walk you through how to inspect elements on a Mac, step by step, across different browsers.
What is Inspect Element
Inspect Element is a browser feature that allows users to view and temporarily edit a webpage’s HTML, CSS, and JavaScript directly from the browser.
It’s commonly used by developers and designers to understand how a page is structured, debug layout or styling issues, and test changes in real time without affecting the actual source code. This makes it a powerful tool for troubleshooting and refining the visual and functional aspects of a website.
How to Inspect Elements on Mac in 2026?
You can inspect elements on a Mac across Chrome, Safari, and Firefox, but the process differs slightly between browsers.
1. Inspect Elements on Mac Using Safari
On a Mac, Safari requires enabling developer tools before inspecting elements. This gives access to all the underlying HTML, CSS, and browser behaviors.
Step 1: Enable Developer Tools
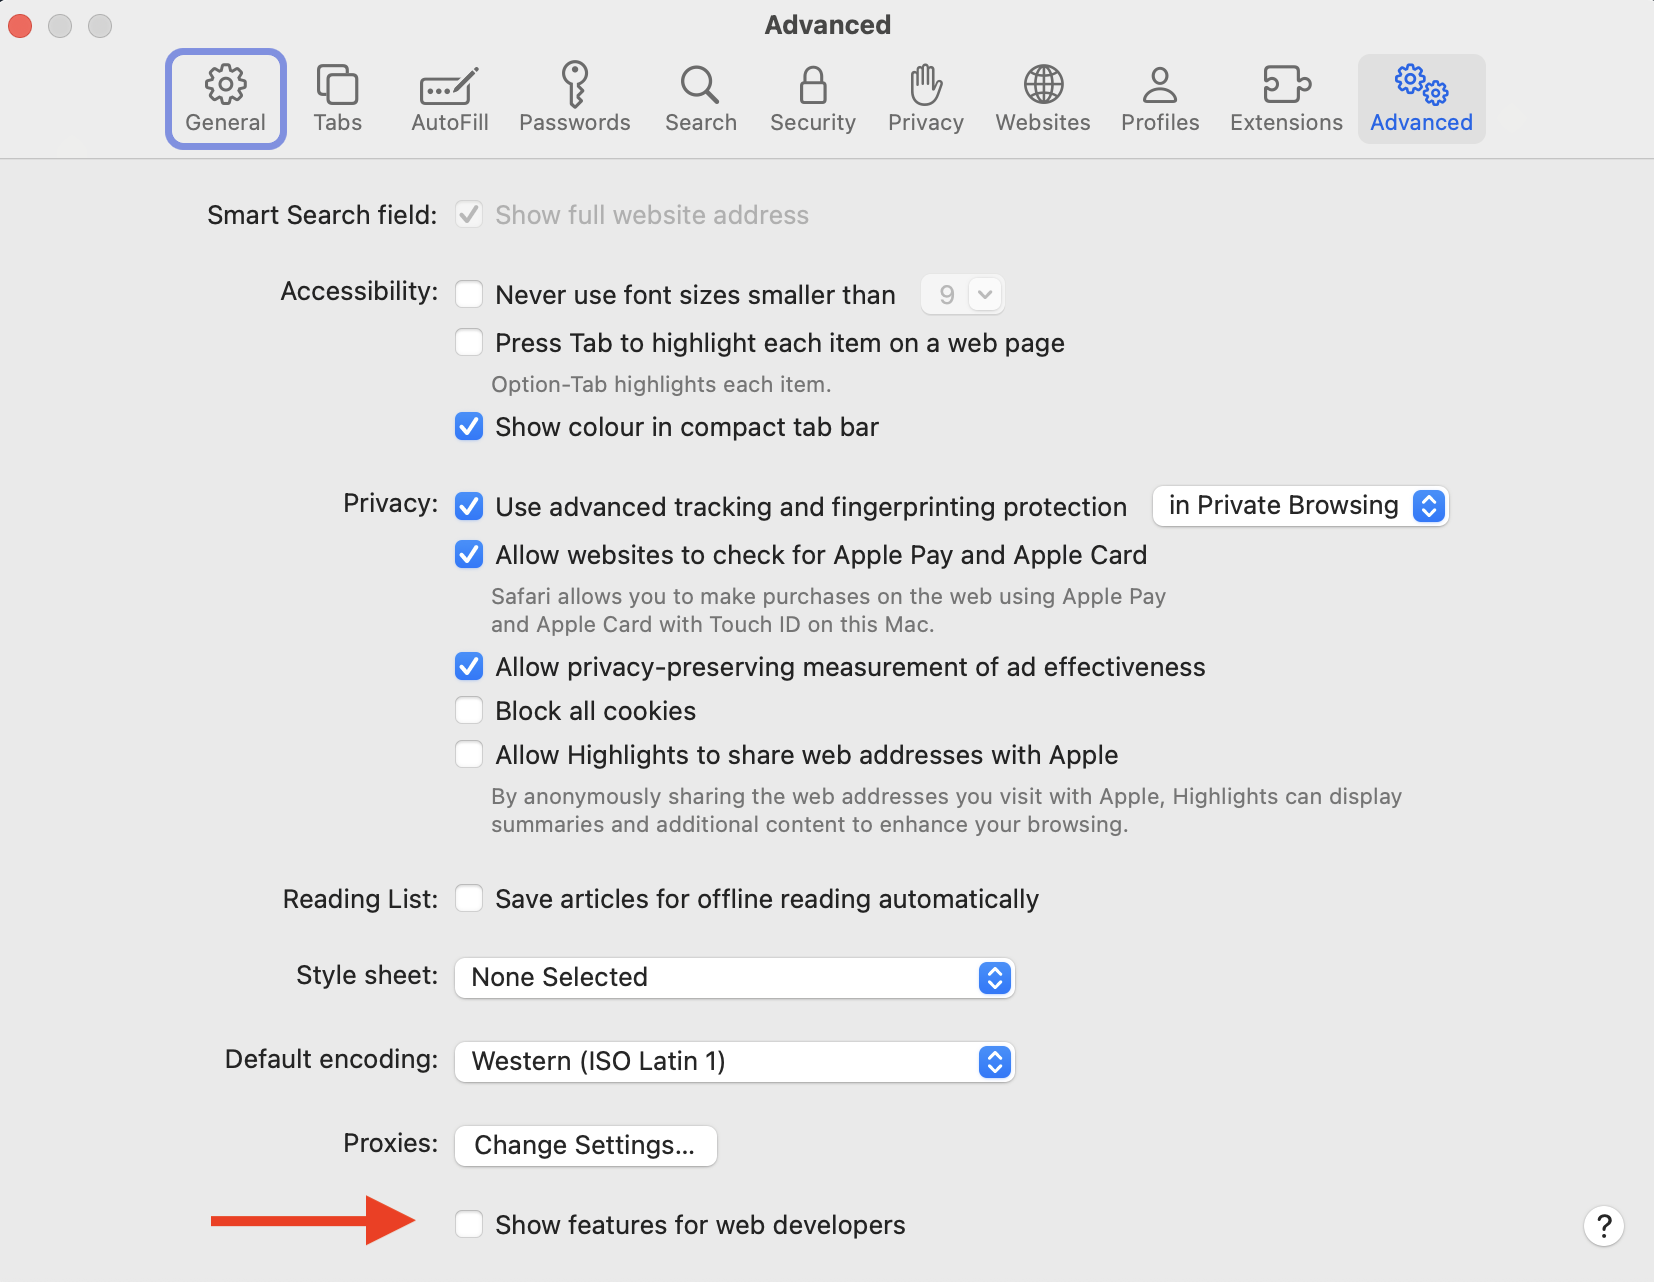
Open Safari and go to Safari > Preferences (or Settings, depending on macOS version). Switch to the Advanced tab and enable the “Show features for web developers”. The Develop menu will now appear in the top bar.
Step 2: Open the Inspector
You can inspect any element by either:
- Right-clicking (or two-finger tapping) on the element and selecting Inspect Element
- Using the shortcut Command (⌘) + Option (⌥) + I
Step 3: Navigate the Inspector Panel
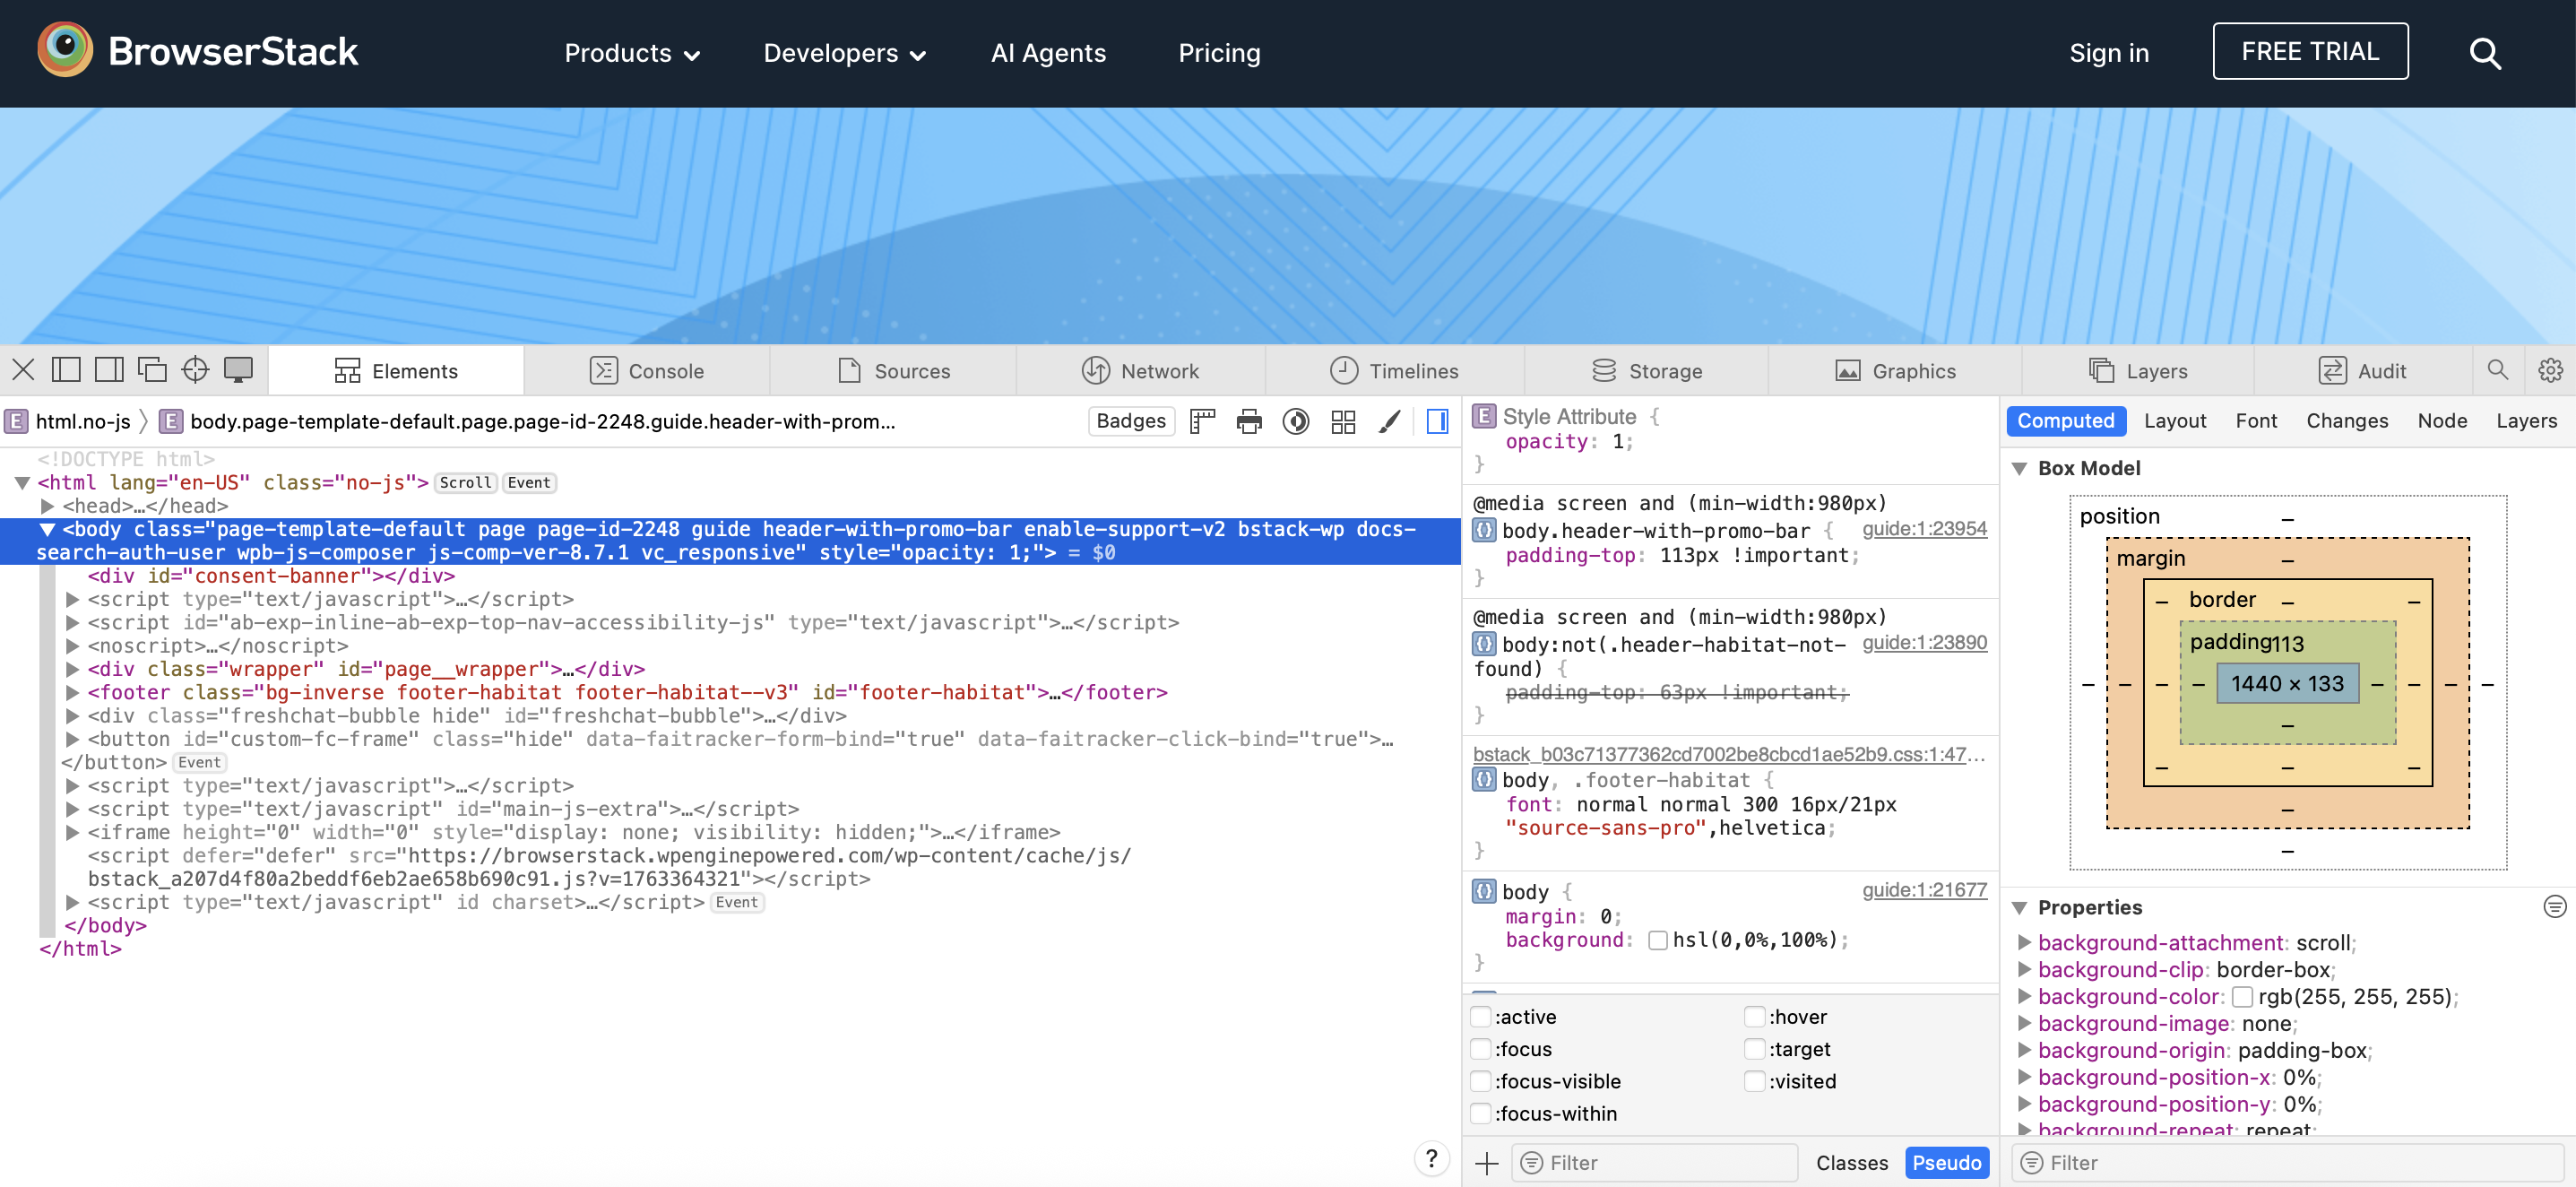
A split view opens with the webpage on one side and the Inspector on the other. Moving your mouse over HTML lines highlights the corresponding elements on the page in real time.
Also Read: How to use Devtools for Safari Mobile View
Understanding Safari’s Web Inspector:
- Elements: Modify and test HTML and CSS instantly
- Console: Execute JavaScript commands and review errors or logs
- Sources: Debug JavaScript and CSS, set breakpoints, and track file execution
- Network: Monitor requests and responses, including APIs, images, and scripts
- Performance (Timelines): Analyze rendering performance, scripting, and layout changes
Read More: How to Perform Network Throttling in Safari?
2. Inspect Elements on Mac Using Chrome
While the workflow is similar to Safari, Chrome’s Developer Tools have their own layout and features that make debugging and testing easier once you know where to look. Here’s how to inspect elements in Chrome.
Step 1: Open Developer Tools
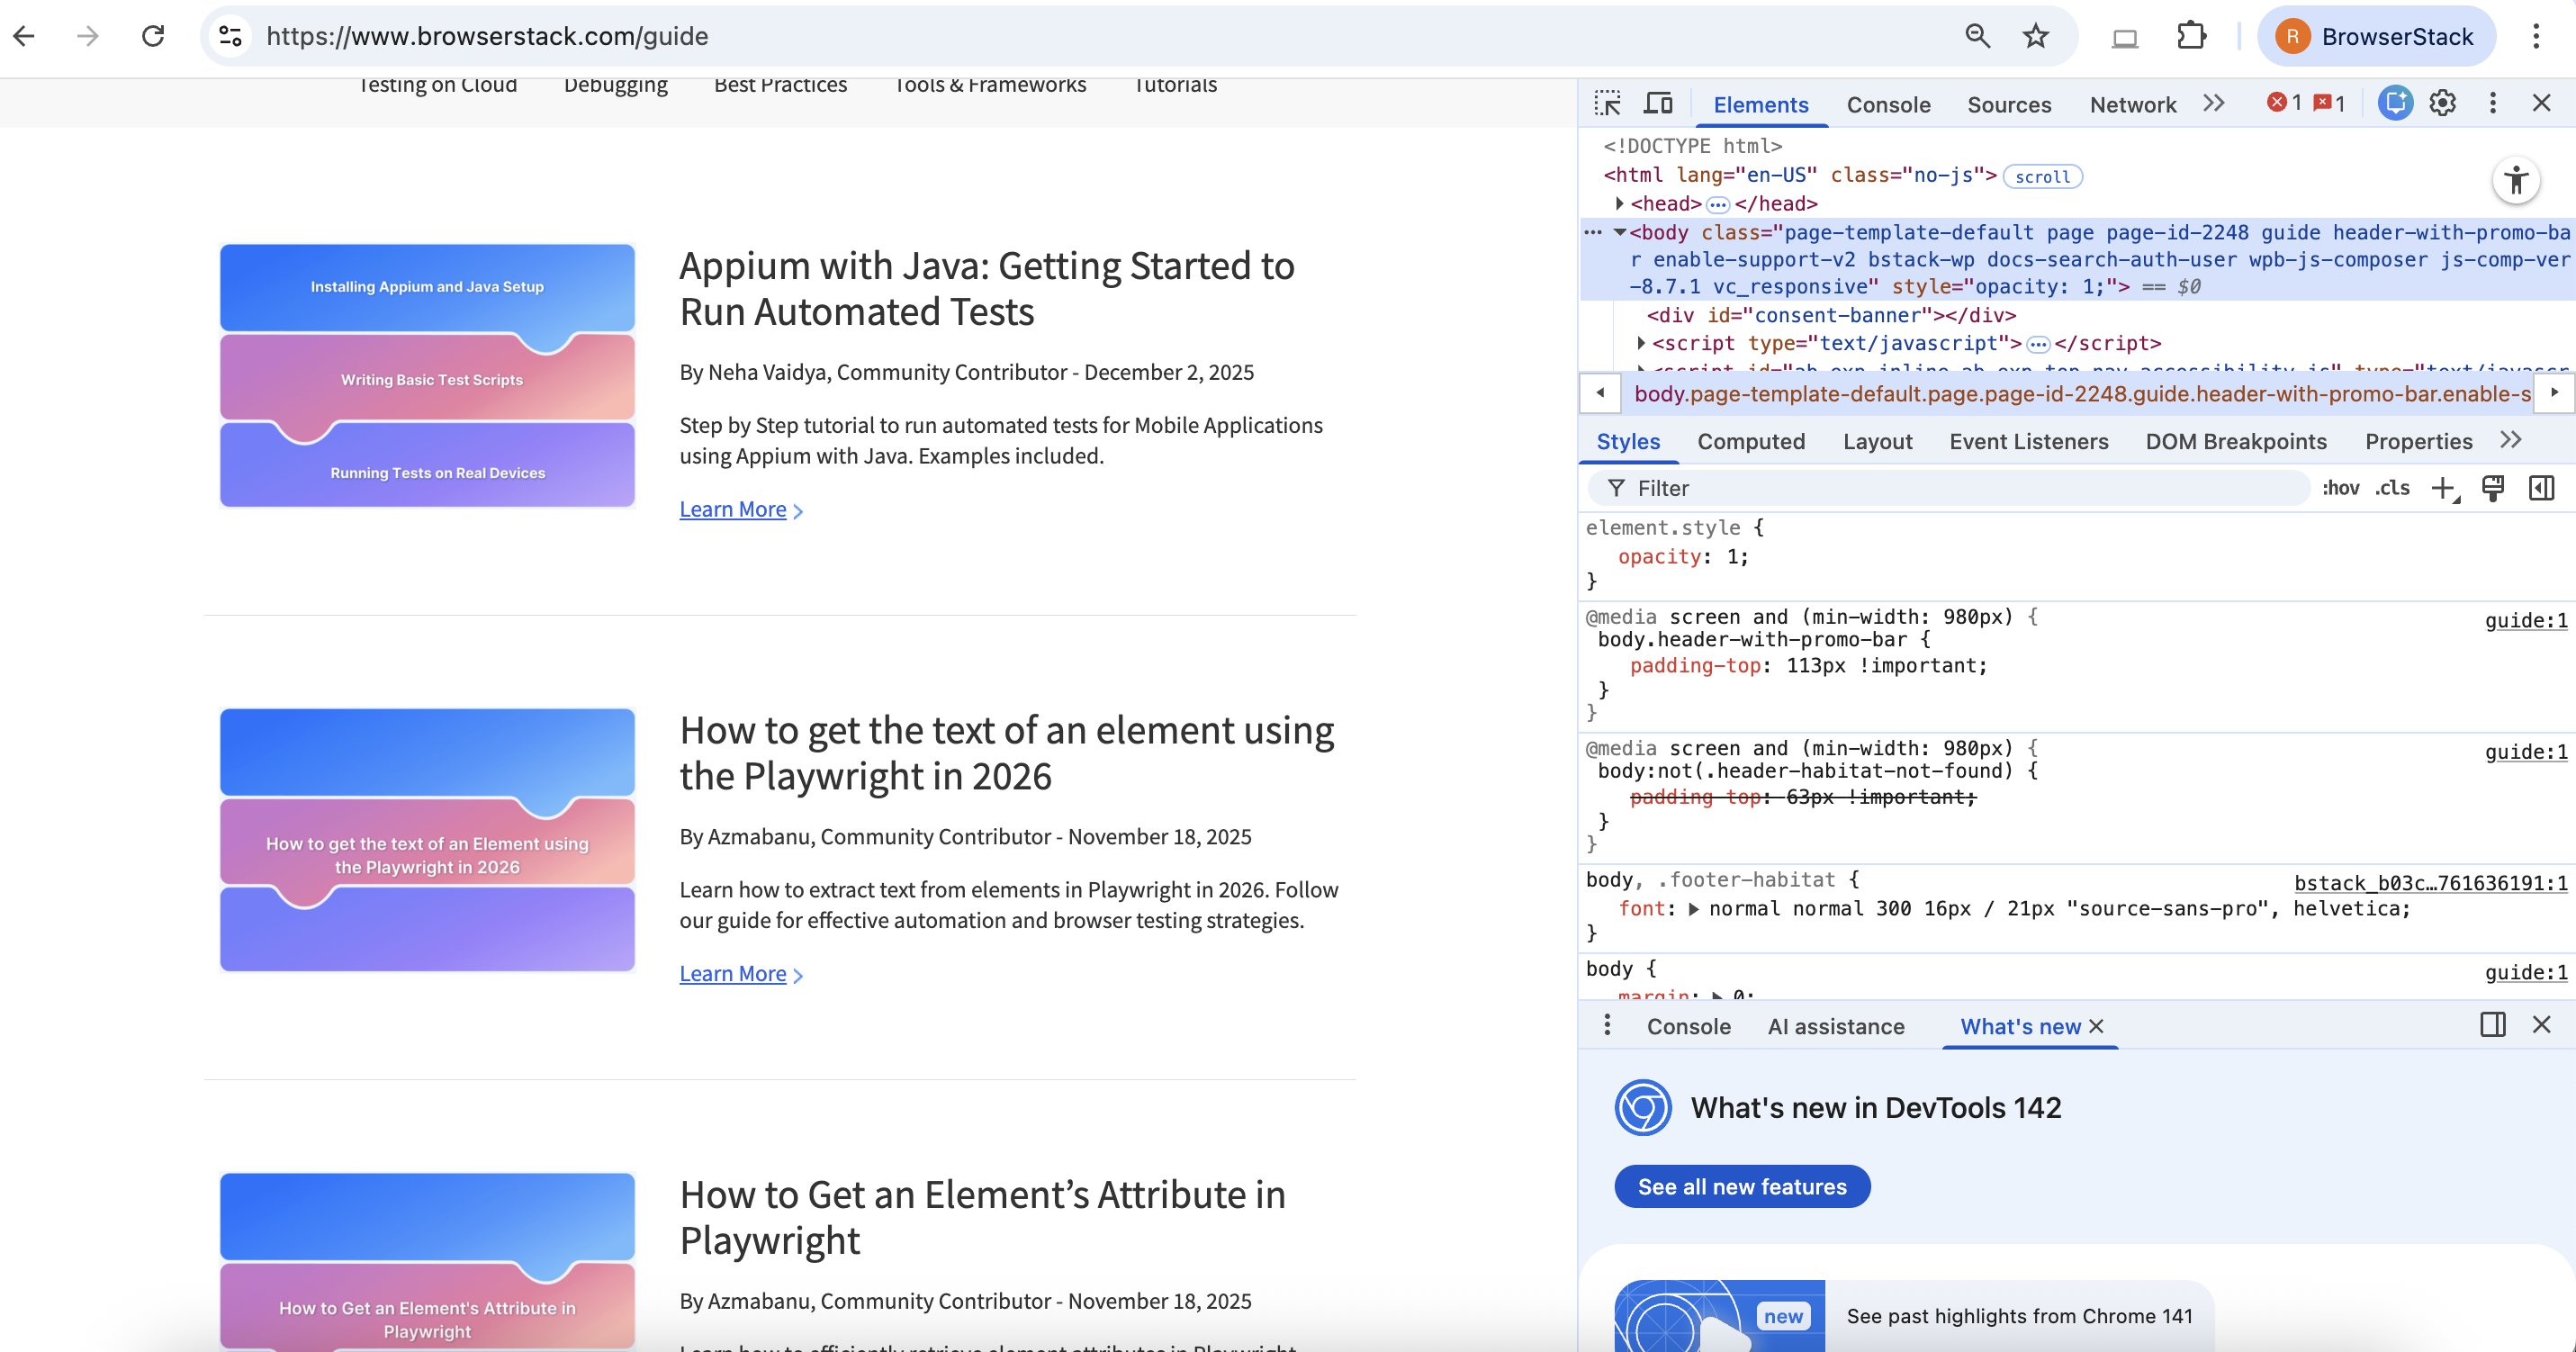
Press Command (⌘) + Option (⌥) + I to open Developer Tools. Alternatively, right-click on any element and select Inspect.
Step 2: Navigate the Inspector
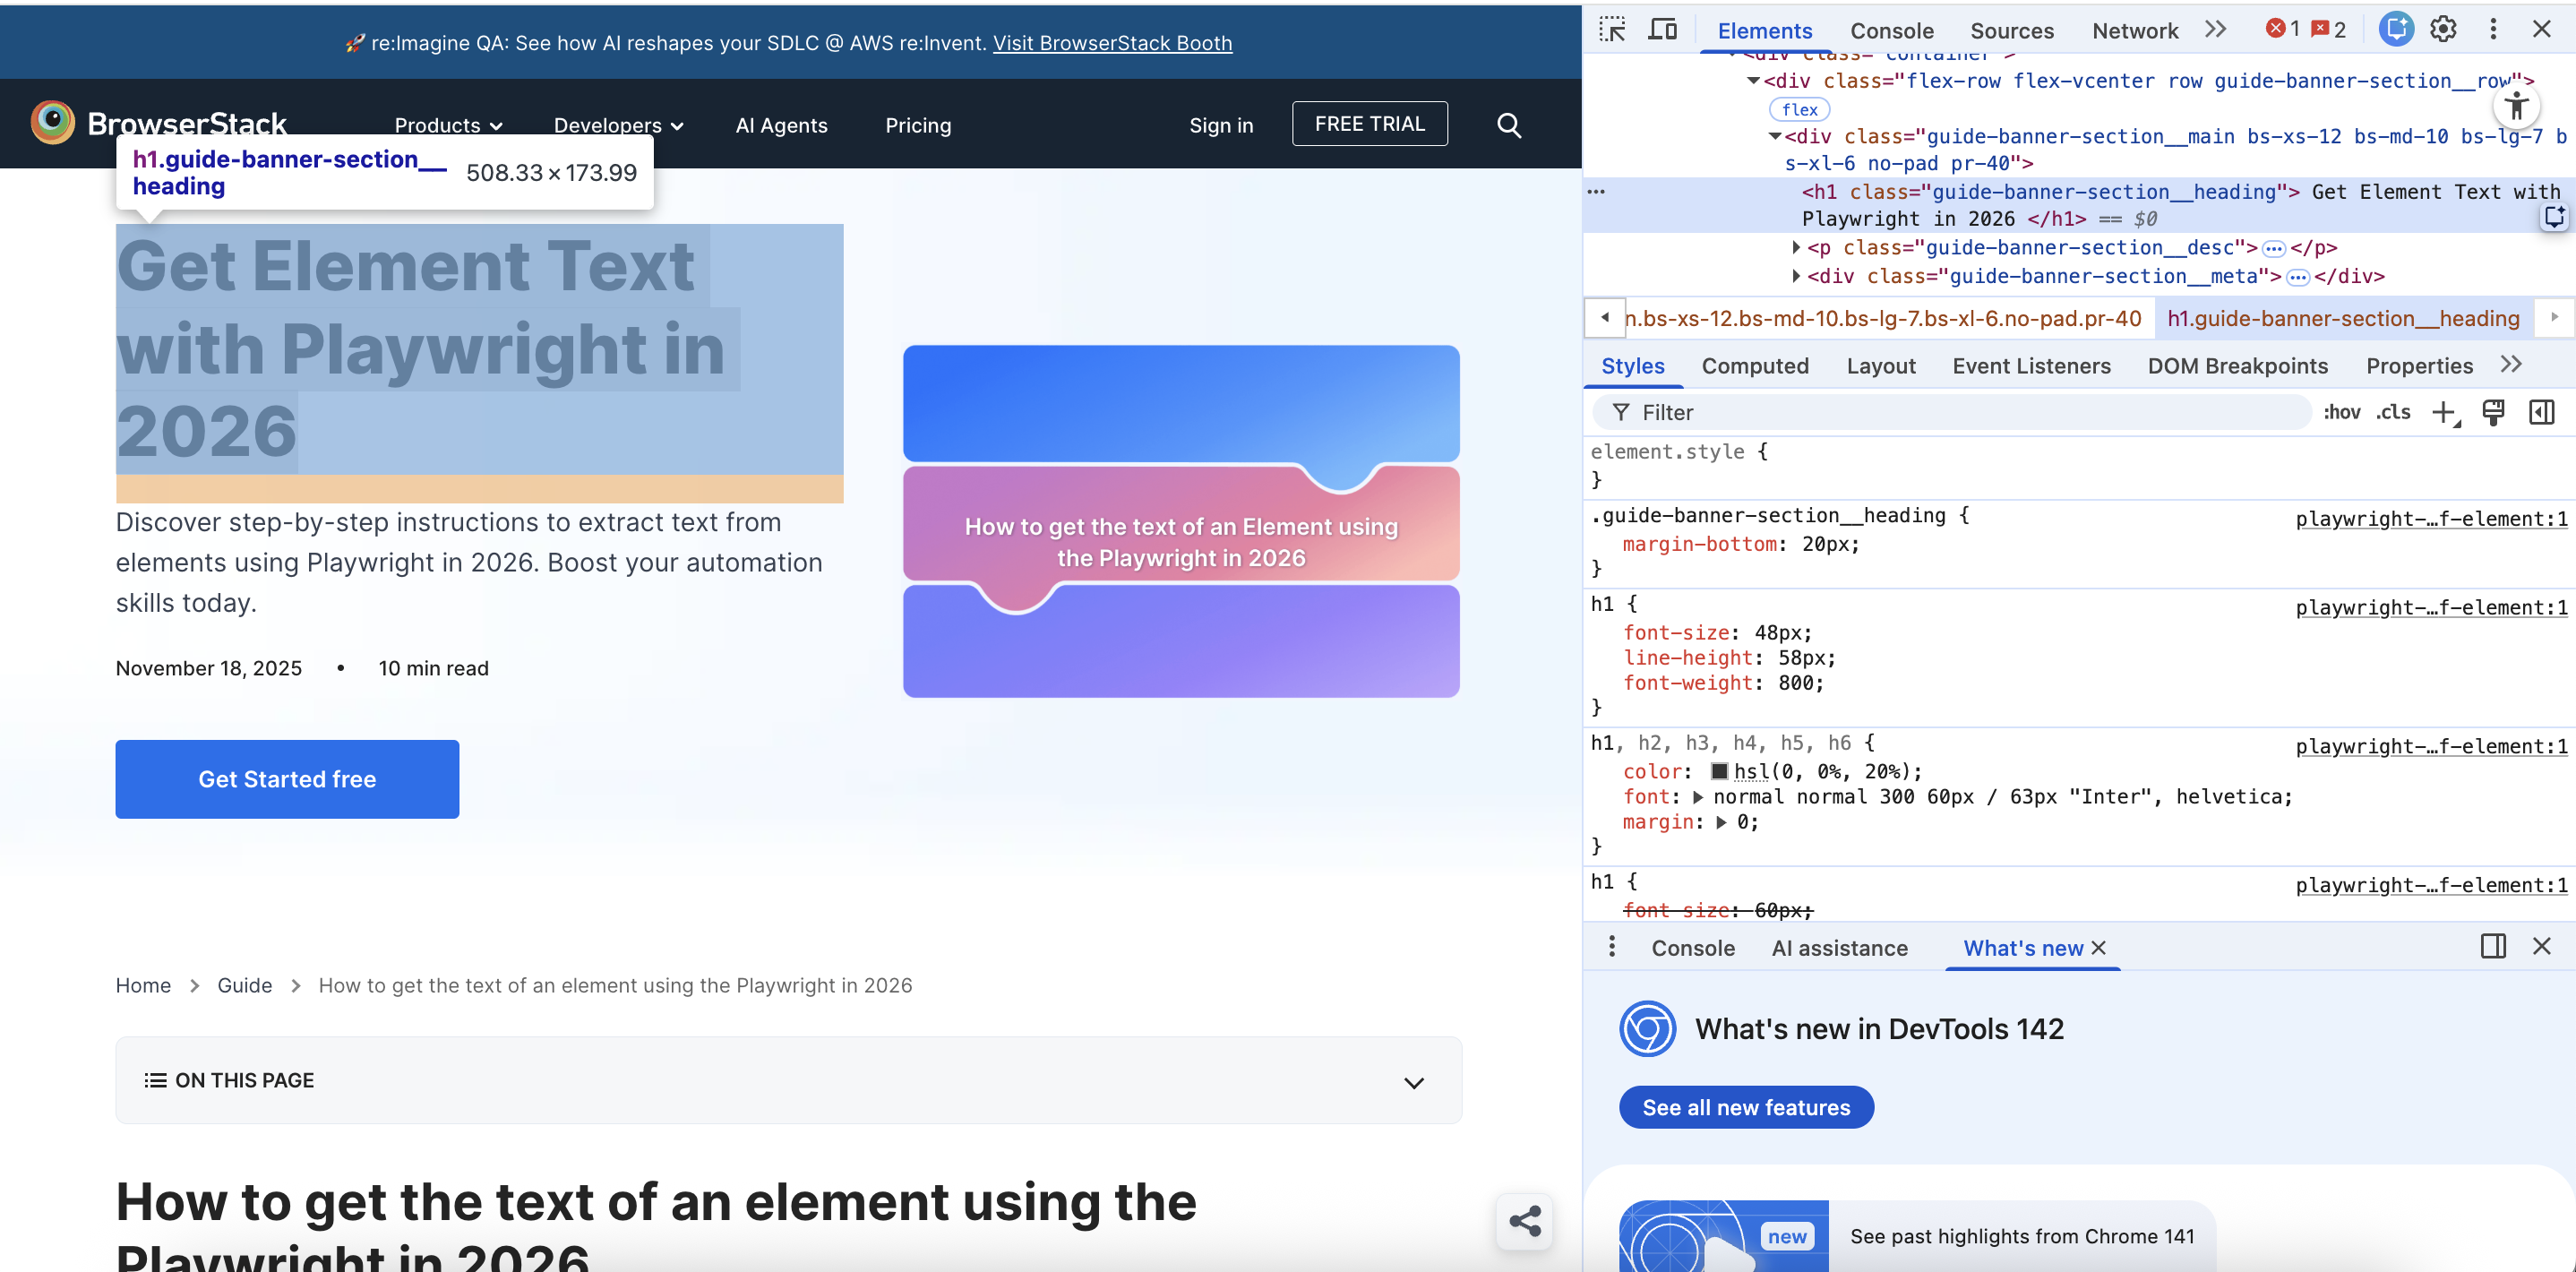
The panel appears at the bottom or side of the browser window. Hovering over lines in the Elements tab highlights the corresponding element on the page.
Step 3: Expand and Inspect HTML
Click an element to view its full HTML structure. Edit attributes, add or remove nodes, and see changes immediately.
Read More: How to Edit HTML in Chrome
Step 4: Edit CSS
In the Styles section, modify existing rules or add new CSS properties. Changes are applied live.
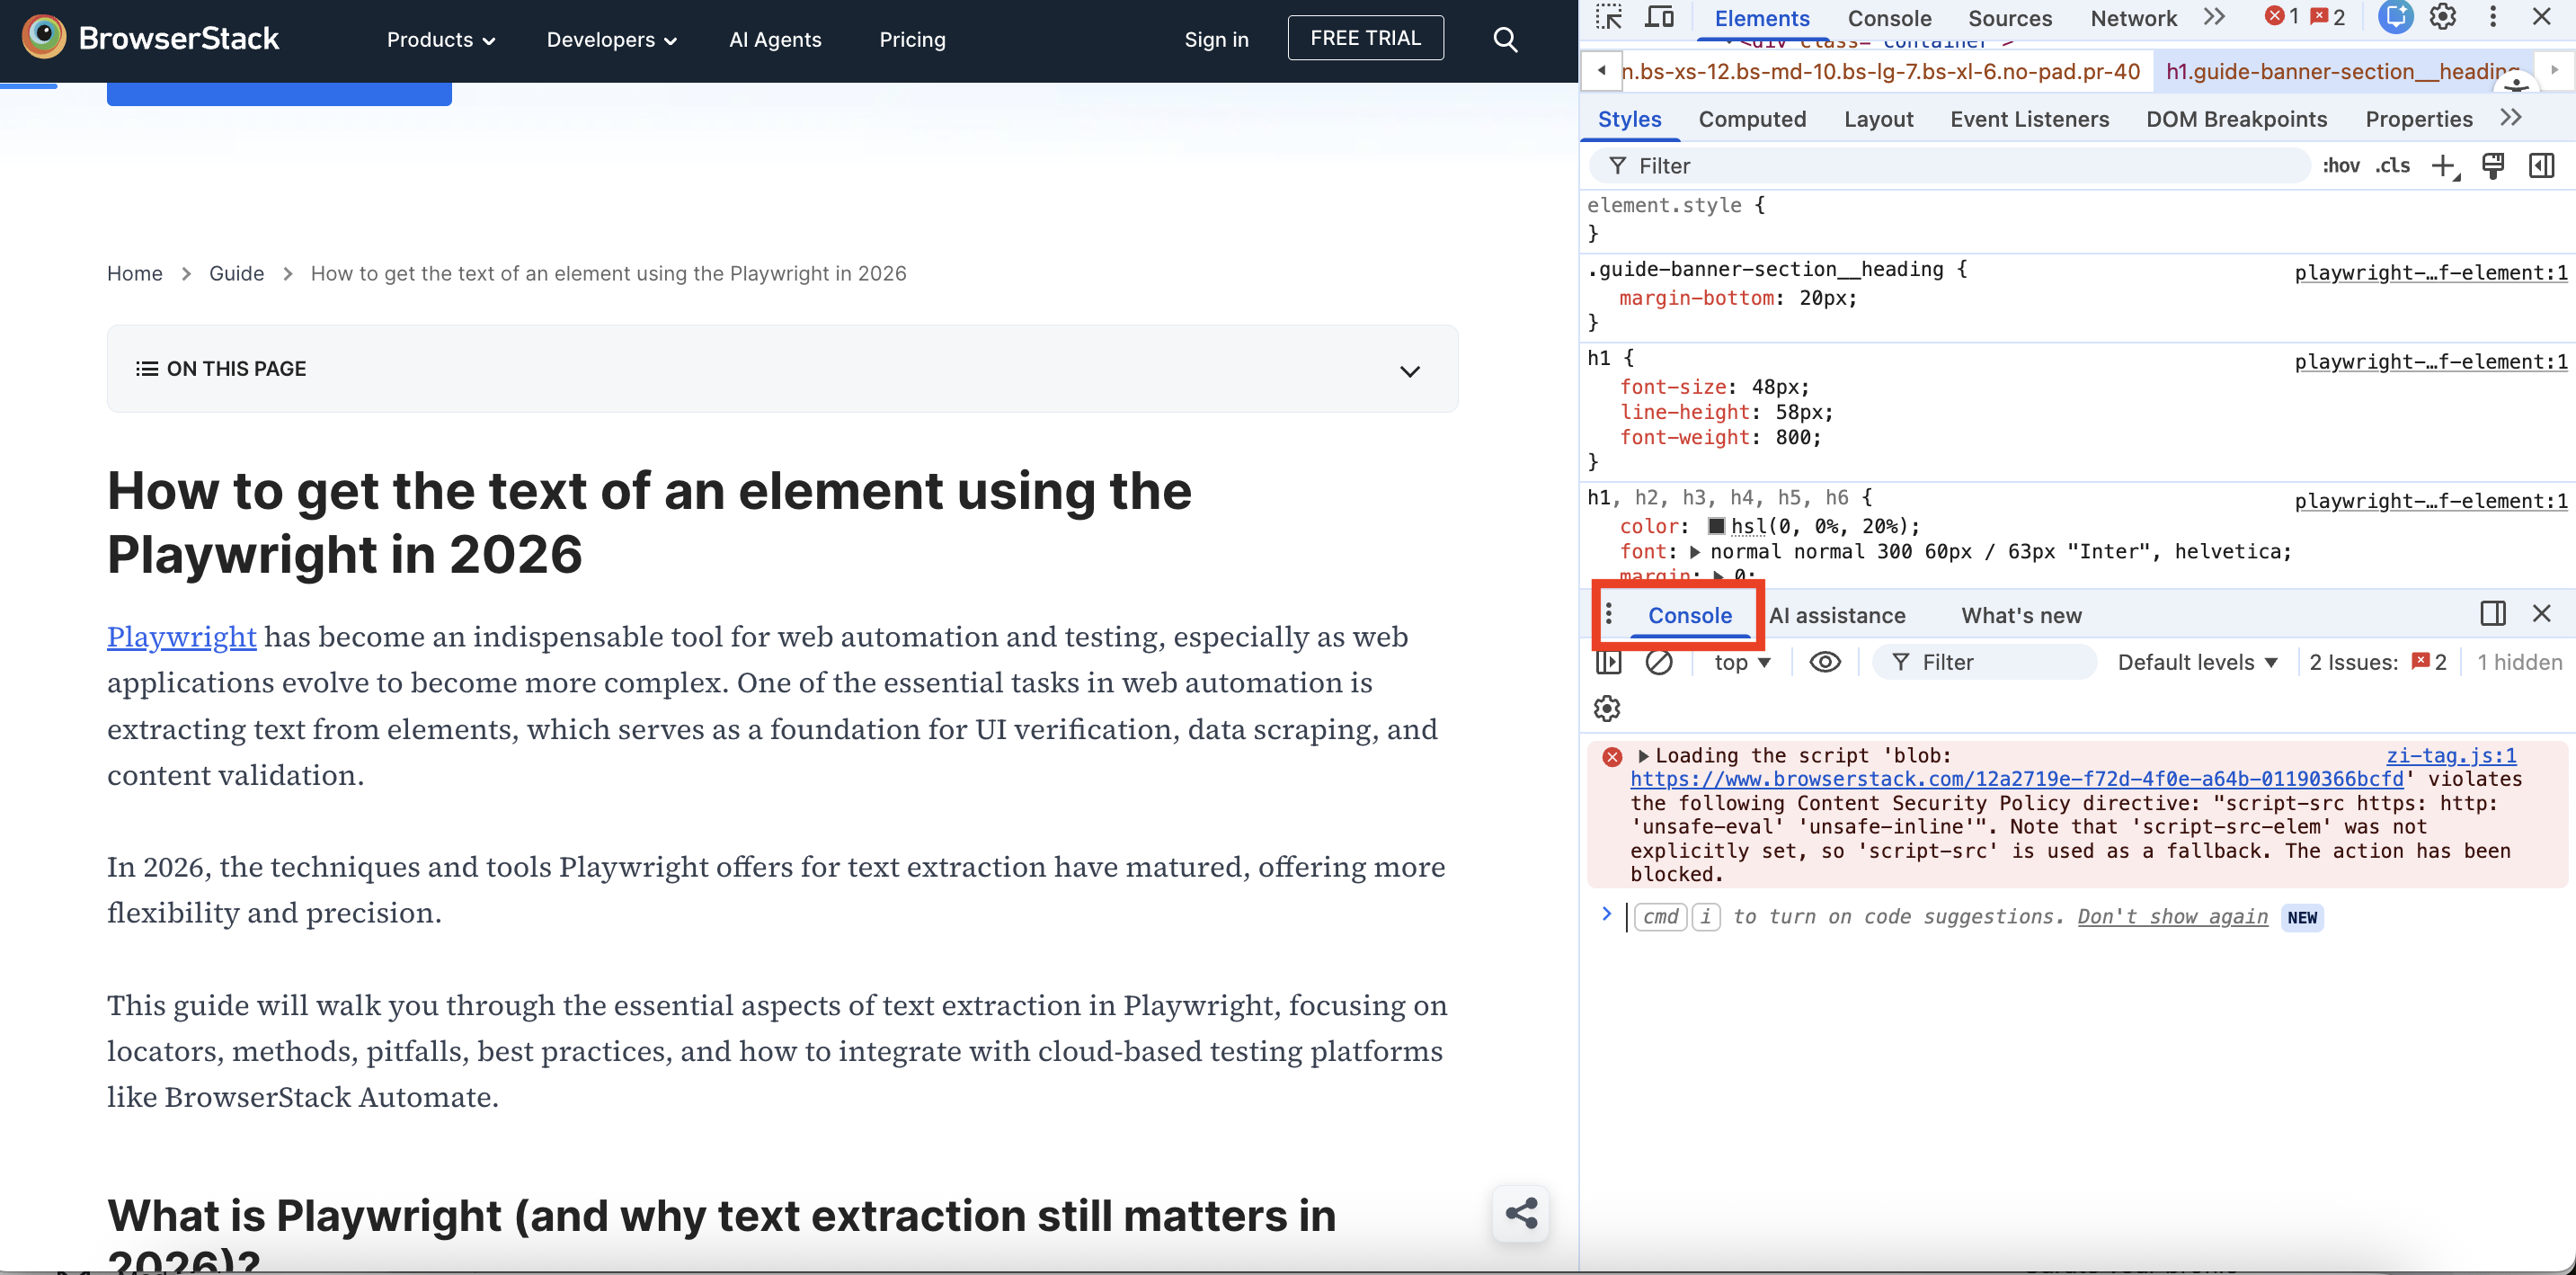
Step 5: Use the Console
Switch to the Console tab to run JavaScript commands, check errors, and debug scripts.
Read More: How to Open Console in Chrome
Step 6: Debug JavaScript
Use the Sources tab to debug JavaScript in Chrome. You can set breakpoints, step through code, and monitor script execution to identify errors or unexpected behavior.
Step 7: Monitor Network Requests
The Network tab shows API calls, image loading, and script activity to help diagnose performance issues.
Step 8: Analyze Performance
The Performance tab profiles page rendering, scripting, and layout calculations for responsive testing.
3. Inspect Elements on Mac Using Firefox
Firefox offers developer tools to inspect HTML, CSS, and scripts directly in the browser. Here’s how to inspect elements in Firefox:
Step 1: Open Developer Tools
Press Command (⌘) + Option (⌥) + I to open Firefox Developer Tools. Alternatively, right-click (or two-finger click) on any page element and select Inspect Element.
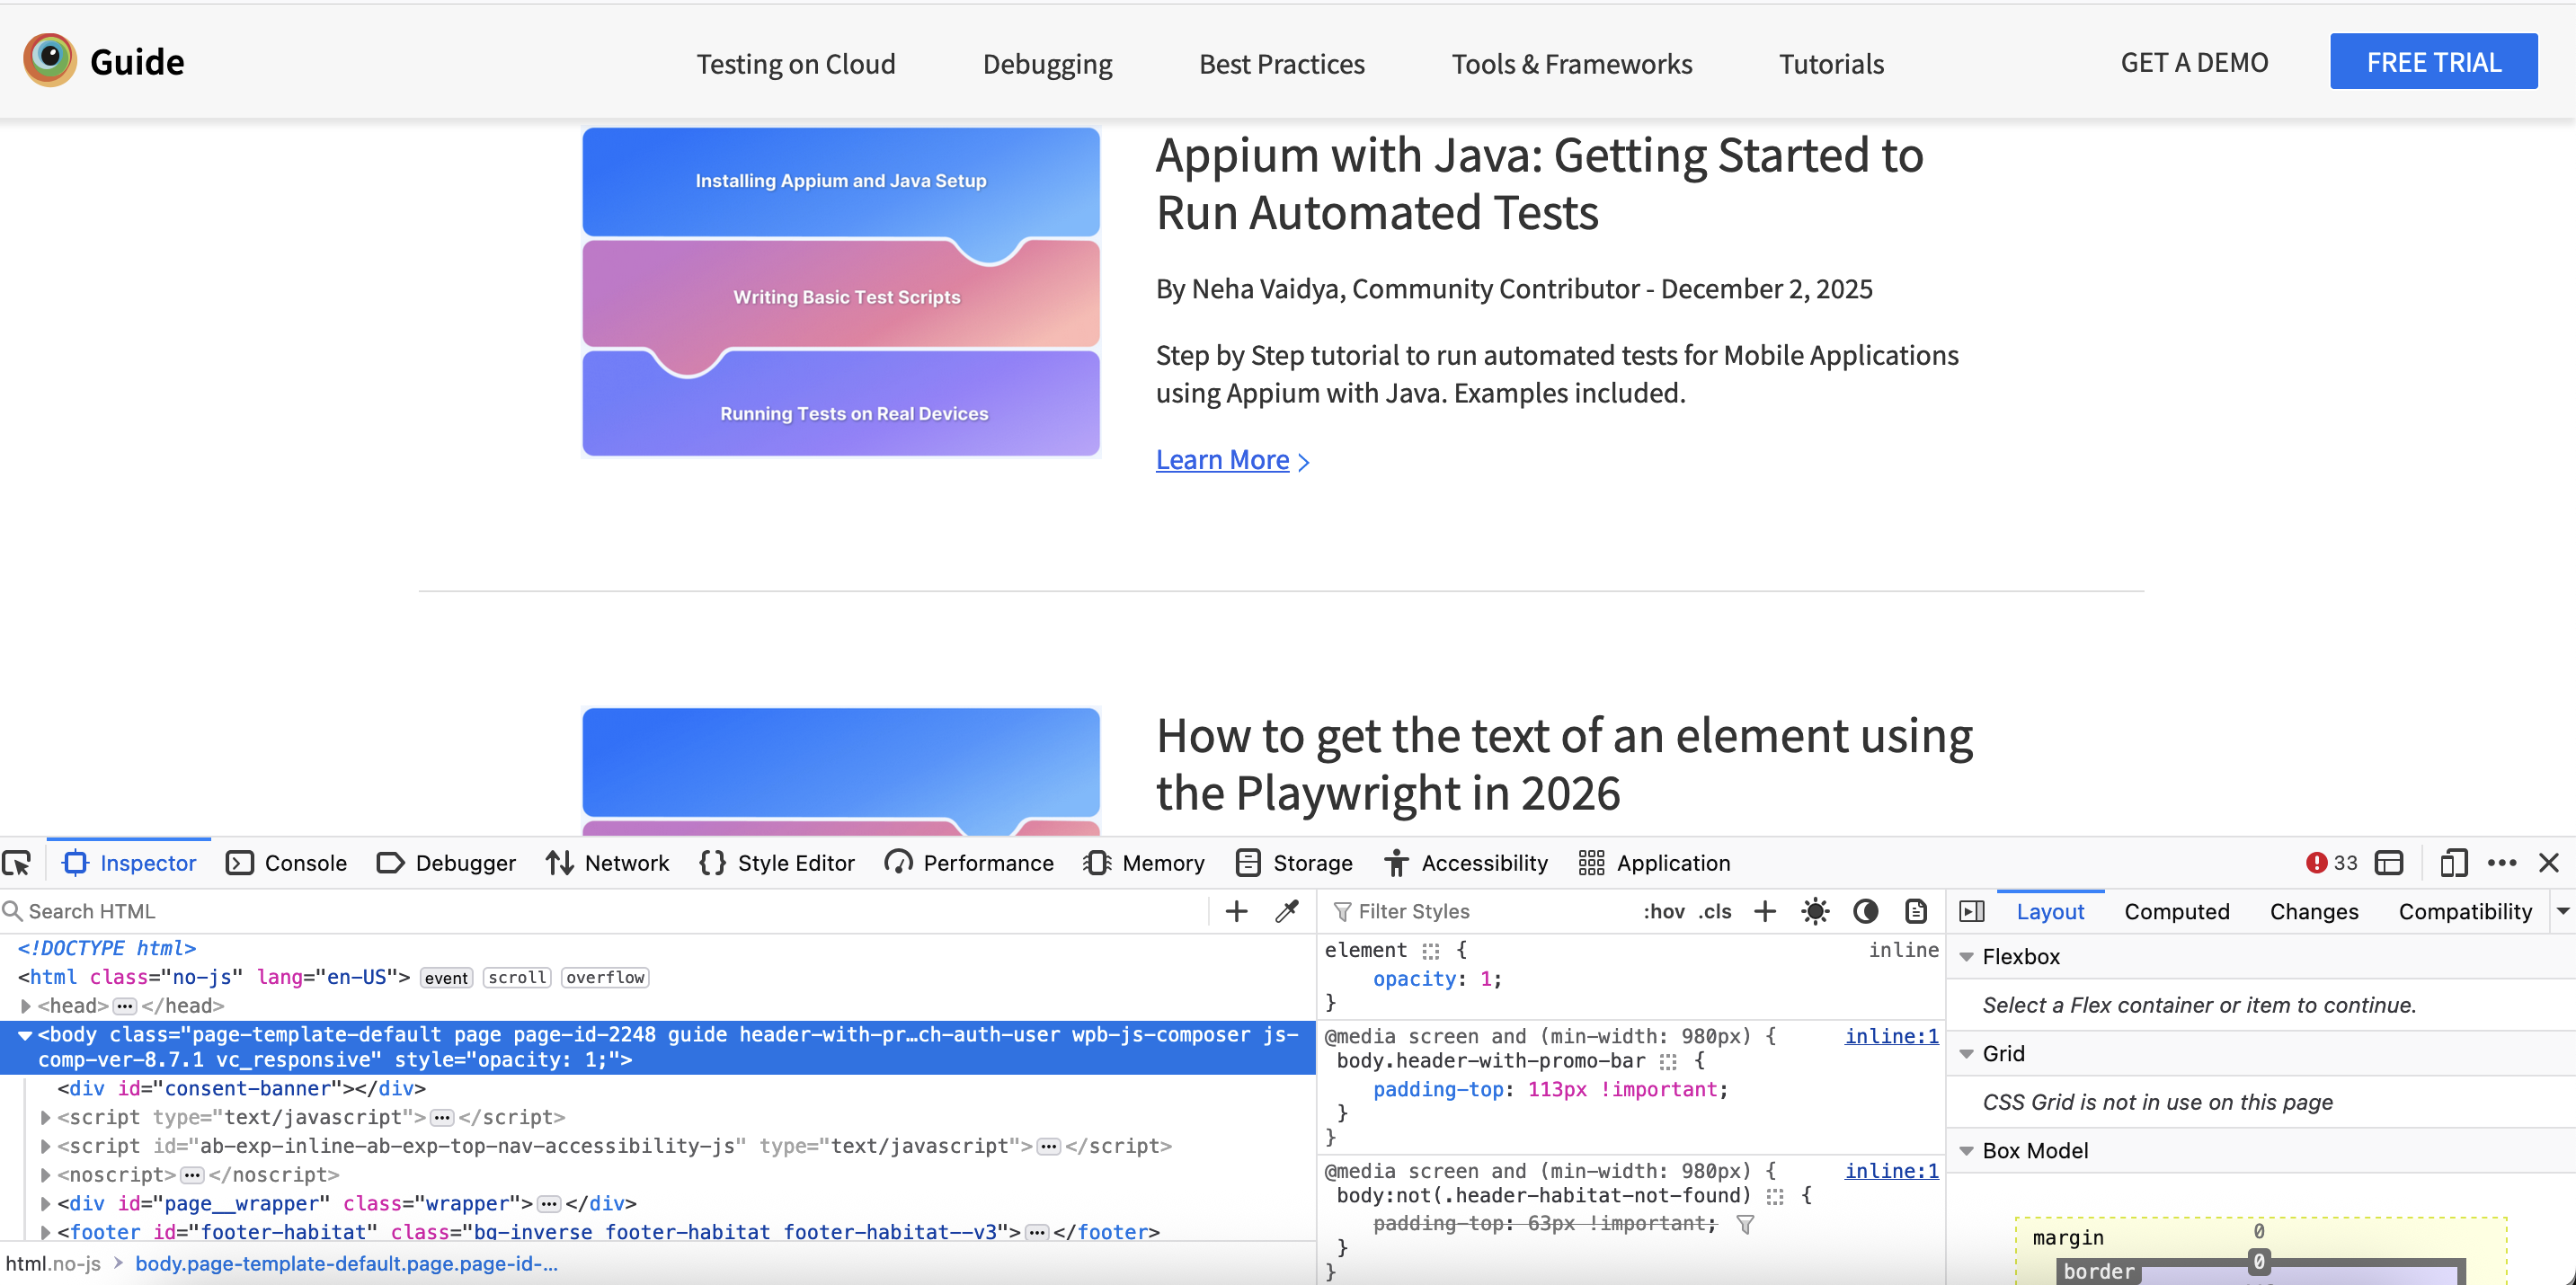
Step 2: Navigate the Inspector
The Inspector panel appears alongside the webpage. Hovering over HTML lines highlights the corresponding element on the page.
Step 3: Expand and Inspect HTML
Click an element in the Inspector tab to see its full HTML structure. You can edit attributes, add or remove elements, and watch changes live.
Step 4: Edit CSS
Within the Rules section, modify existing CSS or add new styles. Changes appear immediately, allowing you to test visual updates.
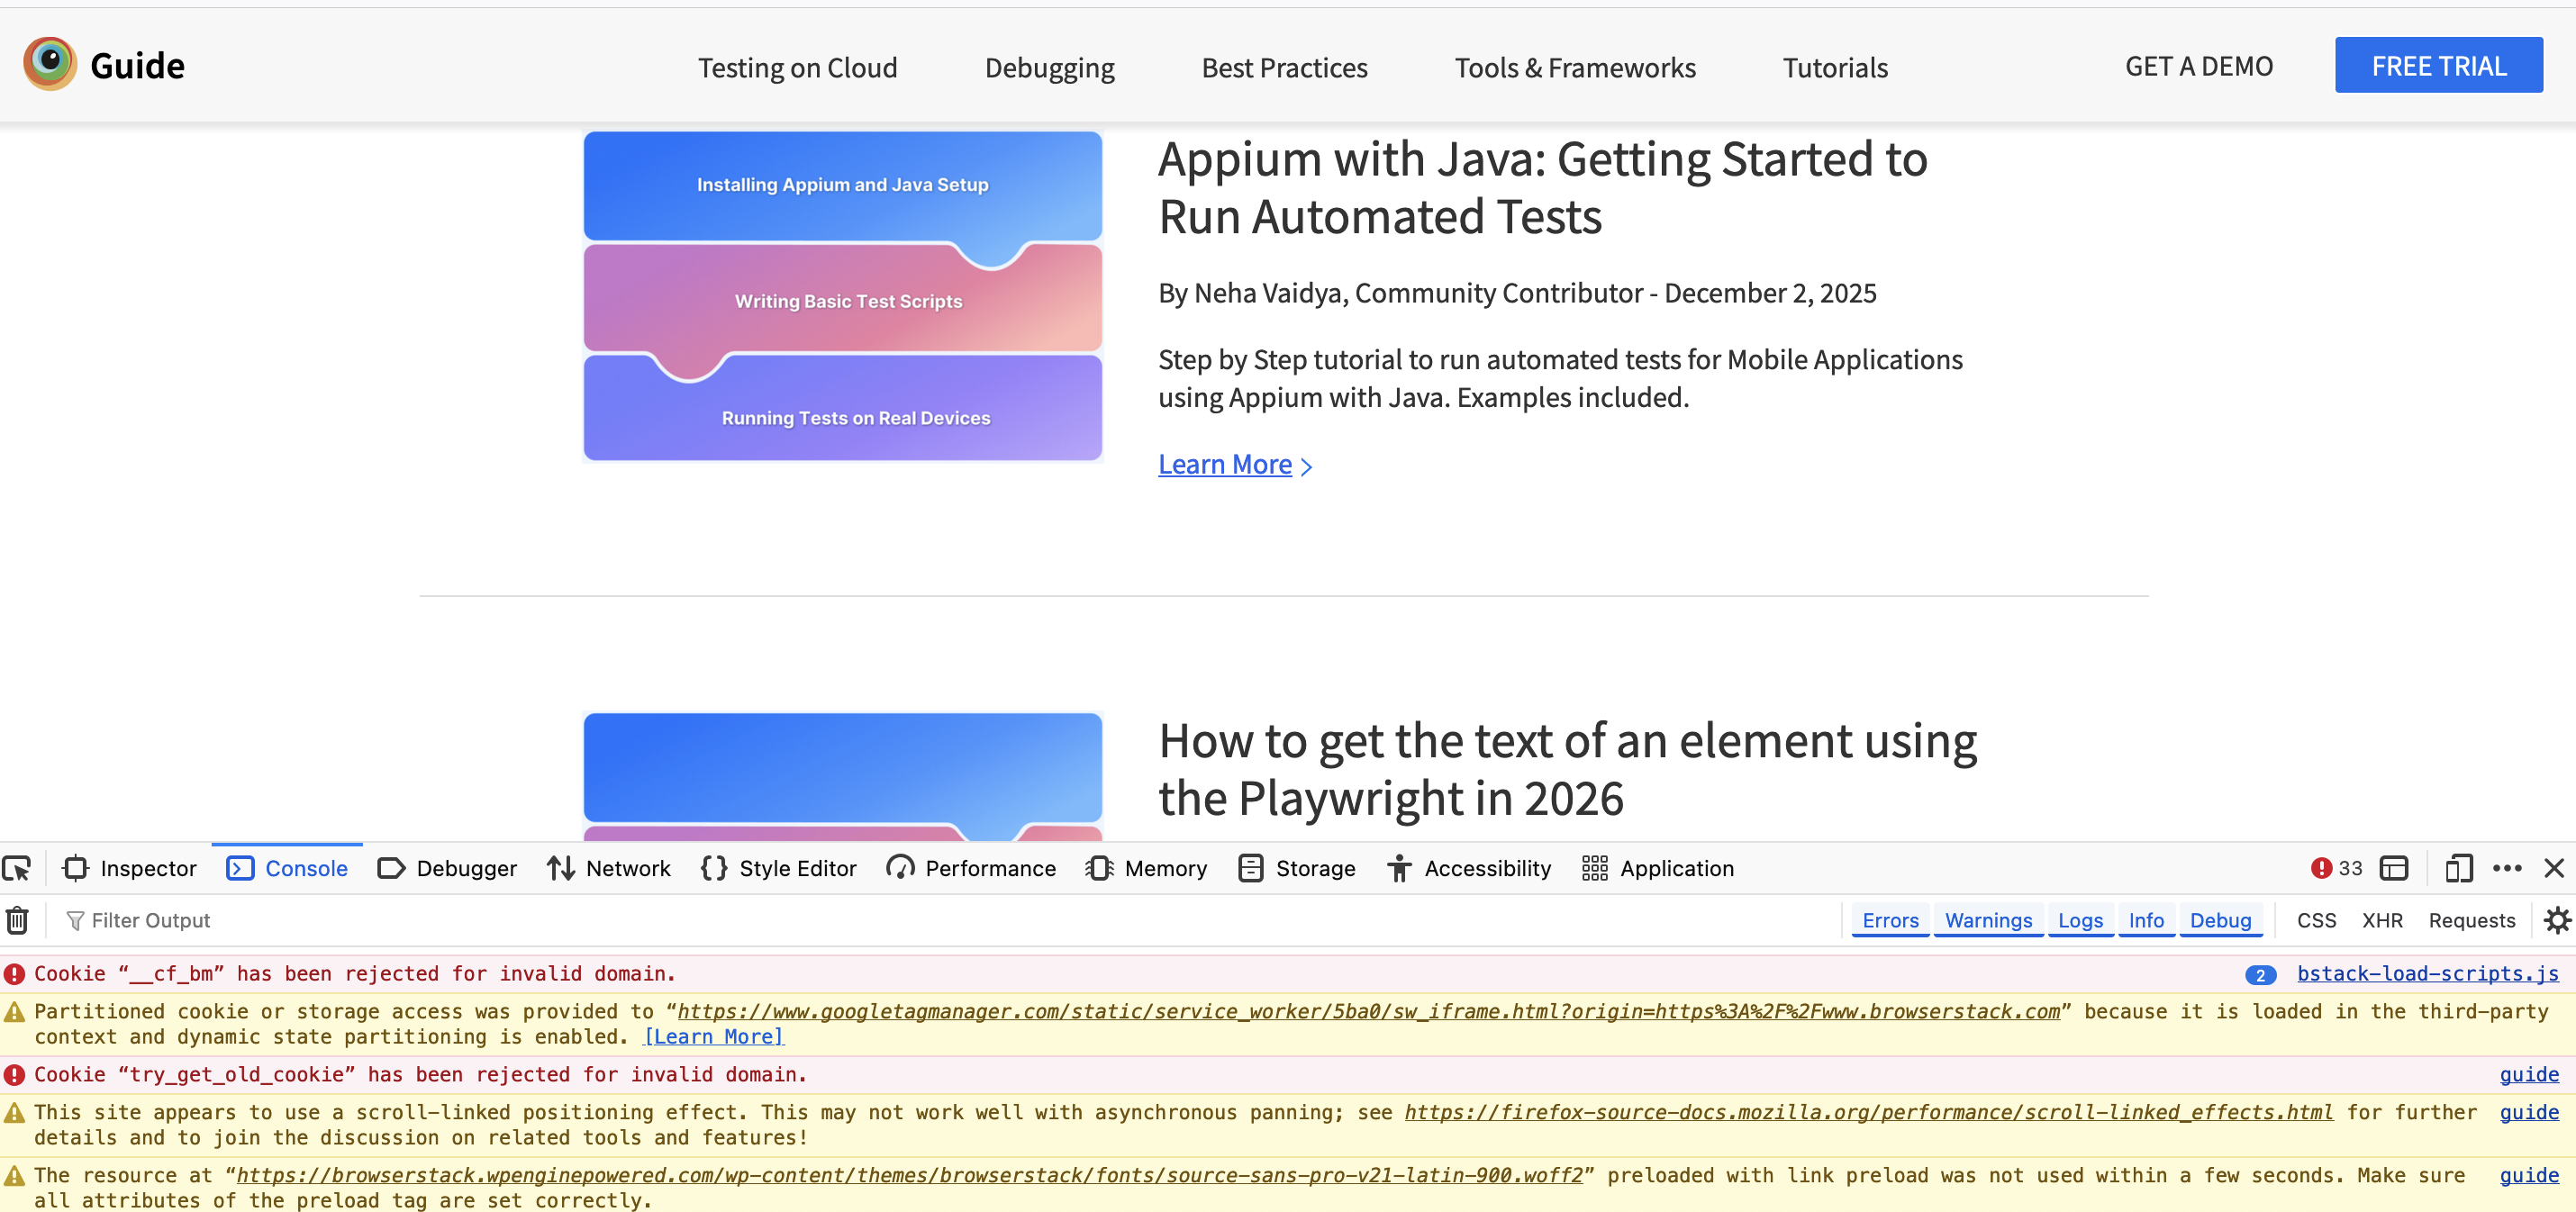
Step 5: Use the Console
Switch to the Console tab to run JavaScript commands and check for errors or debug logs.
Step 6: Debug Scripts
In the Debugger tab, set breakpoints, step through code, and monitor script execution.
Read More: How to Perform Remote Firefox Debugging
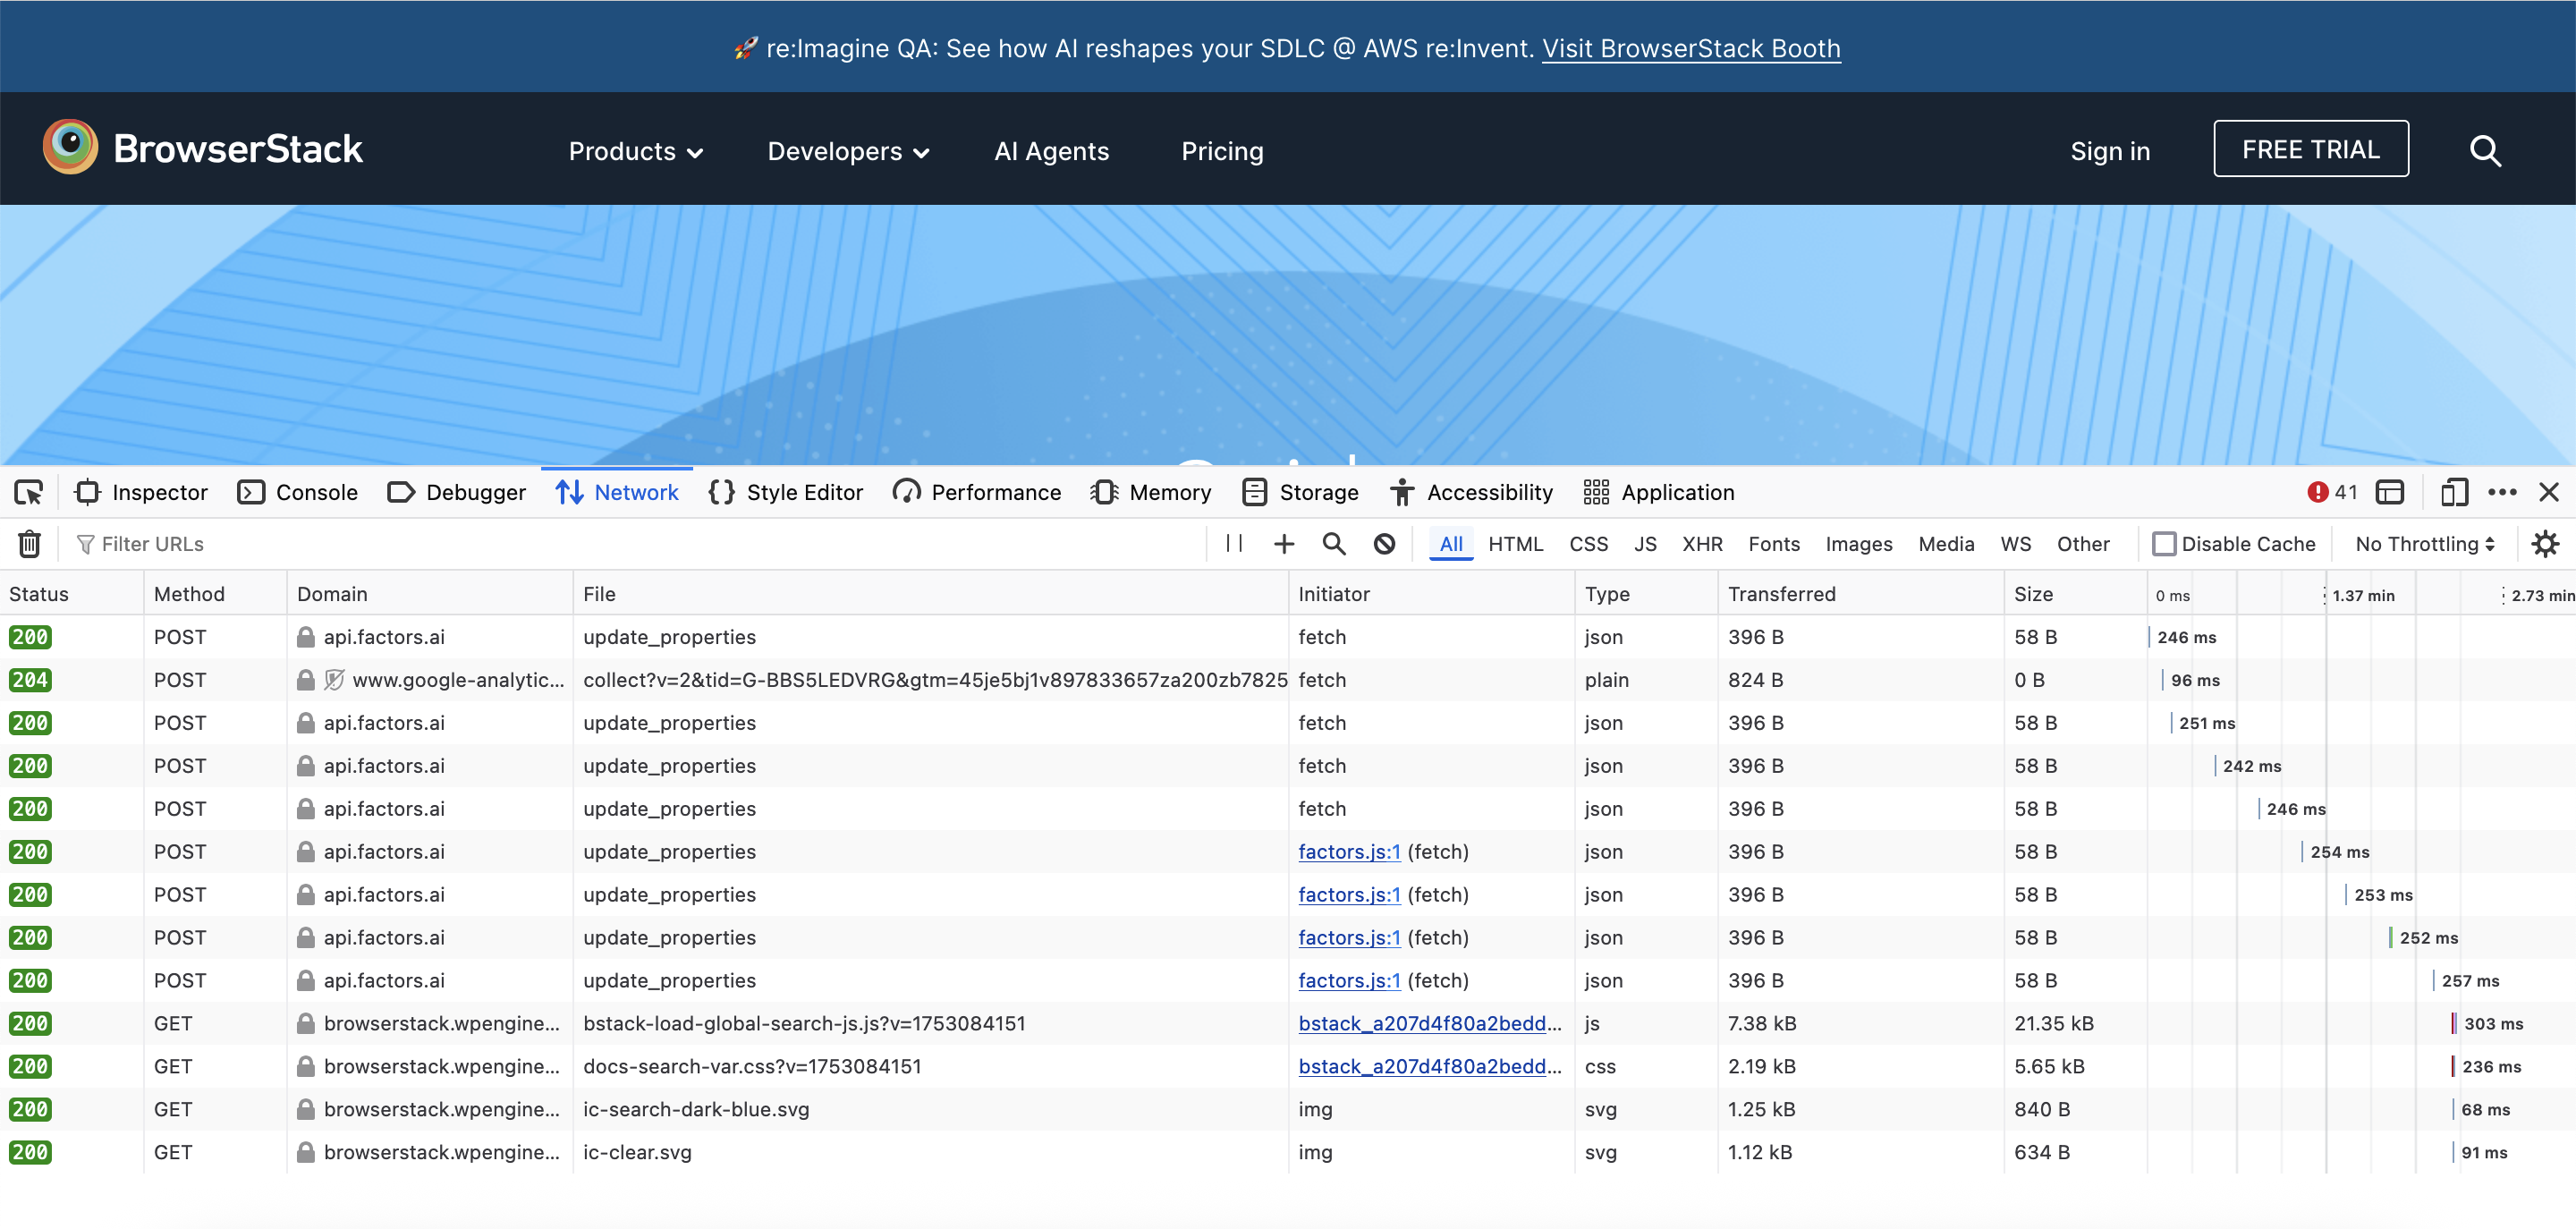
Step 7: Monitor Network Activity
Use the Network tab to track and debug API calls, image loading, and script performance.
Step 8: Check Performance and Accessibility
The Performance tab shows frame rate and layout calculations. The Accessibility tab displays ARIA labels and element roles for testing accessibility compliance.
Limitations of Inspect Elements on Mac
Inspect Element tools are incredibly useful, but it helps to understand where they might hit a wall. Here are some things to keep in mind:
- Changes aren’t permanent: Tweaking HTML, CSS, or JavaScript in the Inspector only affects the current session. Reload the page, and everything goes back to how it was. Think of it as a temporary sandbox for experimentation.
- Obfuscated or minified code: Some pages deliver code in a compressed or obfuscated format. You can see it in the Inspector, but understanding it or making meaningful edits can be tricky.
- No visibility into server-side logic: Inspect Element only works with client-side code. Anything running on the server like validations, database calls, or backend processes remains hidden.
- Data overload on complex pages: Heavy web apps generate tons of network requests and performance metrics. Without filters or additional tools, it’s easy to get lost in the data.
- Restricted access due to security: macOS and browsers may block certain system-level features or cross-origin content. Some hidden elements or resources simply aren’t accessible from the Inspector.
Why Inspect Element on Mac using Real Device Cloud?
Testing on a real device cloud like BrowserStack gives you distinct advantages. You can test on various Mac versions, Safari iterations, and other browser combinations to guarantee compatibility across different user environments. This reduces the risk of encountering unexpected issues after deployment.
Some very high-level distinctions are:
- Wider Configurations: BrowserStack enables testing on multiple Mac and Safari versions, ensuring cross-browser compatibility that is difficult to achieve with local machines.
- Real-time Debugging: With BrowserStack Live, you can inspect elements, capture screenshots, and record videos of bugs, streamlining the debugging process as you run tests.
- Consistency and Reliability: Unlike local setups that may vary due to software versions or hardware differences, BrowserStack provides a controlled environment for consistent results.
- Faster Testing: Run tests simultaneously on different Mac/Safari configurations, significantly speeding up the testing process compared to sequential local testing.
Troubleshooting Common Inspect Elements Issues on Mac
Even experienced testers sometimes run into quirks when inspecting elements on a Mac. Here are common issues and how to address them:
1. When Developer Tools Won’t Open on Certain Pages
Some web pages, especially those with strict Content Security Policies or embedded iframes, may block the Developer Tools from opening normally.
Solution: Open the tools from the top menu (Develop > Show Web Inspector in Safari) or use BrowserStack Live to inspect the page on a real device without restrictions.
2. When Dynamic Content Doesn’t Appear in the Inspector
Elements loaded via JavaScript frameworks like React or Angular might not show up immediately in the DOM panel.
Solution: Refresh the element in the Inspector, or use the Elements > Select Element tool to click on the dynamically rendered content. You can also use the console to query elements manually.
3. When Hover Highlights Don’t Match the Page
Sometimes hovering over nodes in the Inspector fails to highlight the corresponding elements. This can happen in pages with fixed headers, overlays, or shadow DOMs.
Solution: Dock the Developer Tools panel to the browser window instead of detaching it, or inspect via BrowserStack where overlays and complex layouts are handled consistently.
4. When Network or Performance Data Is Incomplete
On heavy web apps, not all network requests or performance metrics may appear if the tools are opened after page load or if caching interferes.
Solution: Open the Network or Performance tab before refreshing the page, or use BrowserStack Live to capture all requests across multiple browser versions reliably.
5. When Elements Are Hidden by macOS Security or Browser Restrictions
macOS or browser security features sometimes block access to certain elements, especially in sandboxed iframes or secure frames.
Solution: Use BrowserStack Live to inspect elements in a fully controlled real device environment where these restrictions are bypassed safely for testing purposes.
6. When You Repeatedly Encounter Console Errors
Sometimes the Inspector floods the console with recurring errors, and it becomes difficult to debug what you actually opened the tools for. This usually happens when background scripts keep failing, third-party trackers trigger blocked requests, or a framework logs continuous state updates.
Solution: Filter the browser console to Errors only, or silence noisy logs by disabling Verbose and Info levels. If the errors originate from browser-specific behaviour, reproduce the issue using BrowserStack so you can verify whether the same script fails across different browser versions.
Best Practices to Inspect Elements on Mac
Use these best practices to elevate the way Inspect Element supports debugging, analysis, and decision-making.
1. Reverse-engineer practical UI patterns
Inspect Element lets you study real-world implementations that already solve the problems you are dealing with. This includes analyzing how stable layouts are structured, how utility classes are grouped, how spacing is managed, and how responsive blocks adapt at various sizes.
Reviewing high-quality sites shows you how consistent naming, modular CSS, and predictable grid systems work in practice, so your tests start from proven patterns instead of guesswork.
Also Read: What are CSS Modules and why use them?
2. Validate responsive behavior at each breakpoint
Resizing the window is never enough. Use Safari Responsive Design Mode, Chrome Device Toolbar, or Firefox’s Responsive Design View to inspect how individual elements behave under different widths.
Look at the CSS rules that activate at exact breakpoints, check for layout jumps, confirm which properties get overridden, and inspect how flex or grid containers reflow when space becomes constrained.
3. Track dynamic elements instead of static DOM
Modern UIs rarely stay still. Use event listeners, Mutation Observers in the Elements panel, and the “Break on subtree modifications” options to catch changes triggered by JavaScript. This helps you understand why elements shift after load, why stateful components replace DOM nodes, and why styles suddenly change even when the CSS appears correct.
4. Simulate network and performance constraints
Real issues surface when the system is stressed. Inspect elements while throttling network speed, forcing CPU slowdown, or delaying script execution.
This is where you see images loading late, CSS failing to apply on time, components rendering out of order, or layout shifts caused by unpredictable API responses. These conditions replicate what users actually face outside local machines.
5. Cross-verify rendering differences across browsers
Safari, Chrome, and Firefox each process layout calculations, flex rules, z-index stacking, and accessibility tree generation differently because they have different rendering engines.
Keeping the same element open in multiple Inspectors helps you catch inconsistencies like mismatched computed styles, different default CSS values, missing ARIA relationships, or unsupported CSS properties that Mac browsers handle unevenly.
6. Audit accessibility semantics directly in the Inspector
Use the Accessibility tree, role checker, color contrast tools, and rendered name computation panels available in each browser. Inspecting ARIA roles, tab order, name–role–value mappings, and contrast failures directly in the DOM closes the gap between pure visual inspection and compliance-oriented testing.
7. Use breakpoints to debug layout and script-driven shifts
Relying on visual checks slows down root-cause discovery. Set breakpoints on attribute changes, node removals, or script execution paths. This reveals which line of code triggers reflows, animations, or unexpected style overrides, especially in complex component-driven UIs.
8. Capture reproducible debugging context
Use DevTools to capture screenshots with rulers, record performance timelines, and export HAR files. These artifacts make debugging collaborative, especially when the issue reproduces only on specific macOS/browser combinations.
Conclusion
Inspect Element on Mac is one of the fastest ways to understand how a page is structured, debug layout issues, validate styles, and review how elements behave across breakpoints and states. It gives testers and developers a direct way to trace problems visually and fix them with clarity.
Using BrowserStack strengthens this workflow by letting you inspect elements on real macOS and browser versions without maintaining devices. It helps you debug in accurate environments, verify UI behavior across Safari and Chrome variations, and avoid issues that only appear on specific setups.
About the Author: Rohit Rajpal is a seasoned QA strategist with deep expertise in web inspection, debugging workflows, and modern testing practices. At BrowserStack, he focuses on translating advanced testing methodologies, inspection techniques, and tooling insights into practical, engineering-ready guidance for QA teams.

