All-in-one test reporting, debugging & analytics
Real-time test reporting. AI-driven test failure analysis. Flake detection. Test automation metrics tracking.
Analyze failures 95% faster and improve automation stability.

Trusted by more than 50,000 customers globally
Why choose Test Observability?
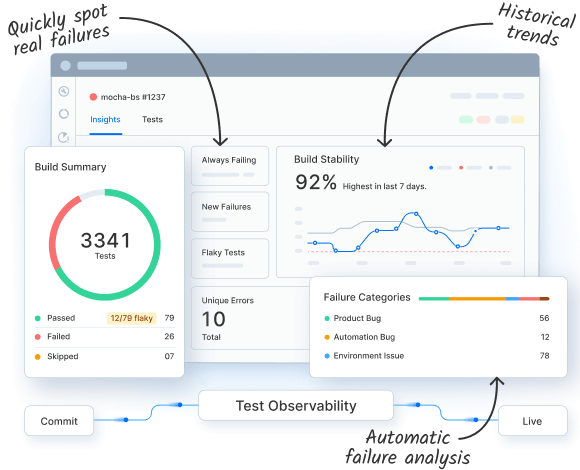
Test Observability provides visibility into every test execution in your CI pipelines, utilizes AI to remediate failed tests & enables proactive improvement of test-suite reliability.
Smart test reporting & build insights in real-time
- Track all automated tests in one place – UI, API, or unit tests
- Detect ‘flaky, always-failing tests & new failures’
- Visualize test failures by test modules or folders


Debug failed tests faster with AI
- Failure reason categorization with AI-based tagging
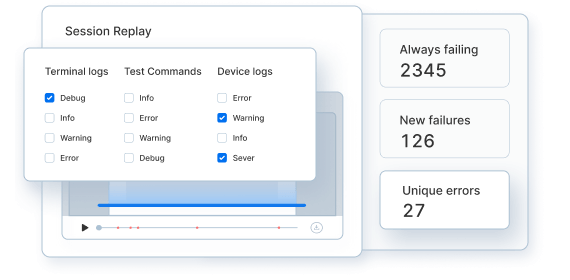
- Identify the unique errors that lead to most test failures
- Timeline debugging with test logs & past test history in a single pane
Improve automation stability with analytics
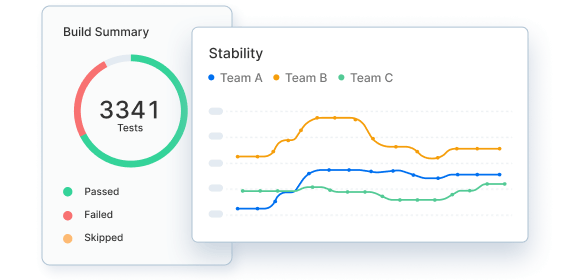
- Monitor test health & build trends across projects
- Build custom dashboards to track key automation metrics
- Create custom alerts to identify & fix issues proactively

Key Features
Supports any test automation
Analyze tests run on BrowserStack grid or CI runner hosts or anywhere else – be it Unit, API, Integration, or UI tests.
Flaky and new-failure auto-detection
Auto-identify flaky, new failure, always failing & performance anomalies with custom rules.
Timeline & Time-travel Debugging
A timeline view of all the test run logs chronologically sorted. Click on any past run to access its timeline logs.
Uncover common cause failures
No need to debug all failed tests anymore. Debug only the unique causes of failures. Save time spent on debugging.
Re-run tests directly on CI
Trigger a rerun of selected tests directly on your CI from the Test Observability dashboard.
Custom dashboards
Make better decisions with historical data on what tests are failing, flaky, or slow. Use default dashboards, or create your own.
Who is Test Observability for?
Quality Engineers
Debug test results faster and better with the right tools. Collaborate better with developers to improve quality.
Engineering Leaders
View rich, historical data on testing trends in your organization. Leverage insights to ship higher-quality products to market faster.
Developers
Reproduce bugs faster, and improve the quality and performance of unit or integration tests.
Enterprise-class features
Priority support
Senior support engineers, response time SLAs and on-call support.
Single sign-on
Leverage SSO to easily integrate your teams into BrowserStack.
Access Control
Create sub-teams, customize dashboard views and more based on their testing needs.
Over 50,000 companies trust Browserstack
Get started for free!
FAQs
No. Unlike application Observability tools that help you identify, monitor and debug application bugs, Test Observability helps identify, monitor and debug your test cases and test suite health.
Test Observability is designed for quality engineering teams – from quality engineers, to quality managers and leaders.
Test Observability will replace 3 tools in your DevOps stack—
- The tool that you use for Test Reporting like Cucumber reports
- The tool(s) that you use for Test Debugging like CI console logs & artifacts like screenshots, network logs, video etc; and
- The tool that you use for Test Suite Health Monitoring like Spreadsheets.
It’s a 3-in-1 tool.
All types of automated tests are supported – Be it unit, API, integration, functional or any other test.
Yes. Test Observability is platform agnostic – it works irrespective of whether you run tests on BrowserStack, local, or anywhere else.
No. You can use our online Sandbox to play around with all the features. No setup, integration or sign-up needed.
Test Observability works by instrumenting your tests through BrowserStack SDK for your test framework. All test-related details, logs, screenshots, CI information, Git information, etc are sent over to the Test Observability backend automatically while your tests are running. It all works magically without needing any setup time whatsoever.
Less than a few minutes flat. You need to follow only the 2-3 steps in the getting started documentation, and then BrowserStack SDK starts collecting all your test data automatically.
We support native SDKs for a lot of automation frameworks. You can find the complete list here. You can also use Test Observability even if your automation framework isn’t supported by uploading JUnit XML reports to our API endpoint.
