Protocol load testing using JMeter
Run a protocol load test on BrowserStack Load Testing
Prerequisites
- BrowserStack Username and Access key. You can find these under your account profile.
- An existing JMeter script.
Supported versions
BrowserStack runs your JMeter load tests on the following engine version:
| Tool | Recommended version |
|---|---|
| JMeter | 5.6.3 |
Run a test
Based on your preferred method of performing load tests, use one of the following methods:
You can start a new test either from the Quick Start page or the Load Tests page on the Load testing dashboard.
On the dashboard, click Create Load Test.

Enter a Test Name for your load test, select API Only, and click Upload scripts
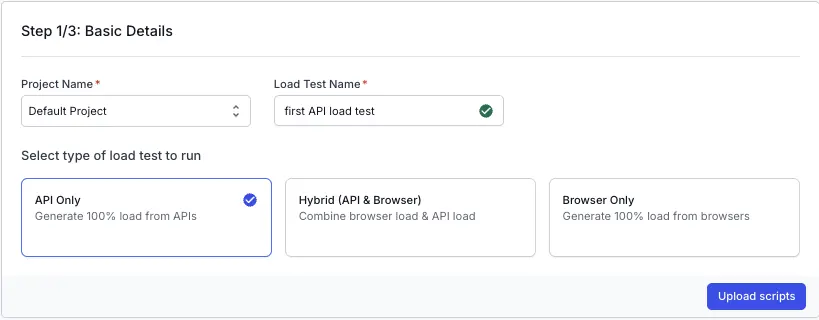
Upload scripts
Upload your JMeter script.
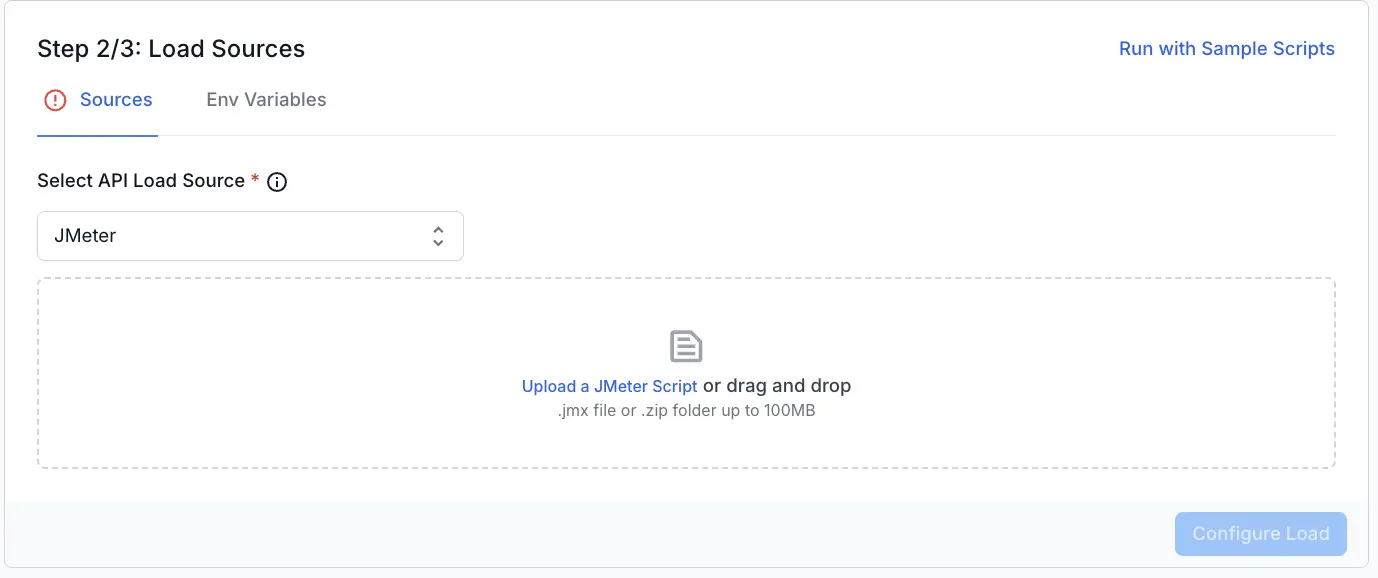
Once you have verified the configuration, click Configure Load to move to the next step.
You can also run load tests using the sample scripts if you want to try out the feature before uploading your own files.
Use multi-file JMeter scripts from the UI
You can upload a modular JMeter test suite that uses multiple .jmx files and dependencies.
Upload scripts
- In the Script section of your load test configuration, choose one of the following:
- Upload a single
.jmxfile. - Alternatively, you can also upload a
.zipfile that contains your main JMeter script and any additional supporting files.
- Upload a single
- When you upload a
.zipfile:- Enter the main script path in the Main script field, relative to the root of the ZIP (for example,
tests/main.jmx). The platform uses this as the JMeter entry point.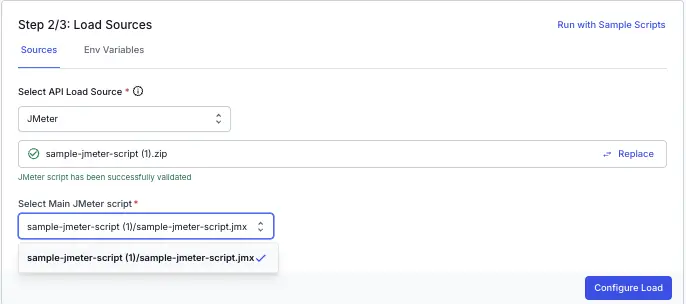
- Keep your folder hierarchy inside the ZIP. Relative imports such as
import { helper } from './utils/helper.jmx'continue to work because the directory structure is preserved during execution.
- Enter the main script path in the Main script field, relative to the root of the ZIP (for example,
Validation rules
- If you upload a ZIP file and leave the Main script field empty, the test configuration shows an error and you cannot start the run until you specify an entry file.
- If the main script you specify does not exist inside the ZIP file, the test configuration shows an error that the entry file cannot be found in the uploaded archive.
- The maximum supported ZIP size is 100 MB. If the archive exceeds this limit, the upload is rejected with a clear error message.
Use these checks to confirm the correct entry path before you run the test, so that all imports resolve successfully at runtime.
Use your JMX script’s load config
On the Load Definition tab, turn on Use JMX script config to run your JMeter script exactly as authored. When it’s on, BrowserStack uses the VUs, duration, and ramp-up parsed from your JMX thread groups, and the Load Profile fields are hidden. The toggle label shows the detected configuration, for example 1 VUs & 0m 1s (Standard Thread Group). Turn it off to customize the load values in BrowserStack instead.
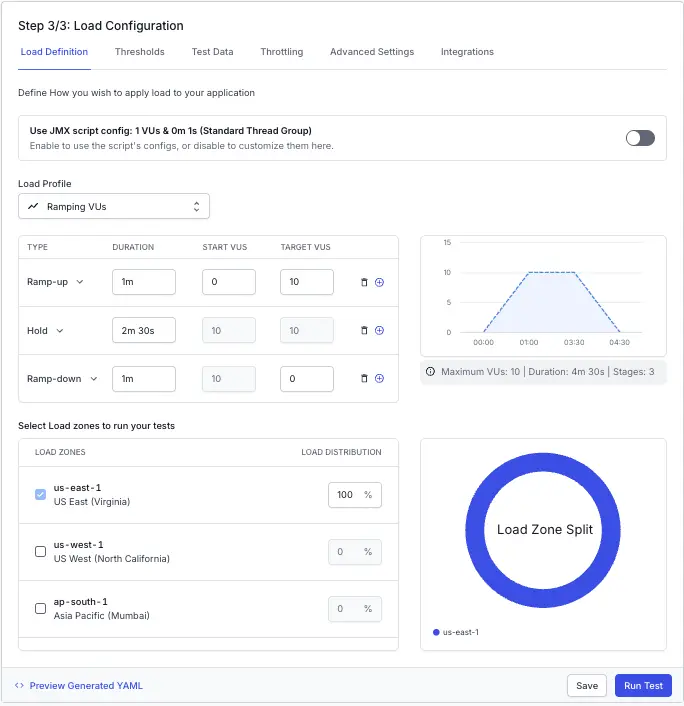
The toggle appears only when BrowserStack can parse your script’s thread groups. If you don’t see it, your script may use thread groups that can’t be parsed.
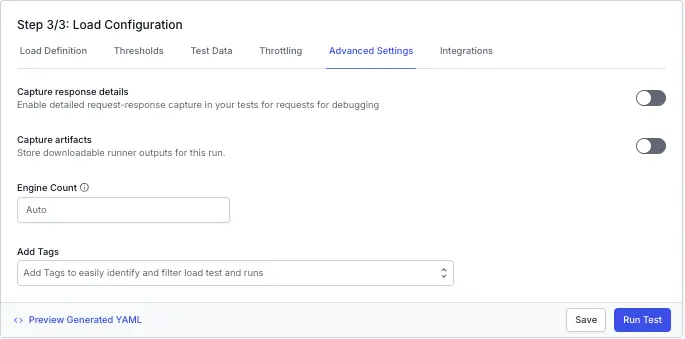
Set the engine count
On the Advanced Settings tab, set Engine Count to run your test across multiple parallel JMeter engines. VUs are split across the engines, and each engine handles up to 1,000 VUs. Enter a value from 1 to 10, or leave it as Auto to let BrowserStack choose based on your VU count. The engine count must be at least the number of regions, and shouldn’t exceed your VU count.
To drive a steady target request rate instead of a fixed number of VUs, select the Throughput load profile on the Load Definition tab. Throughput is available for JMeter and Gatling tests.
You can configure the following load parameters to customize your load test:
Run test
After you finish configuring load parameters, click RUN TEST .
Download the BrowserStack Load Testing CLI
Download the CLI based on your operating system:
Generate the YAML file
Run the given command to generate the browserstack-load.yml file which contains the configuration required to define and run your load test:
Configure your Load Test
Open the generated browserstack-load.yml file and update it with the relevant test details. Here’s a sample configuration:
Specify number of virtual users
Set vus to the maximum number of virtual users to simulate during the test. The limit is 1,000 VUs per engine. To run more, use multiple engines (see Set the engine count), which scales the total beyond 1,000. Contact us to discuss higher limits.
If you set jmxConfigSource: script, skip this field. BrowserStack reads the VU count from your JMX thread groups instead. See Use your JMX script’s load config.
Specify the test scripts
The files block defines the key files needed to identify which tests to execute.
-
testScripts: Set the path to the.jmxfile.
Use multi-file JMeter scripts with the CLI
You can run multi-file JMeter tests from the CLI by configuring your test directory and entry script in browserstack-load.yml.
Update the files block
Add testDir and testScripts under the files section of your configuration.
-
testDir: Absolute path to the directory that contains all your JMeter scripts and helper files. The directory is zipped and uploaded as-is, so your folder structure is preserved. -
testScripts: Absolute path to the main JMeter entry script, relative totestDir.
Behavior and constraints
- The CLI validates that the entry script defined in
testScriptsexists insidetestDir. If it is missing, the run fails fast with an error. - All files and folders inside
testDirare included in the upload. Relative imports between files work as long as the referenced files live under this directory. - If your test imports a file that is not present under
testDir, the test run fails when JMeter executes those imports. - Very large directories increase upload time. Keep the contents of
testDirlimited to only the scripts and dependencies required for the test run.
Set reporting structure
- Use
projectNameto group related tests under the same project on the dashboard. UsetestNameto group multiple runs of the same test. - Both
projectNameandtestNamemust remain consistent across different runs of the same test. - You can use the following characters in
projectNameandtestName:- Letters (A–Z, a–z)
- Digits (0–9)
- Periods (.), colons (:), hyphens (-), square brackets ([]), forward slashes (/), at signs (@), ampersands (&), single quotes (‘), and underscores (_)
- All other characters are ignored.
Use your JMX script’s load config
By default, the vus, duration, and load profile in browserstack-load.yml override your JMX file. To run the script exactly as authored, add jmxConfigSource: script:
jmxConfigSource: script
When jmxConfigSource: script is set:
-
vus,duration, andloadProfileare ignored. BrowserStack reads the VU count, duration, and ramp-up from your JMX thread groups, so define your load inside the script. -
engineCountandregionsstill apply. Set them inbrowserstack-load.ymlas usual.
Omit jmxConfigSource, or set it to user, to keep using the YAML load values.
Set the engine count
engineCount controls how many parallel JMeter engines run your test. VUs are split across them, and each engine handles up to 1,000 VUs.
engineCount: 4
- Set a value from 1 to 10, or omit
engineCountto let BrowserStack choose automatically (ceil(VUs / 1000)). - The engine count must be greater than or equal to the number of regions, because each region needs at least one engine.
- Keep the engine count at or below your VU count. Extra engines receive no VUs and still consume capacity.
You can configure the following load parameters to customize your load test:
- Load profiles
- Load zones
- Set thresholds
- Environment variables
- Capture response details
- Network throttling
Run the Load Test
Run the given command to start your test:
Check out the FAQs section to get answers to commonly asked questions.
View test results
Once the test starts running, you’ll get a link to the test report. You can also view your test results in the Load Testing dashboard.
After the run starts, open the Engine Health tab to confirm your engines spawned and see the VU allocation per engine.
Script mode is supported only when you upload a single .jmx file. Uploading a .zip archive or multiple files turns off script mode.
Supported thread groups and limits
Supported thread groups in script mode:
- Standard, Ultimate, and Stepping thread groups are fully honored.
- Open Model thread groups are parsed on a best-effort basis.
- Concurrency and Arrivals thread groups (BlazeMeter plugins) aren’t supported, and turn off script mode.
- setUp and tearDown thread groups run once per engine and aren’t split.
- Parameterized thread counts, for example
${__P(threads,50)}, use their default value.
Limits:
- Engine count ranges from 1 to 10, and is available for API-only JMeter tests, not for hybrid, k6, Gatling, or Locust tests.
- Each engine handles up to 1,000 VUs. Auto mode uses
ceil(VUs / 1000)engines.
We're sorry to hear that. Please share your feedback so we can do better
Contact our Support team for immediate help while we work on improving our docs.
We're continuously improving our docs. We'd love to know what you liked
We're sorry to hear that. Please share your feedback so we can do better
Contact our Support team for immediate help while we work on improving our docs.
We're continuously improving our docs. We'd love to know what you liked
Thank you for your valuable feedback!