Debugging is a critical part of mobile test automation, ensuring faster releases and higher-quality apps. Appium, a popular open-source mobile UI automation tool, offers multiple debugging features that help QA teams quickly identify and resolve issues during test execution. This article explores how Appium debugging works and the techniques available for efficient error detection.
Overview
1. Why Debugging Matters in Appium Testing
- Pinpoints errors quickly for faster resolution.
- Identifies the exact cause of failures and reduces complications.
- Improves overall software quality through better validation.
2. Techniques for Debugging in Appium
- Video Recording & Device Logs: Captures execution flow for troubleshooting and reporting.
- Screenshots for Failed Tests: Provides instant snapshots of failures to identify problem areas.
- Live CLI/Console Logging: Streams real-time logs during test execution for faster analysis.
- Text Logs: Uses Python’s built-in logging module for structured, detailed error tracking.
3. Using BrowserStack for Appium Debugging
- Offers real device cloud for running Appium tests across Android and iOS.
- Provides advanced debugging tools: screenshots, network logs, crash logs, and execution videos.
- Simplifies collaboration by enabling teams to share logs and reports for faster fixes.
4. Benefits of Effective Debugging in Appium
- Reduces maintenance challenges as test suites scale.
- Minimizes false positives and improves test reliability.
- Ensures apps are tested in real-world conditions, improving user experience.
This article explains what Appium debugging is, its core techniques, how BrowserStack enhances debugging, and the benefits of adopting effective debugging practices.
What is Appium?
Appium is an open-source mobile UI testing framework available for free distribution. It faciliates automation tests on physical devices, emulators, and simulators, as well as native, hybrid, and web application testing. It provides cross-platform application testing, meaning that test scripts may use a single API for both the Android and iOS platforms.
Appium is not dependent on the mobile OS as it contains frameworks or wrappers that, depending on the device type and OS type, translate Selenium Webdriver commands into UIAutomation (iOS) or UIAutomator (Android) commands.
Languages that have Selenium client libraries, are all supported by Appium as well, such as Python Java, C#, Node.js, PHP, and Ruby.
Importance of Debugging
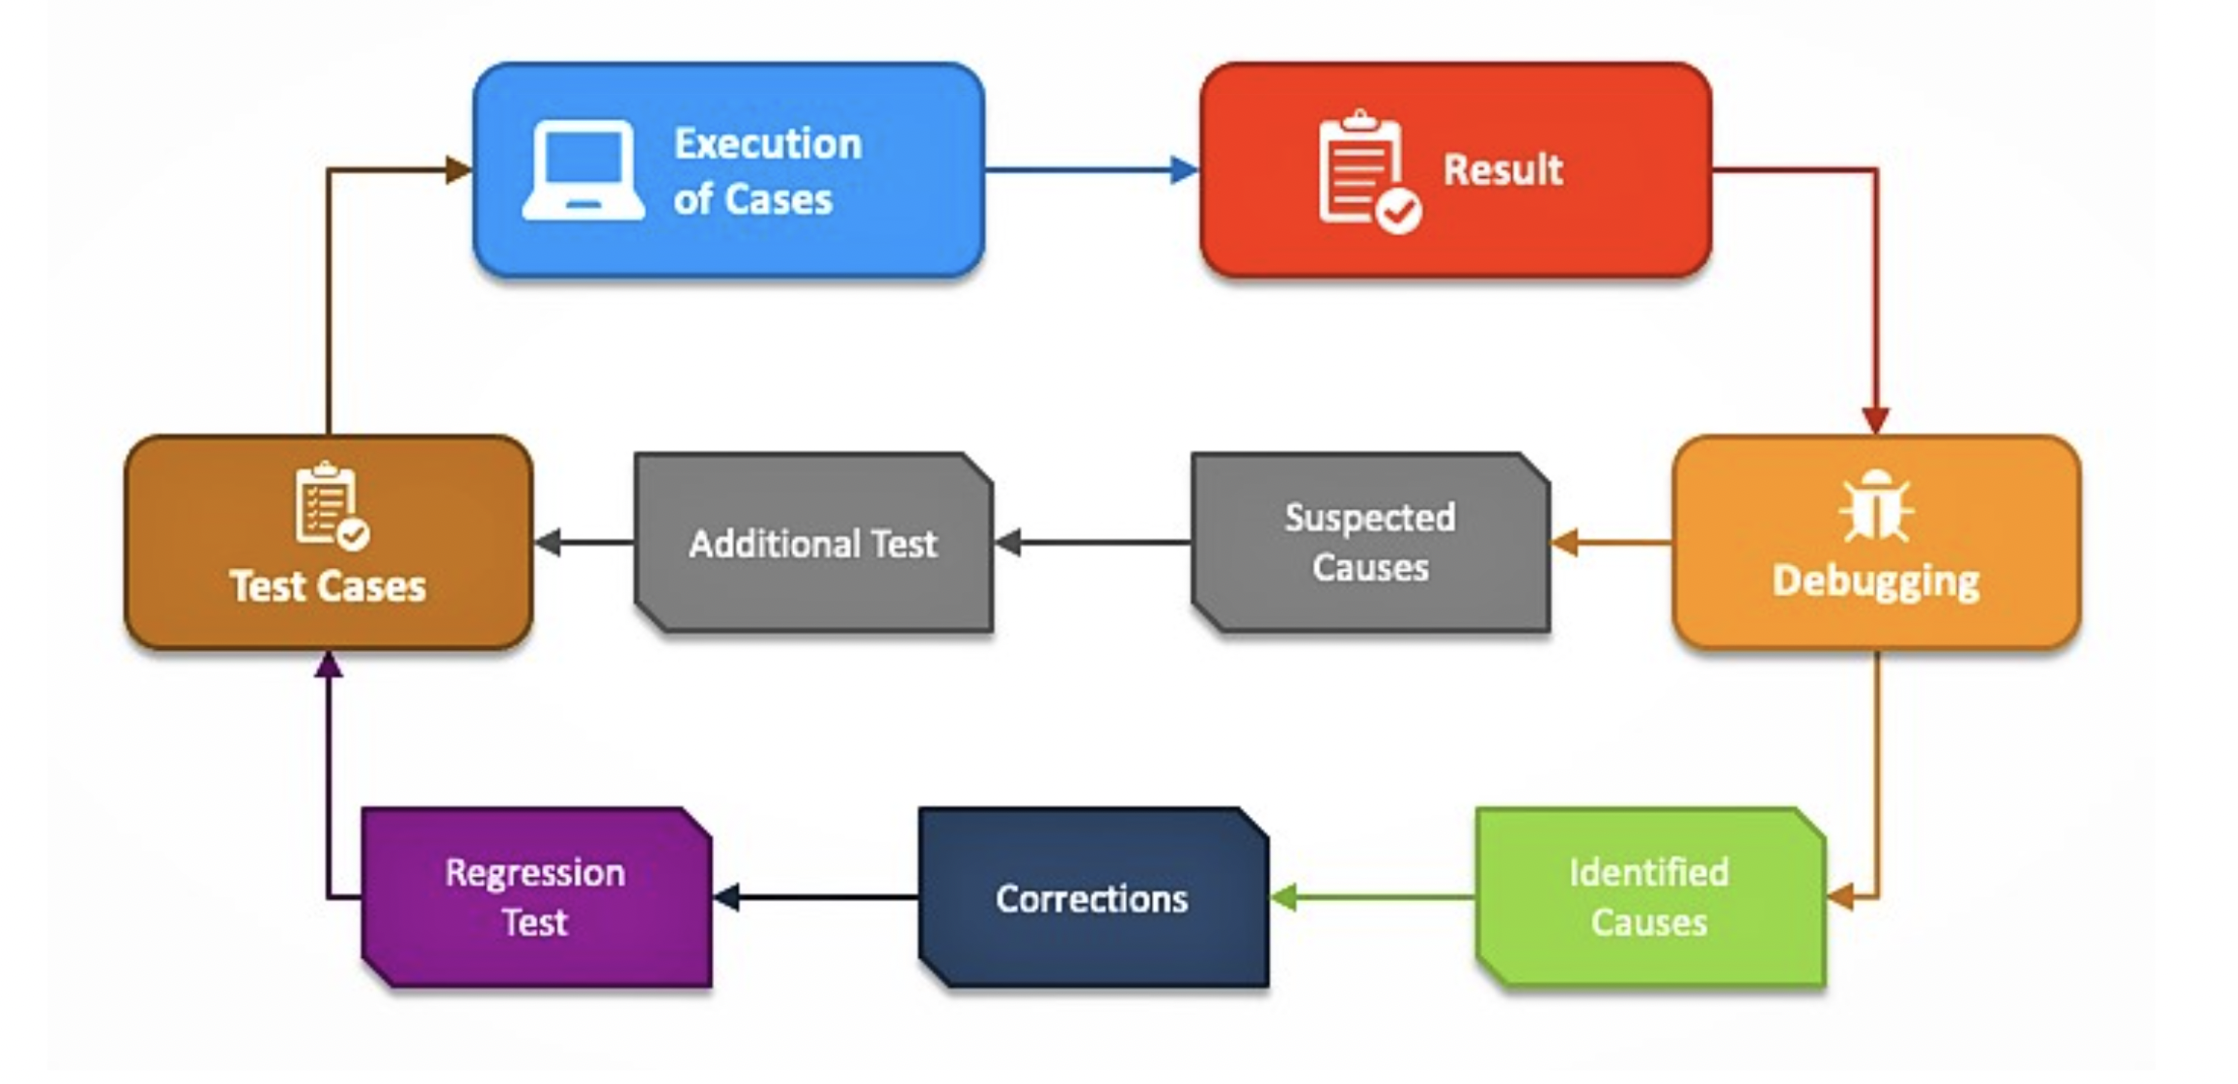
Finding the exact point where a programming error was made, is the process of debugging. The necessary changes to our code are then clear to us. It is crucial to the testing process since it:
- Aids in swiftly resolving the problems
- Determines the precise cause
- Removes complications
- Serves as evidence for evaluating and improving software’s quality
- Provide a method to check functionality by using dynamic values
The entire debugging process can be clearly comprehended below
Debugging in Appium
Debugging is one of Appium’s key features. It enables various techniques for debugging tests, including:
- Video Recording and Device logs
- Screenshot for Failed Tests
- Live Logging on CLI/Console Logs
- Text Logs
Let’s explore Appium debugging with BrowserStack Automate.
1. Video Recording and Device logs
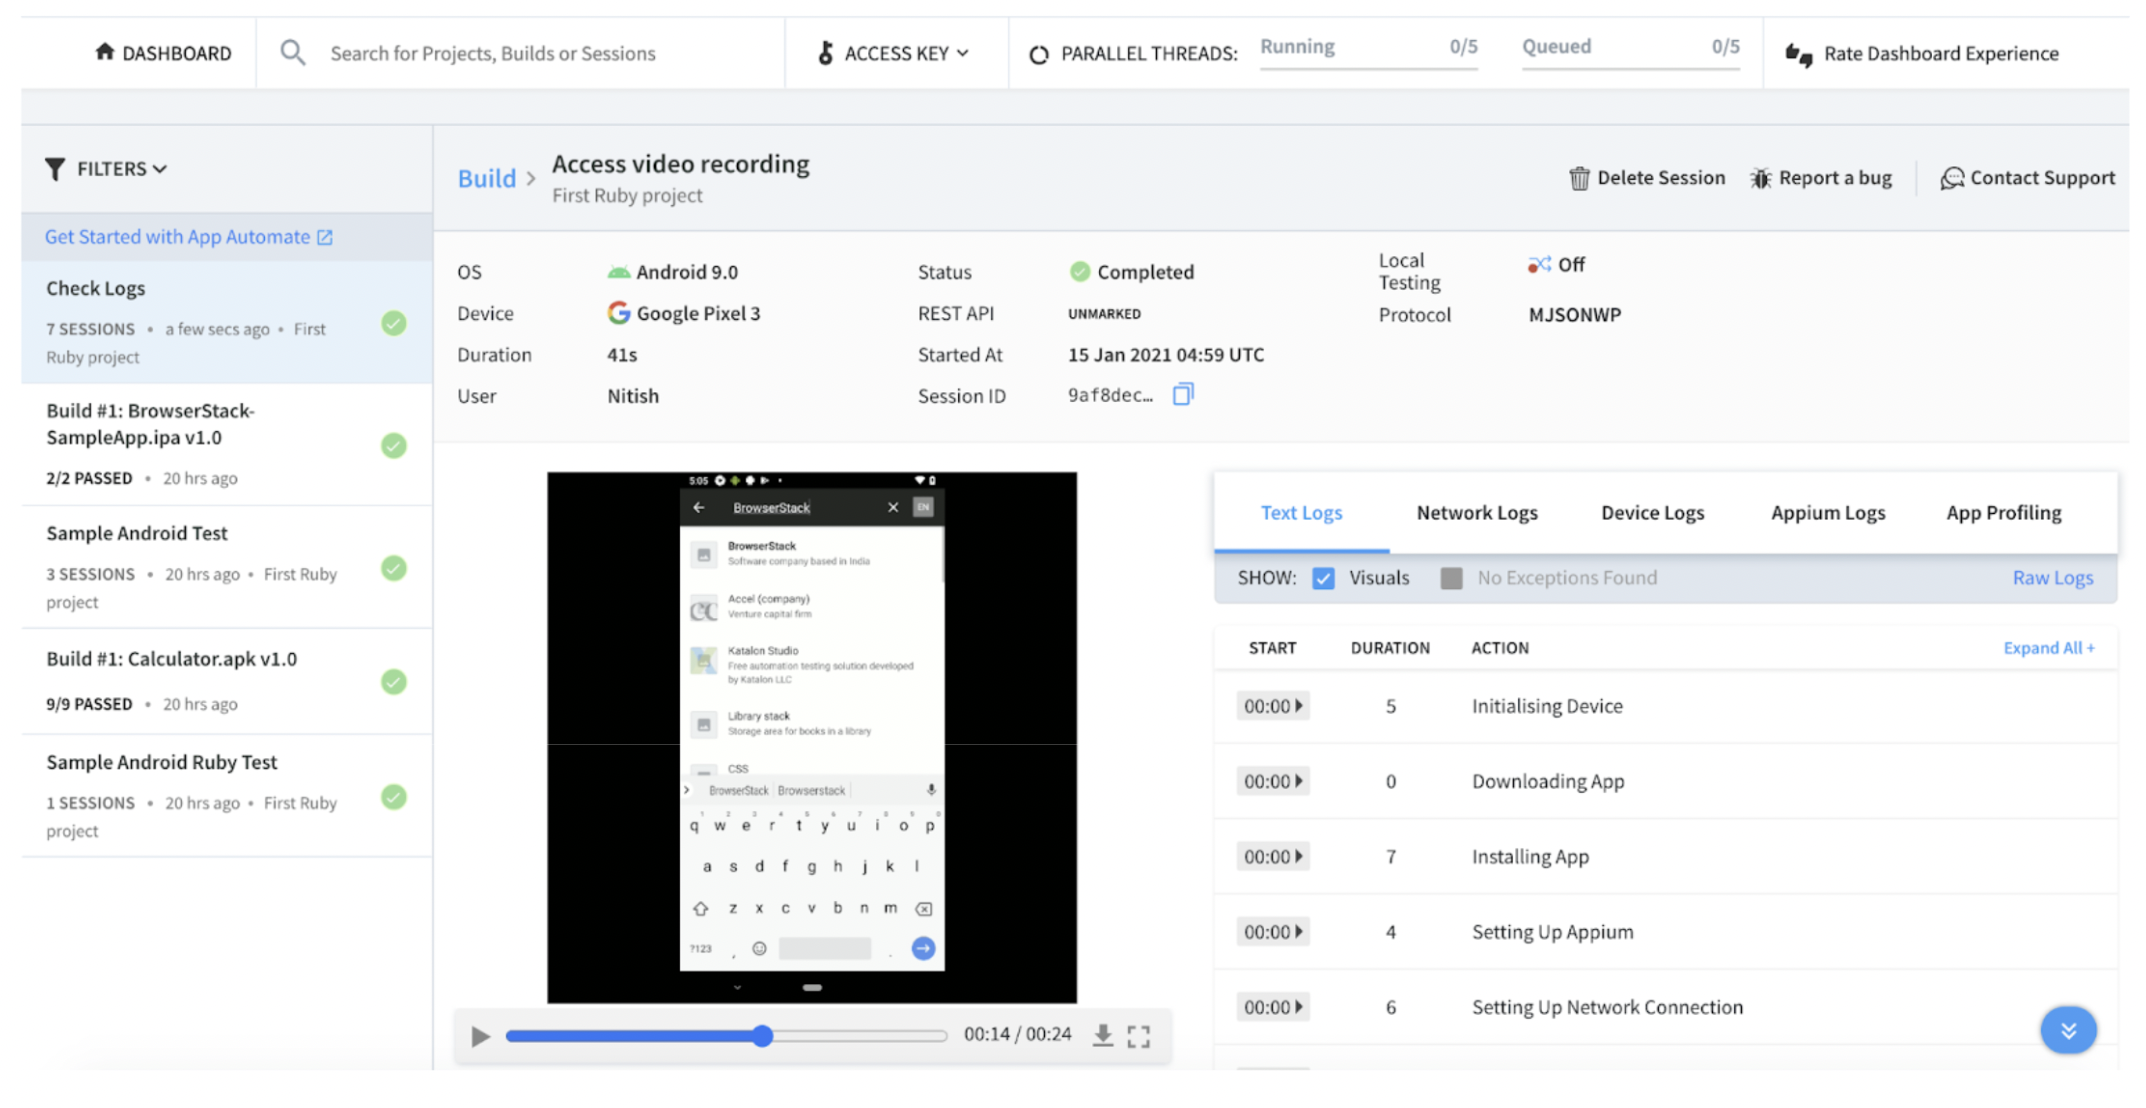
Mobile app test case execution captured on video can be quite important. Not only would these aid in more effectively troubleshooting problems, but we can also use recorded videos to demonstrate test execution procedures to internal stakeholders. Additionally, while creating bugs, these recorded videos can be added to the project management tool, which aids in properly comprehending the bug.
Video is enabled by default. We can disable or enable it using the browserstack.video capability
desired_cap = {

  'browserstack.video': 'true'

}
On App Automate Dashboard‘s test sessions details page, you may see the video recording.
2. Screenshot for Failed Tests
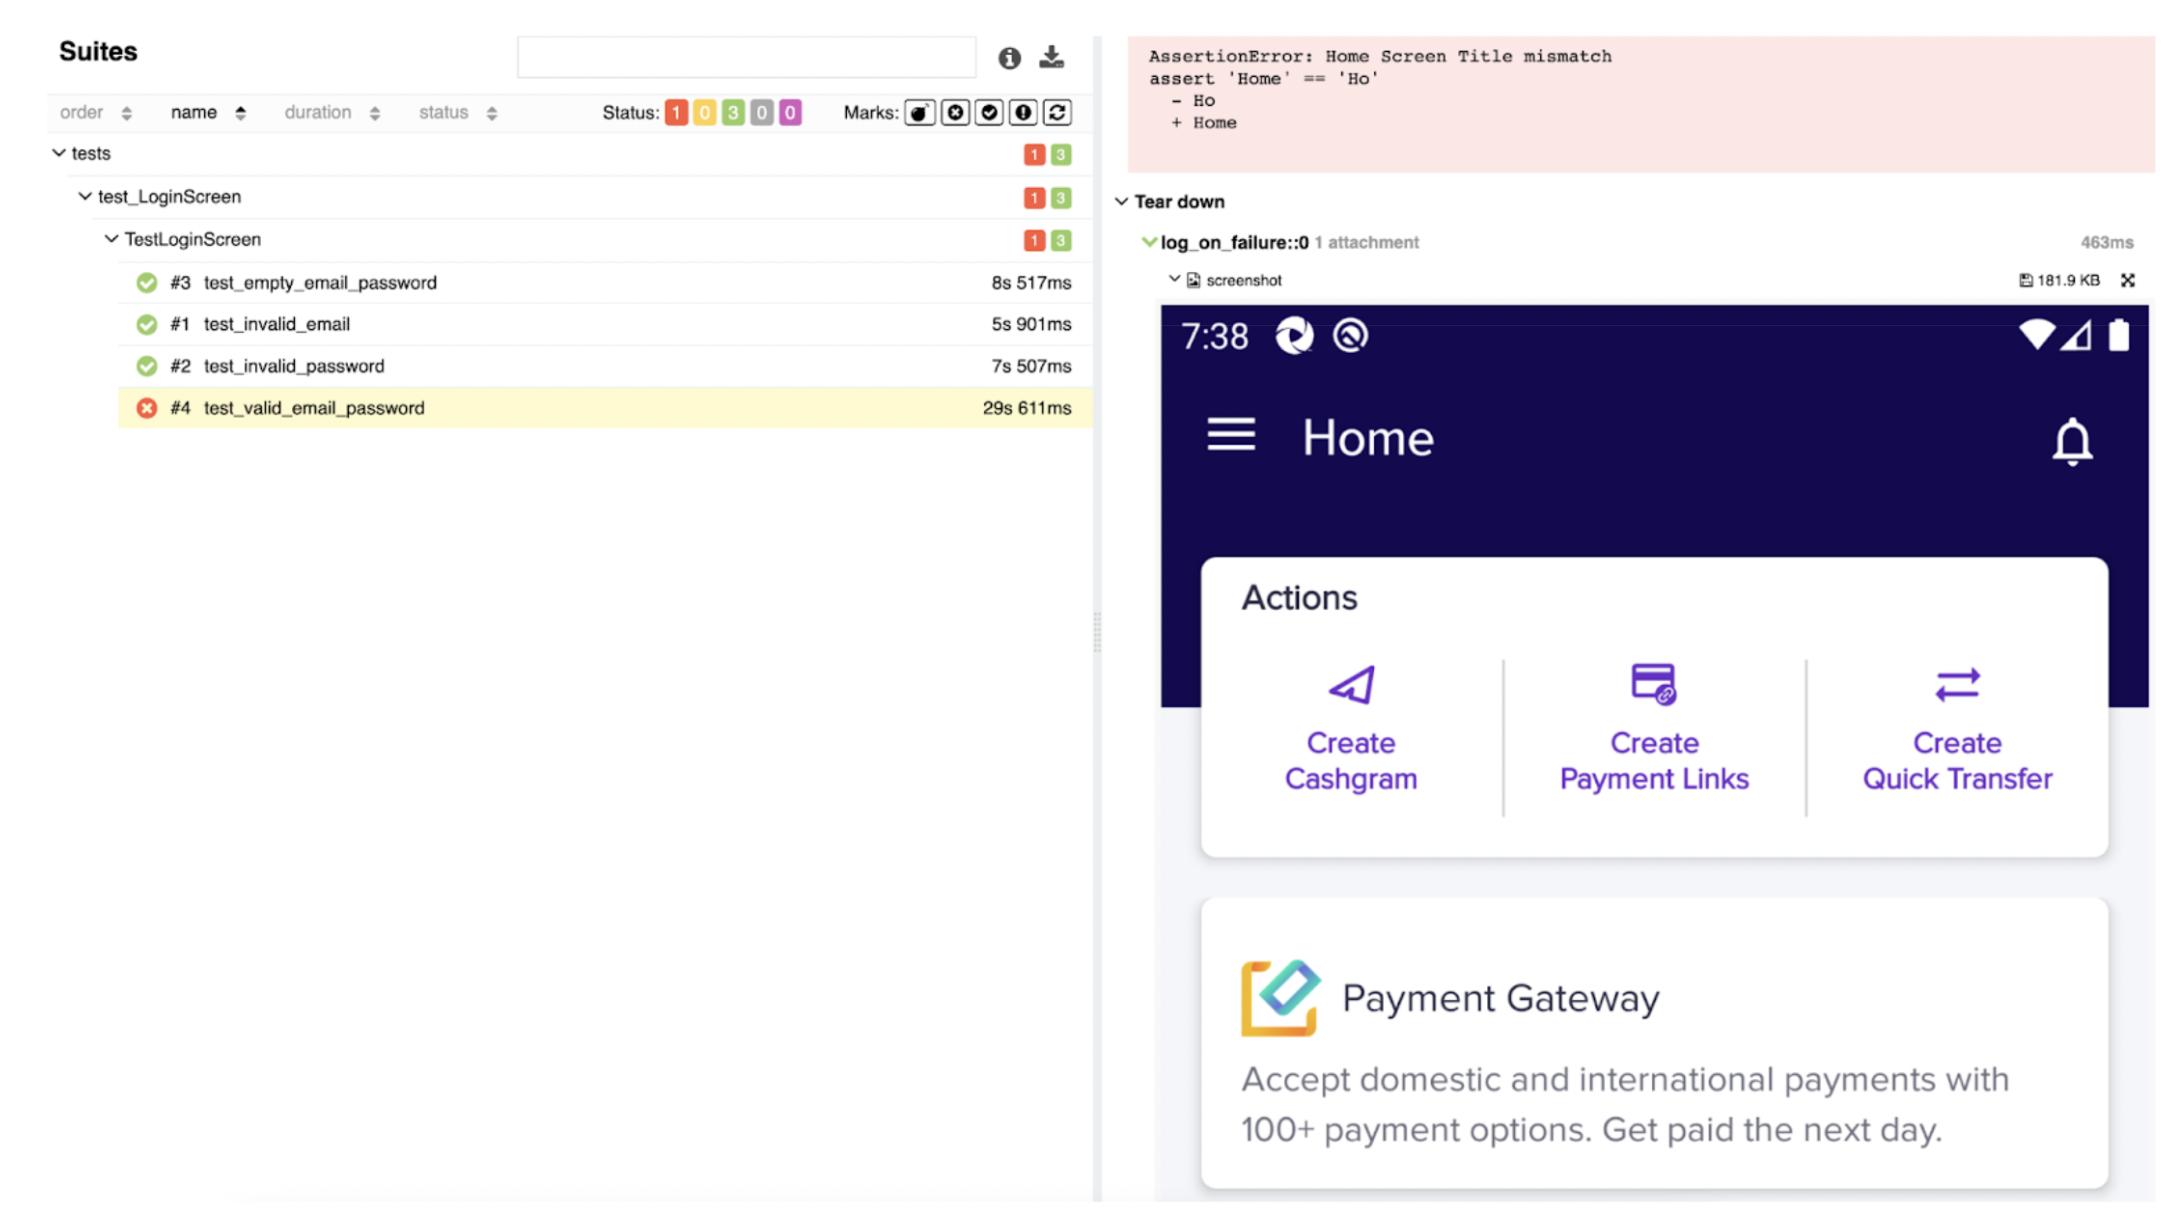
Using screenshots to debug your automated testing script is the simplest and quickest method. A screenshot of the smartphone screen at the exact instant the Appium test script failed, is meant to be taken. And subsequently, when troubleshooting, by looking at the screenshots, we may quickly pinpoint the spot and cause of our test case failure.
Pytest supports the setting up of hooks, in a file named conftest.py that can be put in the root folder where the tests are to be executed. This enables us to define Python code that will look for test files, execute them, and gather the test execution results.
@pytest.hookimpl(hookwrapper=True, tryfirst=True)

def pytest_runtest_makereport(item, call):

   outcome = yield

   rep = outcome.get_result()

   setattr(item, “rep_” + rep.when, rep)

   return rep
For failed tests, a screenshot can be appended using the command below to the allure report. This method will be called after the test run and if the test has failed.
    if item.rep_call.failed:

   allure.attach(driver.get_screenshot_as_png(), name=”screenshot”, attachment_type = AttachmentType.PNG)
3. Live Logging on CLI/Console Logs
In Pytest 3.5, log_cli configuration was added. Pytest will output logging records as they are emitted into the console, by setting the log_cli configuration option to true.
By providing log_level, the user can select the logging level for which log records of equal or higher level are printed to the console. Simply create a configuration INI file in the root directory and add the following CLI options to turn this on.
log_cli=true
log_level=INFO
4. Text Logs
A built-in logging module is available in Python and is a part of the language’s standard library. Therefore, nothing needs to be installed.
You can build a new logger by calling the method “logger.getLogger(__name__)” in order to emit a log message. The name of the module (or Python file) that is called the code will be stored in the __name__ variable.
As we’ve created a new logger, now by using the setLevel(level) method, we can set the logging at different log levels (DEBUG, INFO, ERROR, etc.)
import logging

logger = logging.getLogger(__name__)

logger.setLevel(logging.INFO)
Closing Notes
- As the product expands and the number of tests rises, maintaining the automation frameworks becomes challenging.
- We will see many false positives if we are slow to address automated problems (i.e., cases where the test fails because of a problem with the test script, not a problem with the application).
- The team will be able to reduce the amount of time spent on maintenance and debugging, thanks to the essentials for Appium debugging mentioned above.
Additionally, it is quite straightforward to inspect app elements and create automated tests using Appium Desktop with BrowserStack for mobile app testing. Additionally, it gives us a wide range of debugging tools, including text logs, network logs, visual logs, crash logs, and contextual log information.
BrowserStack App Automate enables you to test native and hybrid mobile applications using the Appium automation framework on thousands of real Android and iOS devices. Get onboard with the BrowserStack infrastructure to run Appium tests on a real device cloud so that the app becomes bug free.


