Data visualization in test automation is a powerful practice that helps developers and testers understand, analyze, and resolve issues.
By incorporating data visualization, you can use graphical representations, such as graphs, diagrams, charts, etc., to transform sophisticated data like logs, system performance, metrics, etc., into visual formats that make it easier to interpret and fix issues.
Overview
Importance of Data Visualization
Data visualization transforms complex test data into visual formats like charts and graphs. It enables testers to quickly identify patterns, trends, and anomalies for better decision-making.
Benefits of Data Visualization in Test Automation
- Provides clear insights into test results.
- Simplifies defect tracking and reporting.
- Improves communication among stakeholders.
Data Visualization Steps in Test Automation
- Identify the Data to Visualize
- Gather Data
- Select your Visualization Tools
- Organize Data
- Choose the Visualization Format
- Automate Visualization Process
- Share the Visualized Data
Learn more about data visualization, its benefits, and how your teams can use it to improve debugging in test automation.
What is Data Visualization
Data visualization refers to transforming raw data into graphical representations using visual aids such as graphs, diagrams, and charts.
In test automation debugging, data visualization helps identify patterns, trends, or anomalies that could be missed in large datasets via their visual representation.
Here are the areas in test automation where data visualization is applied:
- Log Analysis: Leverage the visual representations to identify recurring issues or unusual activity spikes.
- Performance Monitoring: Use heatmaps and timelines to display metrics like CPU usage, memory consumption, response times, etc., to identify performance bottlenecks.
- Error Tracking: Time-based error graphs can help correlate issues with specific deployments and error distribution charts can show where errors occur most commonly.
- System dependencies: Use dependency graphs to show the relations between different services or modules. This helps in debugging integration issues.
Science Behind The Importance of Data Visualization
Humans can process images in as little as 13 milliseconds, while it can take up to 150 milliseconds to process text. This difference is because our brains are wired to process visual information much faster than written information.
This difference in processing speed is significant and underlines the importance and benefits of data visualization in information processing. When presented with large amounts of data, it can be very difficult to process all of the information when presented in textual form. However, if that same data is presented in a visual format with proper tags and labeling, our brains can quickly and easily comprehend it.
With increased data generation, visualizations become critical.
Data visualizations allow us to take in large amounts of information quickly and easily, which is why it is such an important tool for information processing. It applies to all fields where data is generated and has to be analyzed. In the context of a tech startup, visualizations are a critical part of daily work and decision-making.
Need for Visualization Testing
As a startup grows, the number of automation test scripts they use to manage the quality of their product will increase. This can make it challenging to keep track of all the tests and their results. However, if the test suites and reports are visualized, it will be much easier to see which tests are passing and which are failing. This will help the startup identify and fix any issues with their product quickly.
Data visualization with visualization testing is a powerful tool that can help startups manage and debug their automation test scripts. By visualizing the test plan and reports, startups can quickly identify issues and take corrective action.
Steps to Visualize Data in Test Automation
Data visualization in test automation involves an organized process:
1. Identify the Data to Visualize
Decide what you want to visualize in test automation like test execution status (passed, failed, skipped tests), test coverage, test run trends over time, defect rates, and performance metrics.
2. Gather Data
Collect your data from test automation frameworks like Cypress or Selenium, CI/CD pipelines, issue tracking tools, code coverage tools etc.
3. Select your Visualization Tools
Choose a tool that will aid the data visualization requirements of your project. You should also make sure that it is easy to use, responsive, and has a robust set of features.
If you are looking for powerful test reporting tools, then BrowserStack’s Test Observability is the all-rounder tool you can opt for. It provides real-time test reporting, AI-driven test failure analysis, and test automation metric tracking along with robust data visualization options.
4. Organize Data
Organize the data for visualization. Get an aggregate of passed and failed tests, remove duplicates, and make sure the data is prepared in a structured manner.
5. Choose the Visualization Format
Choose a suitable visualization format based on the data at hand. For example, you could choose bar charts for analyzing test pass or fail counts, pie charts to study defect severity distribution, heatmaps to observe performance metrics or test coverage, and table for studying test results in detail.
6. Automate Visualization Process
Integrate the visualization into the CI/CD pipeline and generate reports after each test run automatically. For this purpose, you can use plugins for your CI/CD tools to support the visual reports.
7. Share the Visualized Data
Once the reports are generated, integrate them into your test management tool or project dashboards to share the status of your test and code quality with your team and stakeholders to collaborate and gather feedback.
Common Test Automation Debugging Challenges and Solutions
Automation test plans and results can be visualized using graphs, charts, and tables on dashboards and documents. Using dashboards is especially popular as they are dynamic applications suitable for collaboration across teams and roles. Some common issues faced by tech startups while debugging complex automation test failures are:
Common Challenges:
- Lack of Clear Error Messages
- Inconsistent Test Results
- Lack of Test Coverage
- Longer Test Runs
- Tests Not Covering All Scenarios
- Inconsistent Test Environments
- Unstable Dependencies
- Race Conditions
Here is a detailed explanation of the debugging challenges in test automation and their respective solutions.
1. Lack of Clear Error Messages
When an automation test fails, it is often difficult to understand why the failure occurred. If the code has improper error handling or there is no error message it can make it difficult to debug the failure and identify the root cause.
By visualizing the automation test results on a live dashboard, teams can monitor the execution of tests and see a list of all running and scheduled tests. Identifying the failing test by name can help locate relevant modules for fixing. System logs play a major role in debugging such scenarios.

2. Inconsistent Test Results
Another common issue with automation tests is that they often produce inconsistent results. This can be due to several factors, such as changes in the environment, code, or bugs in the test itself making it difficult to make decisions based on them.
Saving and then comparing test reports across time can help identify changing outcomes making it easier to see which tests are producing inconsistent results. Also, use an automation tool that can generate consistent test environments. This will ensure that the environment in which the tests are run is always the same, eliminating any inconsistencies in the results.
3. Lack of Test Coverage
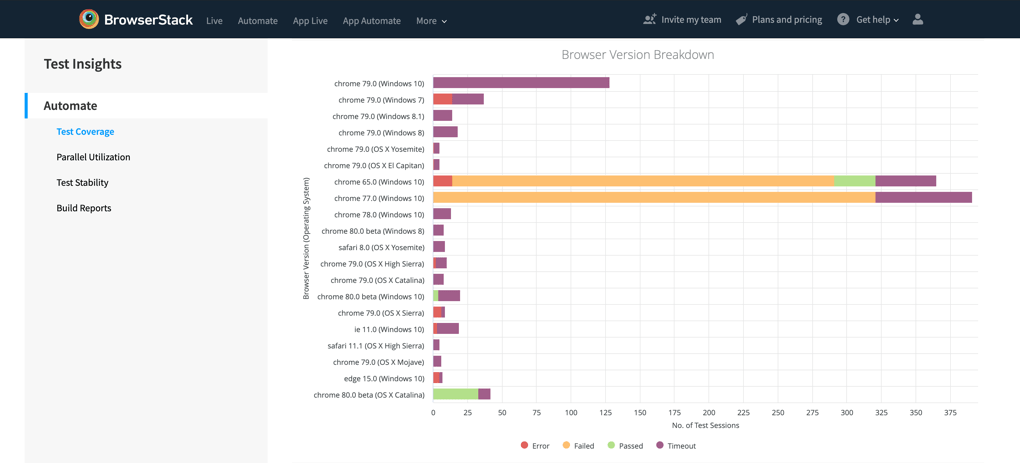
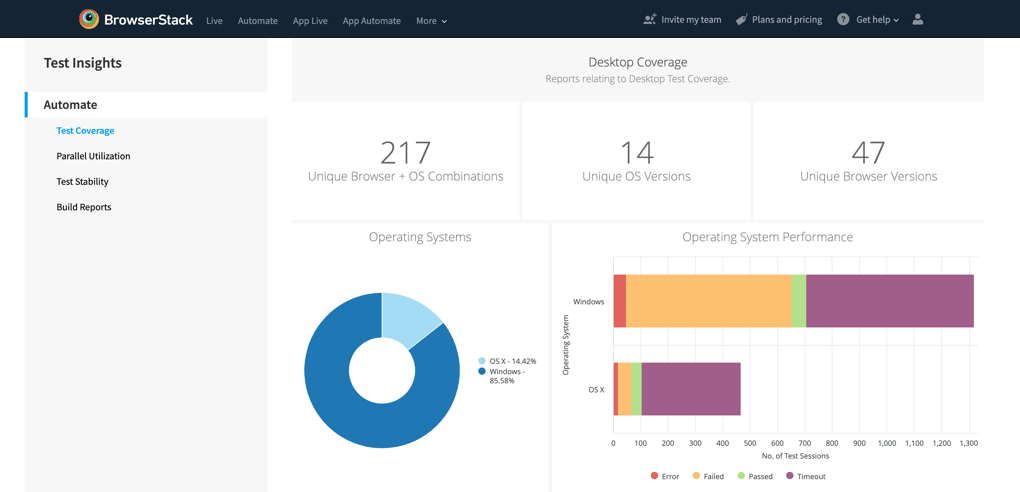
If a test plan does not have adequate test coverage, it may lead to missed critical bugs that could impact the product. By recording and visualizing the test coverage, we can quickly identify the areas that are not covered by tests. With BrowserStack Test Insights & Analytics, you can fill in the gaps. It captures the breadth and width of your test suite, giving you insights into the types of devices, desktops, and operating systems that you have been testing.
4. Longer Test Runs
Automation tests that take a long time can be very frustrating for those who have to wait for them to finish. Delays could be due to technical issues with the implementation, or the test suite could be very large with many dependencies resulting in slow execution. This can impact productivity and lead to frustration and resentment towards the testing process.
By scheduling test runs and reports, we can eliminate the need to trigger tests manually. Also, monitoring the time taken for each run can help track which part of the test takes more time than it should.
5. Tests Not Covering All Scenarios
Automation tests should visualize all possible scenarios that could occur during the use of the software being tested. However, this is often not the case, and the tests may miss some important scenarios. This can lead to critical errors being missed by the tests and cause serious problems for software users.
This is a tricky situation because if the scenario is not a part of the test plan, there is no way for the visualization to pick up the missing part. Hence, it is recommended to make sure all approved business requirements are properly documented and communicated to the developer and automation tester. Also, you can add a layer of white-box tests like an automated visual regression test as the final validation step before releasing a build version.
6. Inconsistent Test Environments
If the environment in which the automation tests are run is inconsistent, or the environment is not an accurate representation of the real-world use case, it can lead to false positives or false negatives. This can make it difficult to trust the tests’ results and make debugging more difficult.
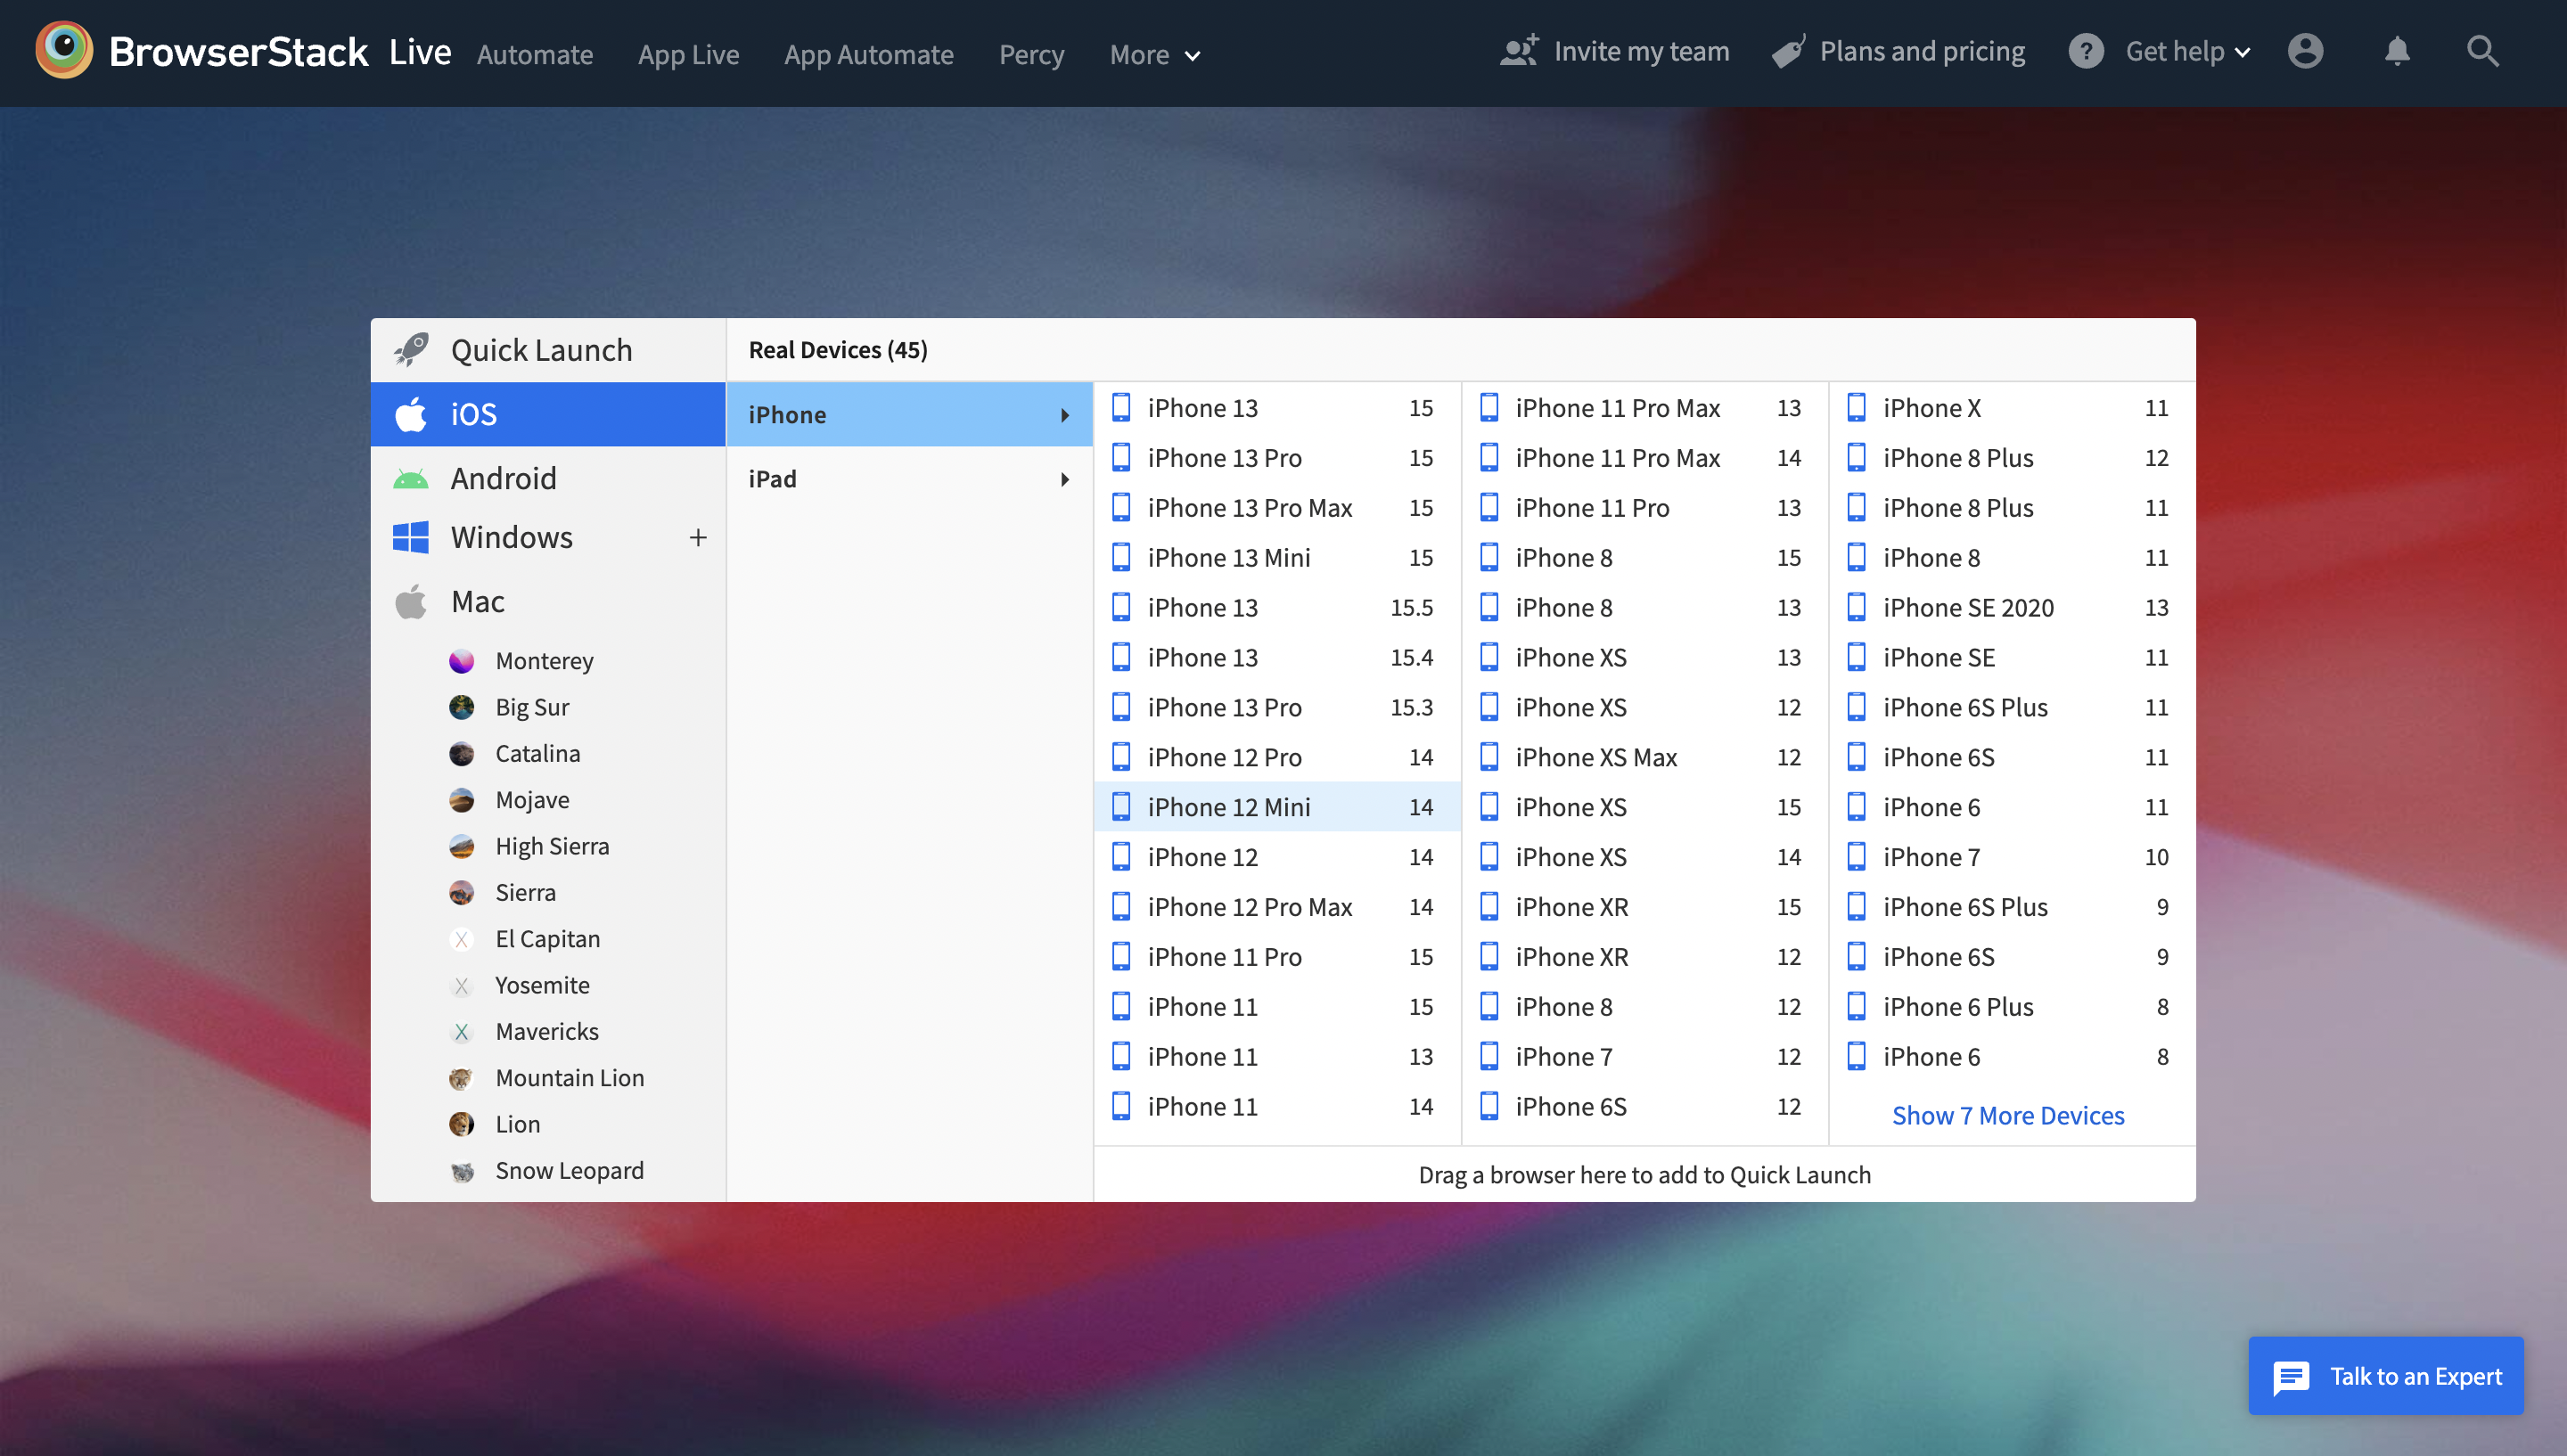
You can minimize the issues by using a tool that provides a high-quality and reliable execution environment. BrowserStack’s Real device cloud provides access to 3500+ real devices, OS, and browser combinations for accurate test environments.
7. Unstable Dependencies
Automation tests often rely on other software components, such as libraries or frameworks. If these dependencies are unstable, this can lead to test failures. It can also occur due to improper versioning in code or using deprecated or unsupported functionality in the app.
Maintaining the versioning of dependencies as part of project specification and documentation can help. Also, by capturing and visualizing the logs at various checkpoints in the CI/CD process, you can ensure that all dependencies are installed correctly and the build is completed with all necessary version requirements resolved.
8. Race Conditions
Race conditions can occur when two or more threads of execution access shared data, and one thread modifies the data before another thread can read it. This can lead to unpredictable results and makes debugging very difficult.
A dashboard with live updates and configurable warnings on resource consumption can help monitor and avoid deadlocks. Ideally, test runs should be scripted, keeping in mind the available computing capacity and memory.
Parallel Testing on BrowserStack gives you the same benefits as running a multi-threaded application and helps you reduce the run time of your test suite, resulting in faster build times and faster releases.
Data VisualizationTools for Test Automation Debugging
The following tools provide diverse visualization and debugging capabilities for enhancing test automation workflows.
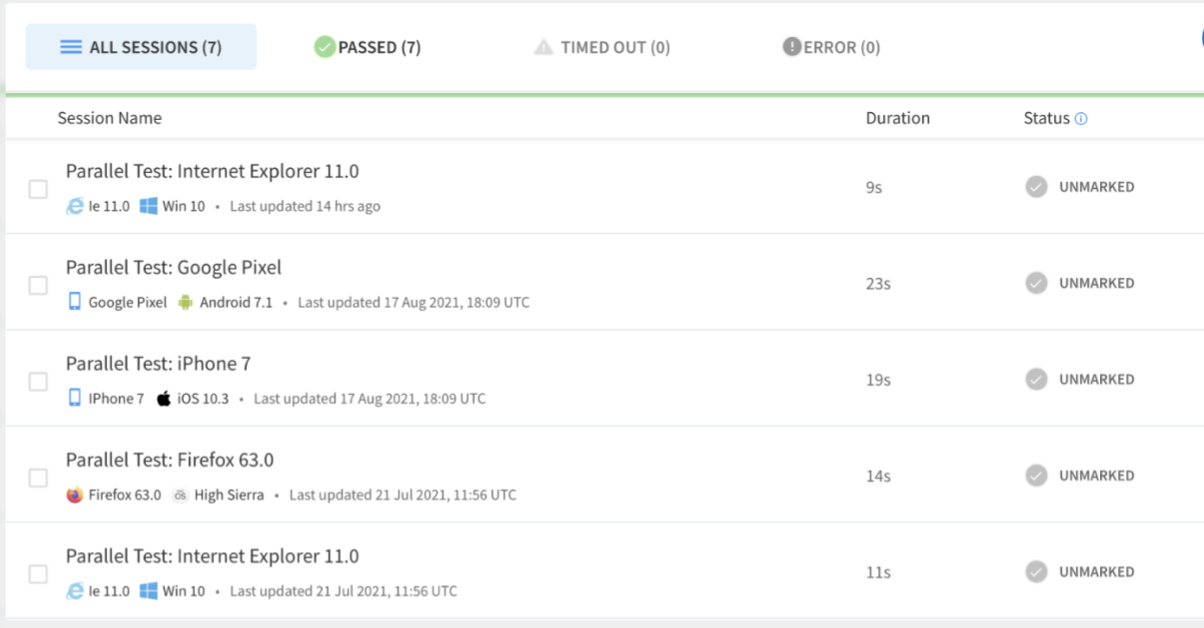
- BrowserStack Automate: Provides real-time dashboards and detailed session logs to visualize and debug automated test executions across various browsers and devices.
- TestNG Reports: Built into TestNG, it generates graphical reports of test results, including pie charts for pass/fail statuses and detailed logs.
- ExtentReports: Offers rich, customizable HTML reports with visuals like charts, heatmaps, and step-by-step test execution details for better debugging.
- Kibana: Works with Elasticsearch to visualize test execution logs and trends in real-time, offering powerful filtering and analysis tools.
- Grafana: Integrates with testing frameworks and CI tools to create dynamic dashboards that visualize test metrics, execution times, and failure rates.
- ReportPortal.io: Provides AI-driven test result aggregation and dashboards for analyzing trends, logs, and root causes of failures in automated tests.
- Azure Test Plans (with Analytics): Visualizes test automation results directly in Azure DevOps, including detailed trend charts, test run metrics, and failure analysis.
- Telerik Test Studio: Offers built-in reporting and visualization features with detailed logs, pass/fail trends, and screenshots for debugging test automation.
- Zebrunner: Provides real-time reporting and dashboards with video logs, screenshots, and AI-powered failure analysis for efficient debugging.
- Chart.js (Custom Implementations): A lightweight JavaScript library that can be integrated into test automation frameworks to create custom charts for debugging test data.
Read More: Top 9 Automated Reporting Tools for Testing
How to Perform Visualization Testing & Debugging with BrowserStack Insights
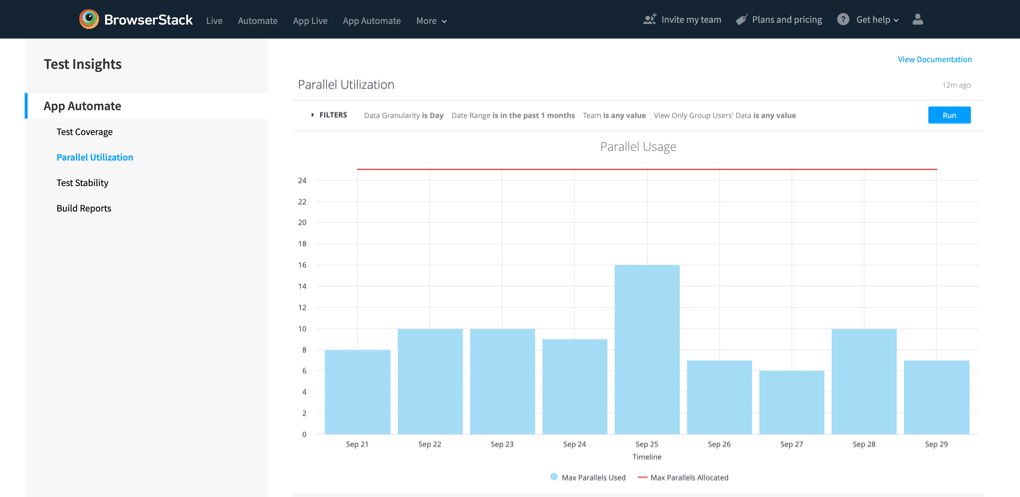
BrowserStack Enterprise provides advanced control, security, and data-visualization features specifically for larger organizations. Data security is increased by adding team-based access control across the platform, and users can be easily provisioned and de-provisioned from your organization’s IdP. Test coverage, parallel utilization, and other data analytics are also available for visualization testing.
BrowserStack’s Test Insights platform is a powerful tool that can help QA teams improve their testing efficiency and quickly release quality software. Test Insights is an interactive dashboard that provides actionable insights to help organizations identify high-impact issues or bottlenecks so they can quickly release quality software.
Test Insights also allows you to toggle different data points on and off in each report simply by turning on or off the toggle. The corresponding data point in the report’s legend works as the toggle. This provides great flexibility in terms of what data is displayed.
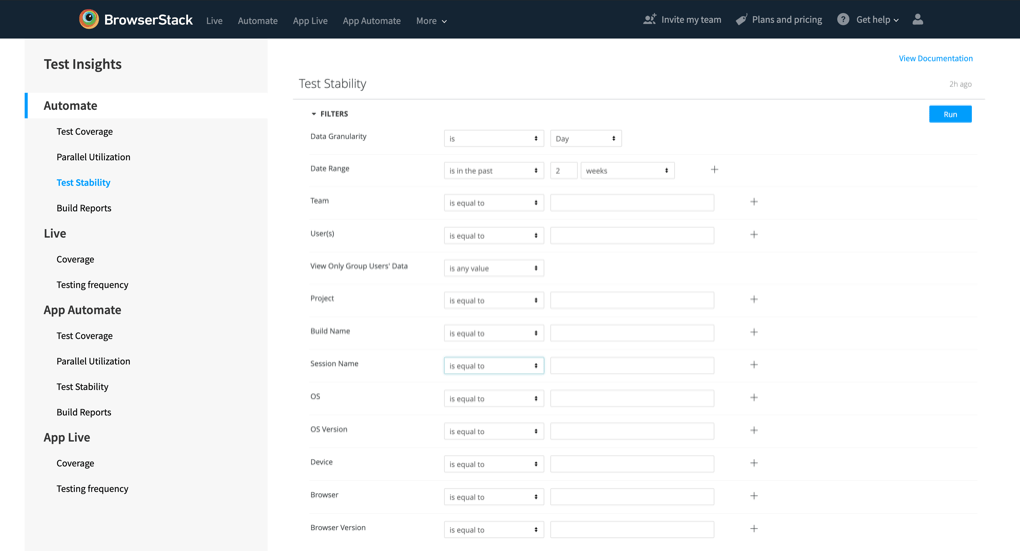
Filter analytics on the Test Insights dashboard provides the ability to restrict the data displayed based on criteria such as builds from the last two months or for a specific project. Multiple combinations of these sections can be added to create powerful data visualization options.
Each filter on the dashboard includes three sections:
- Filter field name (e.g., Teams)
- Operator type (for example, is equal to)
- Target filter value.
Scheduling periodic email reports or sending one-time emails are easy to set up. They can be shared with team members who may not be present on BrowserStack. Reports can be downloaded in PDF or CSV format for sharing via internal mediums.
BrowserStack’s Audit Logs track key activities within your BrowserStack organization account. These logs can be used to analyze how your BrowserStack account is being accessed and how members of your organization are using BrowserStack. This will enable security teams to diagnose problems or answer questions related to users’ product access, accounts, organization settings, etc.
Conclusion
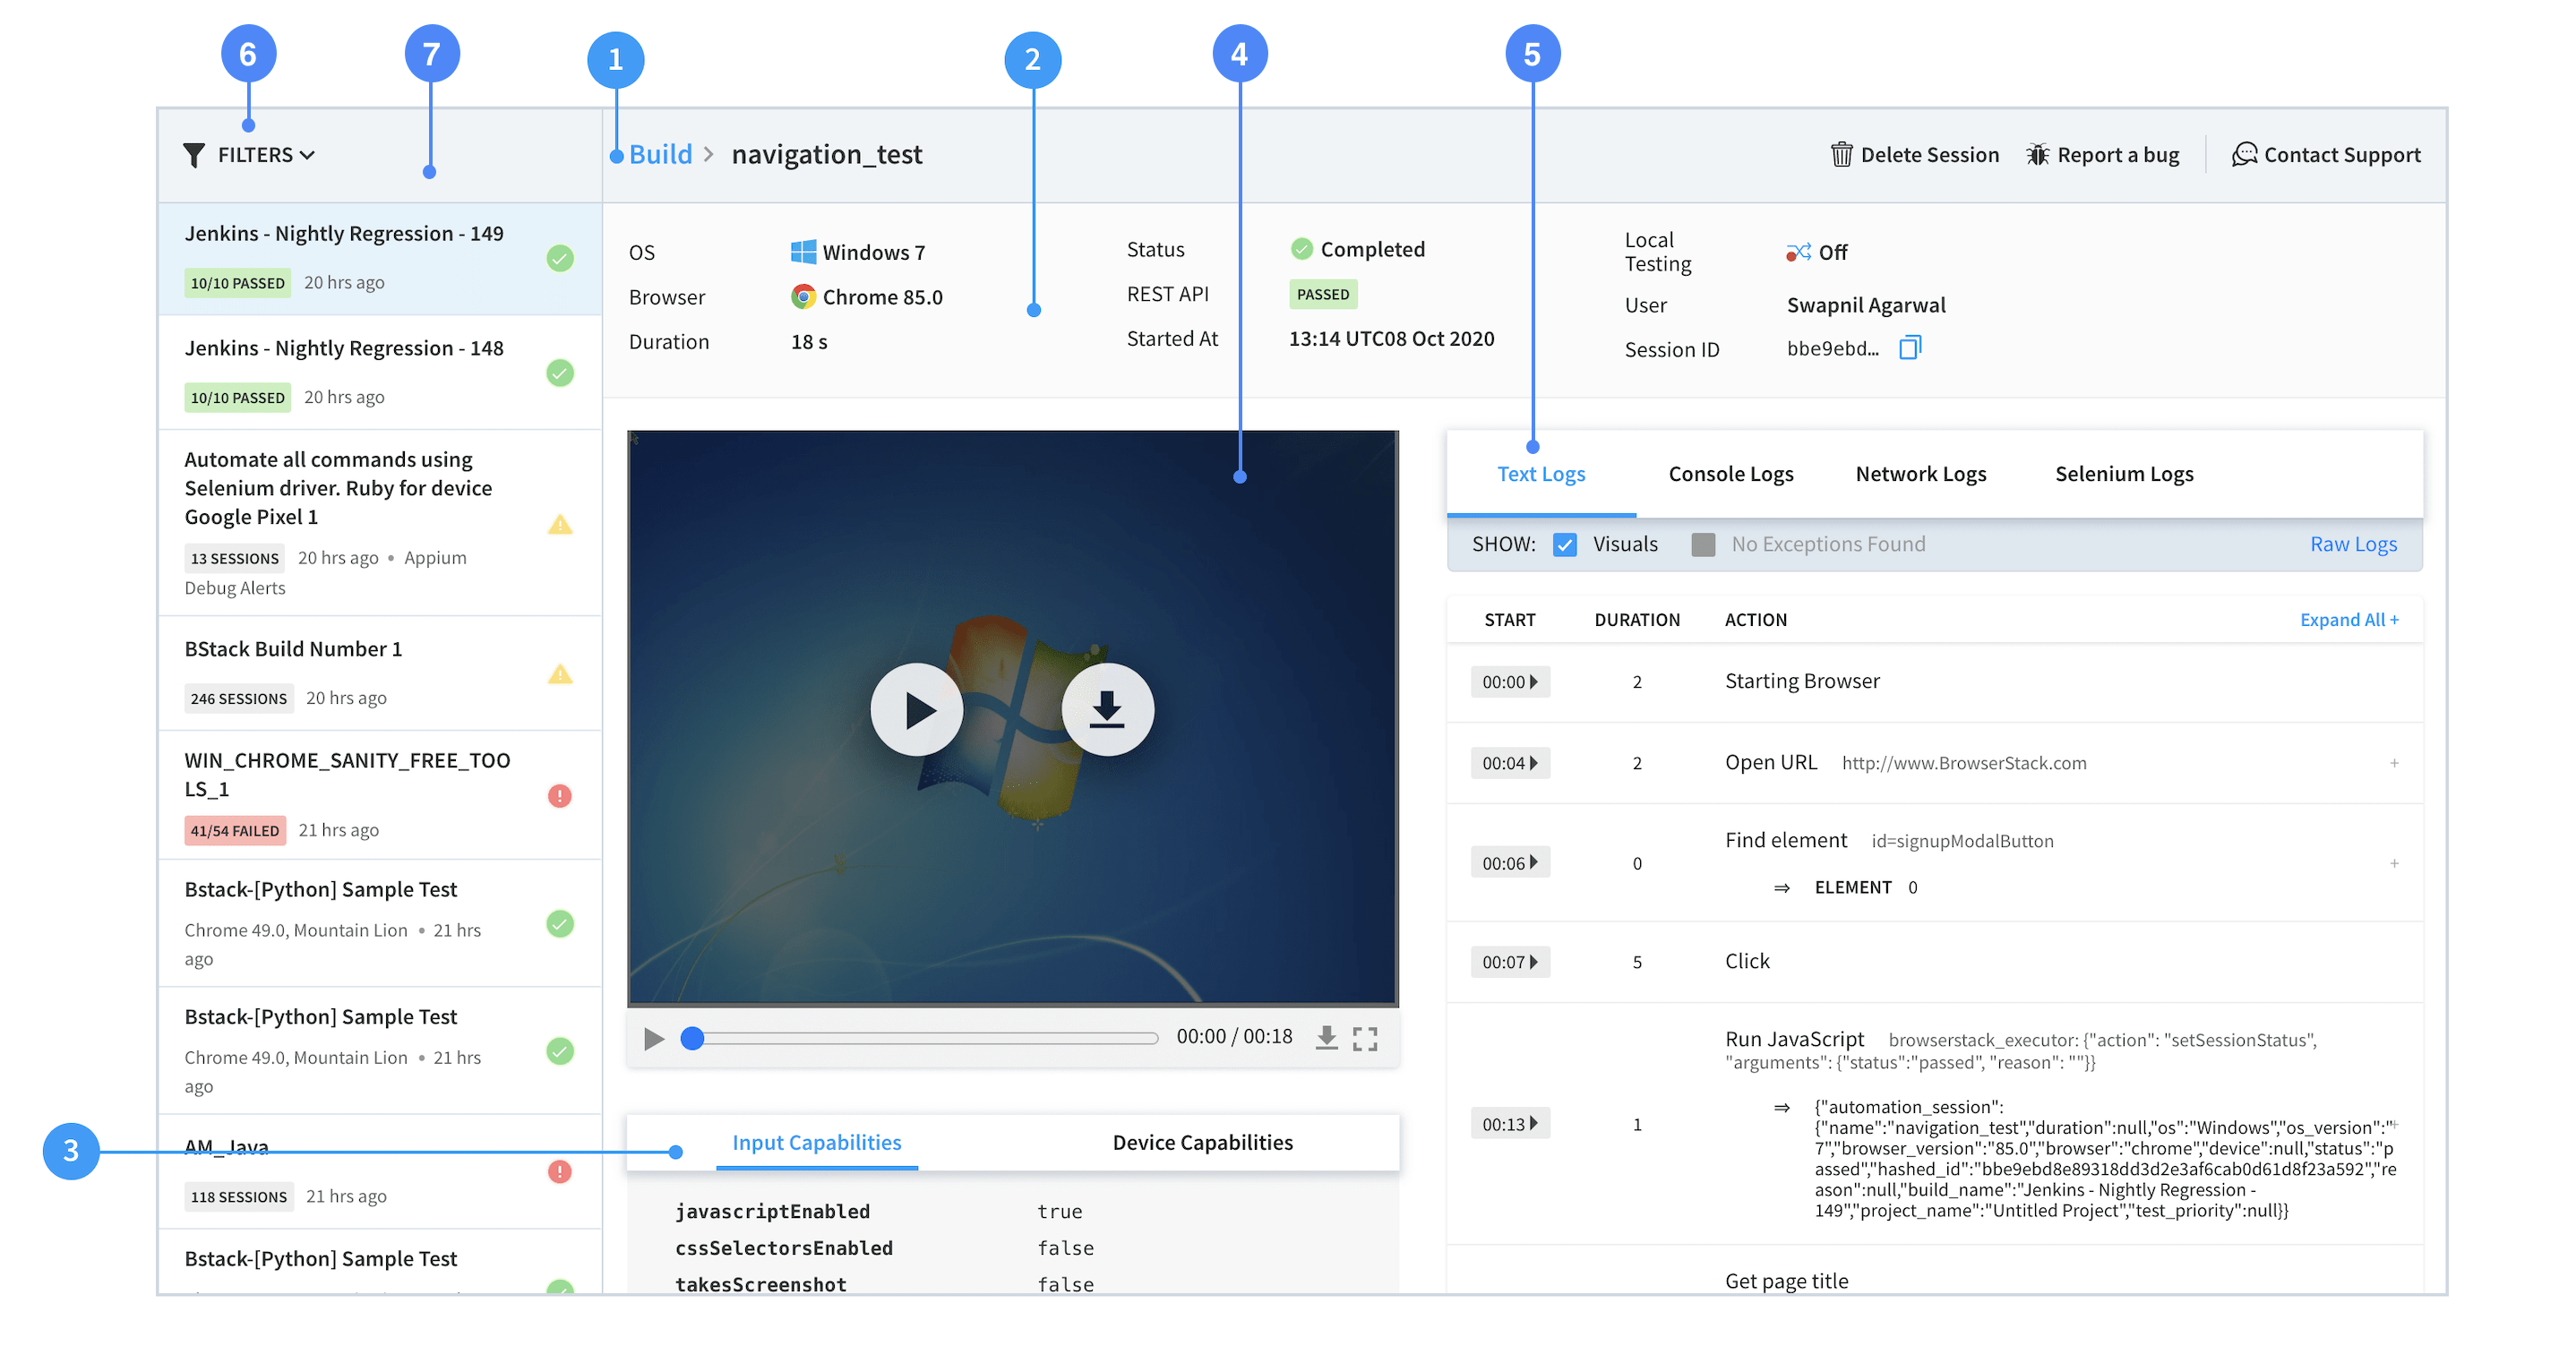
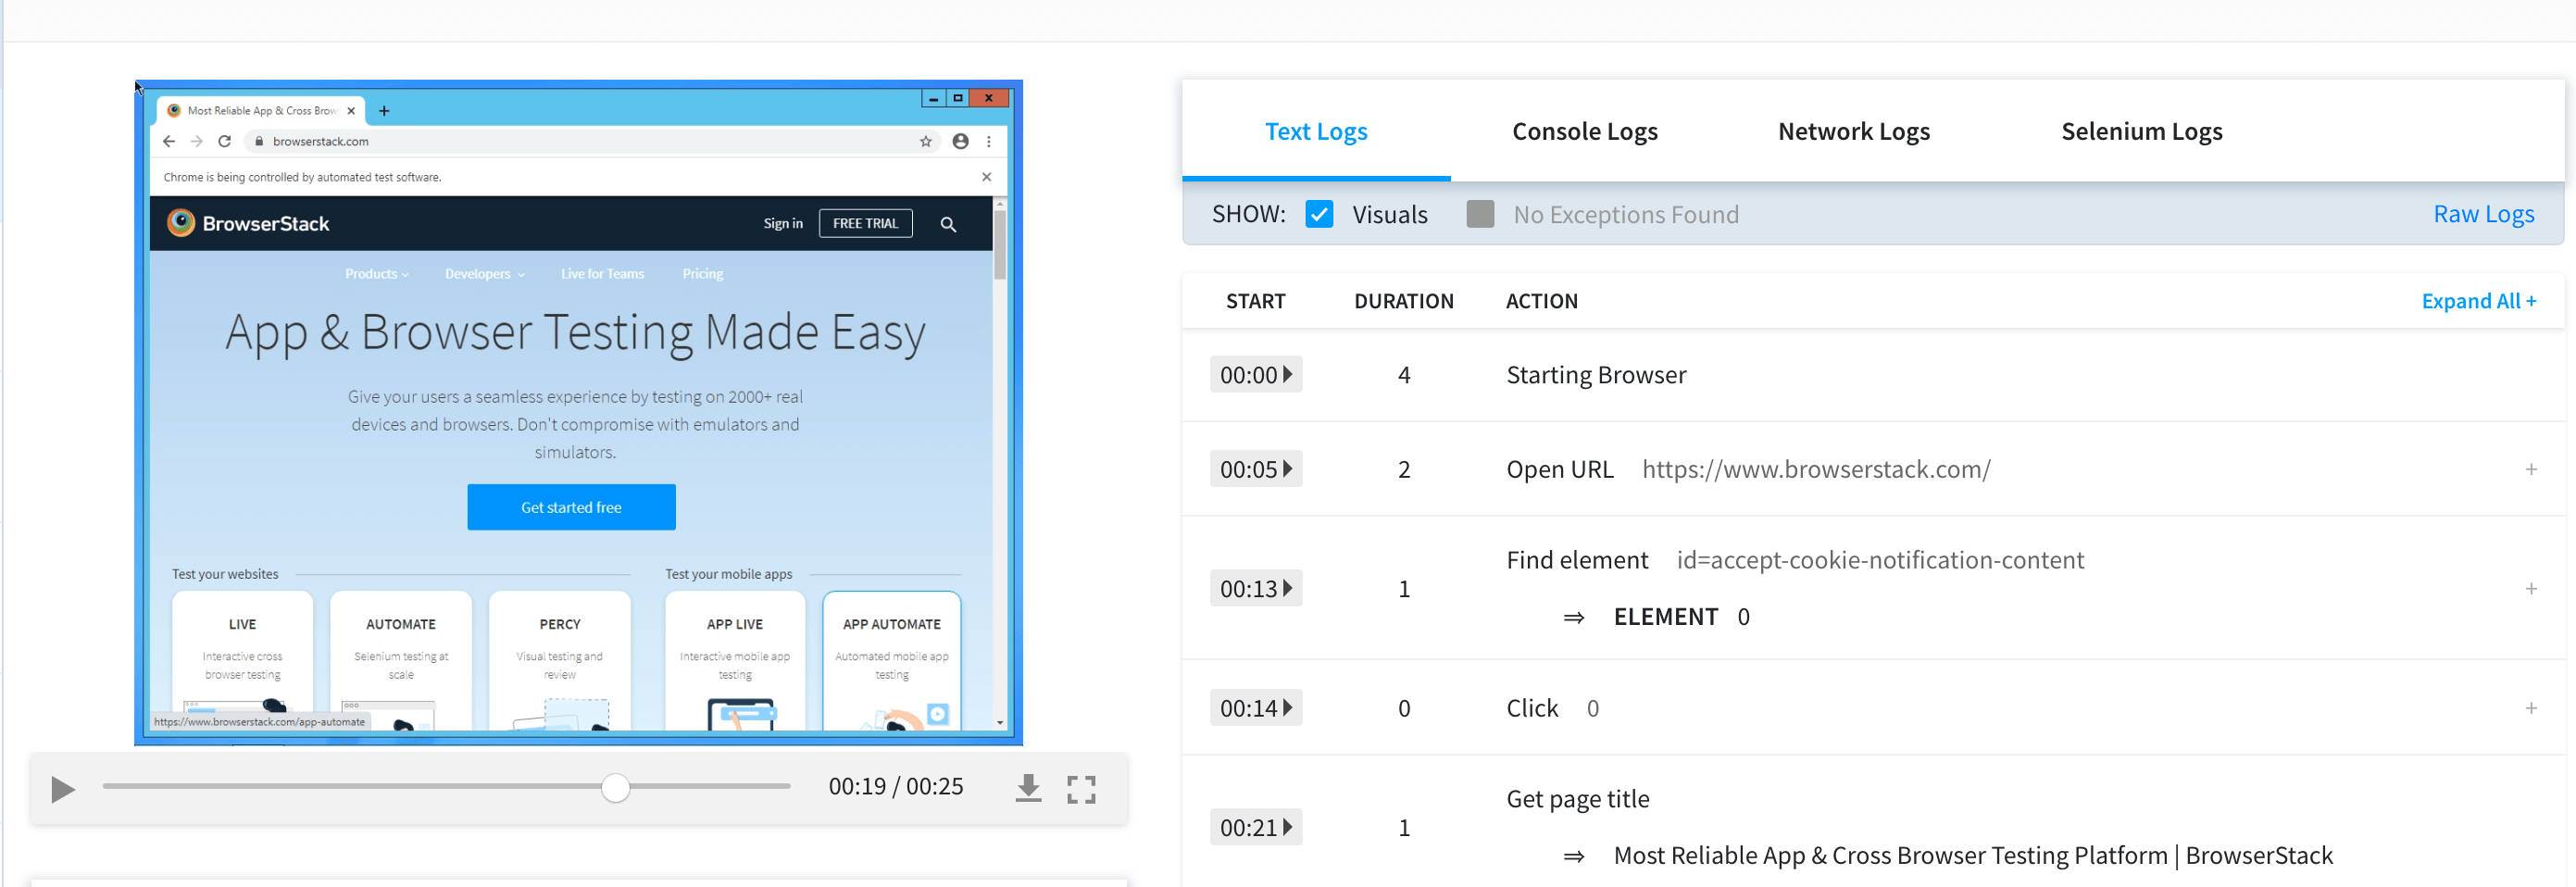
The Automate Dashboard provides a range of debugging tools to help you quickly identify and fix bugs discovered through your automated tests. These tools include the interactive session feature, video recordings, raw Selenium logs, text logs, visual logs, console logs, and network logs.
Video recordings for visualization testing are particularly helpful whenever a browser test fails as they help you retrace the steps which led to the failure. You can access the video recordings from Automate Dashboard for each session and download the videos from the Dashboard or retrieve a link to download the video using REST API for sessions. If your enterprise or testing teams are looking to approach visualization testing with robust test insights and debugging analytics, trust the frontrunners in the testing ecosystem – BrowserStack.


