No Result Found
Connect & Get help from fellow developers on our Discord community. Ask the CommunityAsk the Community

Load testing with Selenium

Run a load test using Selenium scripts on BrowserStack Load Testing

Prerequisites

  • BrowserStack Username and Access key. You can find this under your account profile.
  • An existing automated test suite written in Selenium JUnit, TestNG, or TestNG Cucumber.

Use our load testing sample project to quickly get started.

Run a test

Based on your preferred method of performing load tests, use one of the following methods:

You can start a new test either from the Quick Start page, or the Load Tests page on the Load testing dashboard.

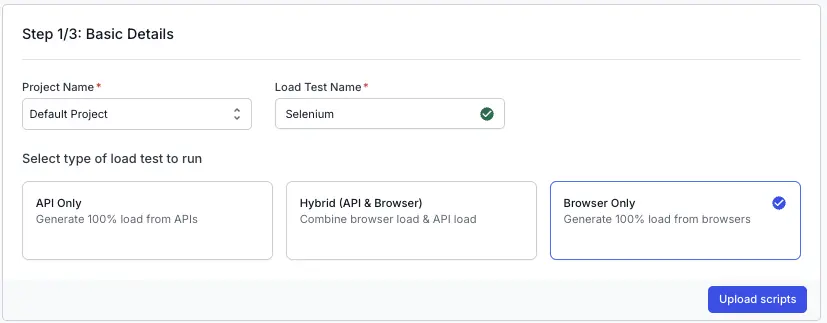
On the dashboard, click Create Load Test.

Screenshot of load testing dashboard showing the run a new test button highlighted

Enter a Test Name for your load test, select Browser Only and click Upload scripts
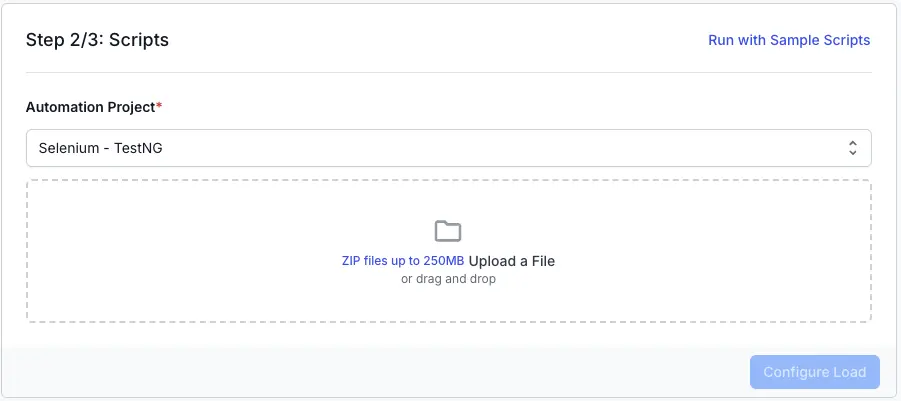
Dashboard showing test name field and type of load test to run

Upload scripts

In this step, upload your Selenium automation project as a ZIP file. Select your framework (for example, Selenium - TestNG) from the dropdown, then drag and drop your ZIP file (up to 250MB) or click to select it.

Before you zip and upload your Selenium automation projects, replace local WebDriver instances (such as new ChromeDriver()) with RemoteWebDriver to run tests on the remote setup. Set the remote URL to http://localhost:4444/wd/hub.
Example RemoteWebDriver driver = new RemoteWebDriver(new URL("http://localhost:4444/wd/hub"), caps);

Screenshot of load testing dashboard asking to add scripts for load testing

After you upload your ZIP file, the dashboard automatically validates your project. If validation is successful, you will see a confirmation message and a summary of the detected configuration and dependencies.

You can review and confirm the configuration file (your TestNG config file) and any other dependencies (path of pom.xml) identified in your project.

Dashboard showing successful validation of a Selenium project ZIP with config and dependencies

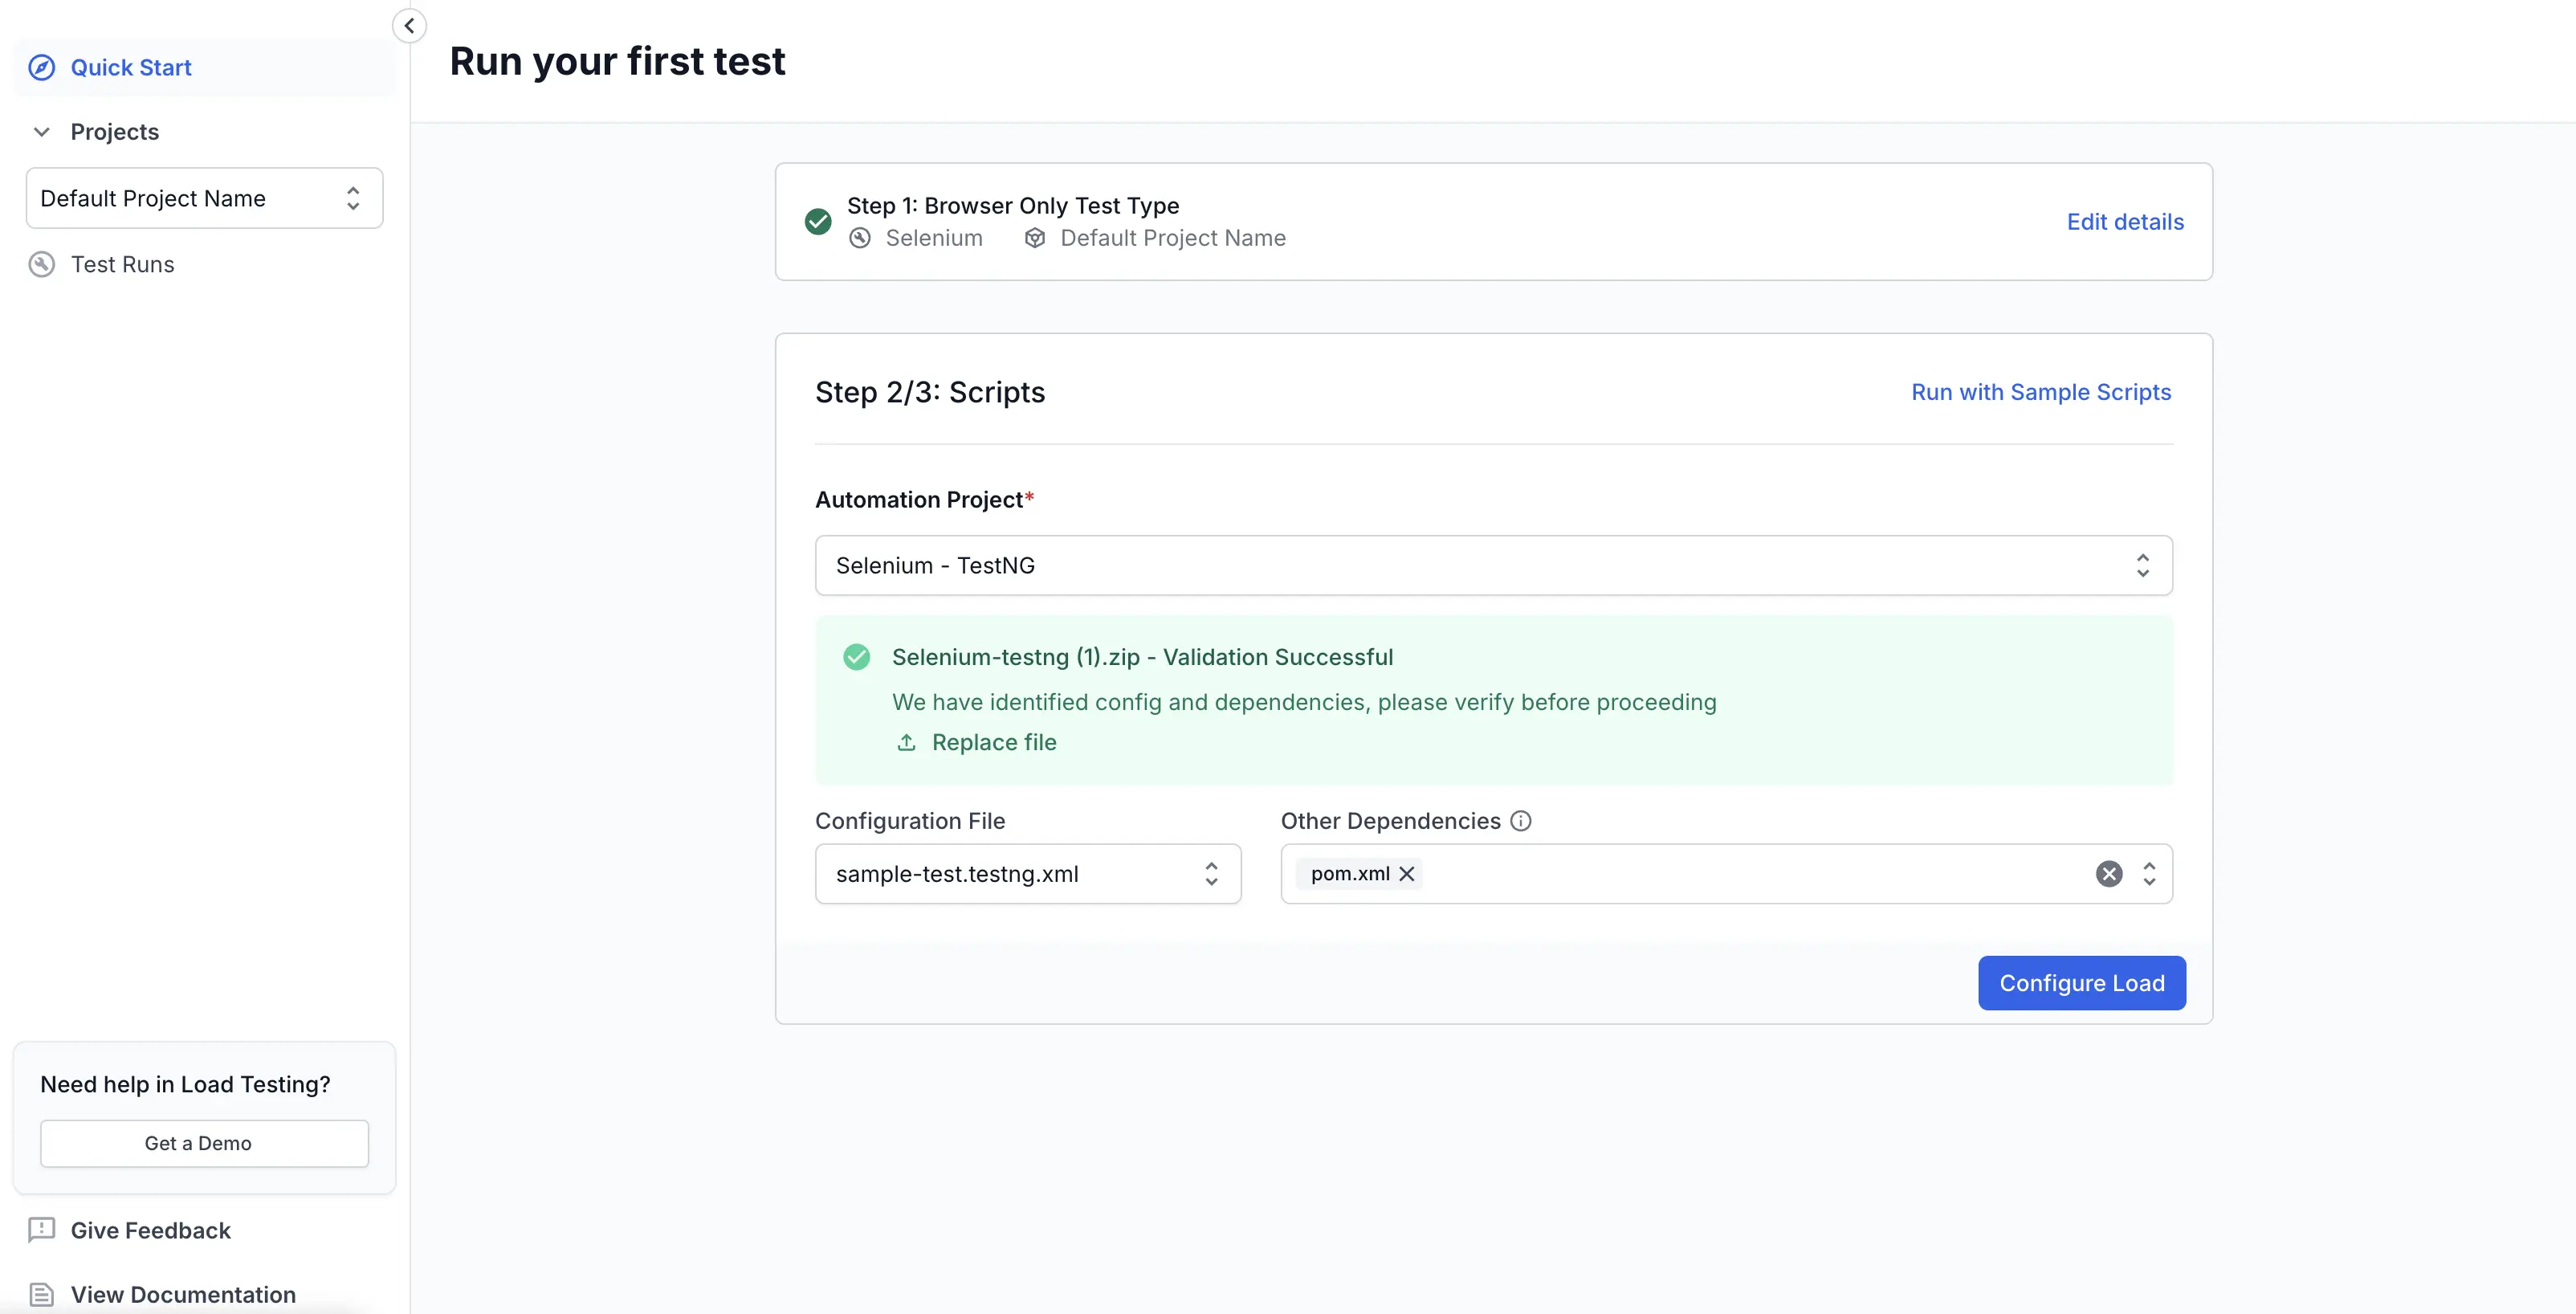
Ensure that your pom.xml and TestNG config files are placed at the root level of your project.

Once you have verified the configuration, click Configure Load to move to the next step.

You can also run load tests using the sample scripts if you want to try out the feature before uploading your own files.

Configure environment variables

Use environment variables to avoid hard-coding secrets and to parameterize your test runs:

  • Upload one or more .env files (up to 5 MB each) by dragging and dropping into the upload area:
    • You can upload .env, .yaml, .yml, .json, .properties, .ini, or .cfg files.
    • After upload, the variables become available to your test run.
  • Manually add key–value pairs:
    • Click Add Variable, then enter the Key and Value.
    • Your variables are saved for this run and applied during execution.
    • Use the bin icon to delete any key-value pair

Screenshot of load testing dashboard asking to upload env variable files and add values

Configure load parameters

Use any of the following Load Profiles for your load test

Select Constant VUs from the dropdowm menu, and set the number of virtual users, test duration, and select load zones.

Screenshot of various load testing configurations available on the dashboard

  • Virtual Users: Enter the total number of users to simulate during the test.
  • Duration: Specify how long the test should run (in minutes).
  • Select load zones: Choose the regions where your tests will run. For each load zone, set the percentage of total load to be distributed. The dashboard visualizes the split with a chart for easy reference.

Screenshot of various load zones available on the dashboard

Select Ramping VUs from the dropdown menu, and configure Ramp-up, Hold, and/or Ramp-down stages.

Screenshot of various stages of load testing configurations available on the dashboard

Each stage will have 4 parameters which will determine the shape of the load curve:

  • Type: Select Ramp-up, Hold, or Ramp-down
  • Duration: Specify the duration of the stage
  • Start VUs: Specify the number of VUs at the start of the stage
  • Target VUs: Specify the number of VUs at the end of the stage
    You can add additional stages as per your test requirement.

  • Select load zones: Choose the regions where your tests will run. For each load zone, set the percentage of total load to be distributed. The dashboard visualizes the split with a chart for easy reference.

Screenshot of various load zones available on the dashboard

Capture response details

Use the Capture response details toggle to record full request–response data for failing HTTP calls during the test. The toggle is set to ‘disabled’ by default.

Toggle enabled for Capture response details setting in BrowserStack load testing UI

Set thresholds

Use thresholds to decide test status based on performance and reliability metrics:

  • Click Thresholds to expand the section. Thresholds section expanded in BrowserStack load testing UI
  • Click Add metric for criteria and choose a metric. Add metric for criteria button with metric selection dropdown in BrowserStack load testing UI
  • Set the condition (for example, is greater than, is less than) and enter a value.
  • Repeat for additional metrics as needed:

Available metrics:

  • Total requests (count)
  • Error % (percentage)
  • Error count (count)
  • Avg request rate (req/s)
  • Avg response time (ms)
  • p90 response time (ms)
  • p75 LCP (s)
  • p75 INP (ms)
  • p75 FCP (s)
  • p75 TTFB (ms)
  • p75 CLS

After configuring all parameters, click Run Test to start your load test.

Set BrowserStack credentials

Save your BrowserStack credentials as environment variables. It simplifies running your test suite from your local or CI environment.

Copy icon Copy
Copy icon Copy
Copy icon Copy

Download the BrowserStack Load Testing CLI

Download the CLI based on your operating system and place it at the root directory of your Selenium project:

Initialize your project for Load Testing

Run the given command from the root directory of your test project to generate the browserstack-load.yml file which contains the configuration required to define and run your load test:

Copy icon Copy

Configure your Load Test

Open the generated browserstack-load.yml file and update it with the relevant test details. Here’s a sample configuration:

Specify the test type

testType defines the type of load test that you want to execute. Currently, Playwright, Selenium and WebdriverIO are supported. Set this to Selenium for a load test using Selenium test suite.

Specify the language

Set the language to java.

Currently, only Selenium with Java TestNG, and TestNG Cucumber is supported.

Specify the test framework

Set the framework to testng, or, cucumber-testng for TestNG Cucumber, depending on your preferred testing framework.

Specify the paths to your TestNG configuration file and pom.xml file

The files block specifies the key files required to install dependencies and define which tests should be executed.

  • Under dependencies, list the paths to required files for installing dependencies. For Java (Maven) projects, include the path to your pom.xml file. Note: Only Maven projects are currently supported.
  • Under testConfigs, list the paths to test configuration files. For TestNG, add the path to your testng.xml file. Note: Only one configuration file is supported per test run. If you specify multiple files, only the first one will be used.

Ensure all referenced files are relative to the project root.

Specify number of virtual users

Set vus to the maximum number of virtual users to simulate during the test. The max limit for this config is currently 100. Contact us if you want to increase this limit.

Before running a full-scale load test, do a sanity check with a small set of virtual users to validate your configuration and test stability.

Set duration

Each virtual user (VU) repeatedly executes the test(s) in a loop until the specified duration ends.

How to set duration values:

  • If less than 1 minute: use seconds (_s), e.g., 45s
  • If less than 1 hour: use minutes and seconds (_m_s), e.g., 12m30s , 10m
  • If 1 hour or more: use hours, minutes, and seconds (_h_m_s), e.g., 1h5m20s, 1h17m, 1h

Default value: By default, the duration is set to the time required to complete a single iteration of your test(s).
The maximum limit is 20 minutes, which you can extend on request.

You can set a constant duration or configure ramping VUs to model various load scenarios.

Configure Ramping VUs

If you want to gradually increase or decrease VUs over time, use the loadprofile config instead of duration. This approach lets you model realistic traffic patterns such as ramp-ups, peak holds, and ramp-downs.

  • Under the loadProfile block, set type to ramping to enable staged traffic changes.
  • Under stages, add one or more steps:
    • type: ramp increases or decreases VUs from from to to over duration. Result: VUs change linearly until they reach the target.
    • type: hold keeps VUs constant for duration. Result: VUs stay at the specified level without change.
  • Keep stage durations realistic. Very short ramps can cause bursty load that is hard to analyze.
  • Ensure your total vus is high enough to cover the largest stage to value. If not, the test cannot reach the target VUs.

Validation rules:

  • Each stage must include type, from, to, and duration.
  • Use valid time units (Xs, Xm, Xh). Example: 45s, 10m, 1h5m.
  • from and to must be non-negative integers and must not exceed the global vus limit.
  • Avoid overlapping or contradictory stages (for example, alternating rapid up/down ramps) unless you are testing resilience to bursty traffic.

Set Regions

  • Use the loadzone sub-config to specify each region. For each region, set the traffic percentage using the percent sub-config.
  • Make sure that the total percentage equals 100.
Continent Region loadzone config value to be passed
North America US East (Virginia) us-east-1
North America US West (North California) us-west-1
Asia Asia Pacific (Mumbai) ap-south-1
Asia Middle East (UAE) me-central-1
Europe EU West (London) eu-west-2
Europe EU Central (Frankfurt) eu-central-1
Australia Asia Pacific (Sydney) ap-southeast-2

Set environment variables

The env config lets you pass an array of name-value string pairs to set environment variables on the remote machines where tests are executed.
Currently, a maximum of 20 pairs is allowed.

Environment variables can be set using any one of the following two methods:

Inline variables

Declare each variable with a name and value. BrowserStack injects these pairs into the test environment.

File-based variables:

Use sources to reference one or more files containing environment variables (for example, .env files). Use variables to add or override specific pairs. Result: the system loads values from files first, then applies overrides.

Set reporting structure

Use projectName to group related tests under the same project on the dashboard. Use testName to group multiple runs of the same test.
Both projectName and testName must remain consistent across different runs of the same test.
You can use the following characters in projectName and testName:

  • Letters (A–Z, a–z)
  • Digits (0–9)
  • Periods (.), colons (:), hyphens (-), square brackets ([]), forward slashes (/), at signs (@), ampersands (&), single quotes ('), and underscores (_)
    All other characters are ignored.

Capture response details

Set to captureErrorResponses to true to record full request–response data for failing HTTP calls during the test.

Set thresholds

Use thresholds to determine test pass or fail based on metrics.

Available Metric list and corresponding keys for load testing:

  • Avg. response time - avg-response-time
  • p90 response time - p90-response-time
  • Avg. request rate - avg-request-rate
  • Total requests - total-requests
  • Error % - error-percentage
  • Error count - error-count
  • p75 LCP- p75-lcp
  • p75 FCP- p75-fcp
  • p75 INP- p75-inp
  • p75 CLS- p75-cls
  • p75 TTFB - p75-ttfb

Available conditions:

  • =
  • !=
  • >
  • <
  • >=
  • <=

We assume the following units for the metrics:

  • Avg. response time, p90 response time, INP, TTFB - ms
  • Avg. request rate - reqs/s
  • Error % - %
  • FCP, LCP - s
  • Total requests, Error count, CLS - no unit
browserstack-load.yml

Use RemoteWebDriver

Replace local WebDriver instances (such as new ChromeDriver()) with RemoteWebDriver to run tests on the remote setup. Set the remote URL to http://localhost:4444/wd/hub.

Copy icon Copy

Run the Load Test

Run the given command to start your test:

Copy icon Copy

Check out the FAQs section to get answers to commonly asked questions.

View test results

When the test is run, you’ll get a link to the result dashboard where you can analyze key metrics like:

  • Response time
  • Request throughput
  • Web vitals (LCP, CLS, INP, etc.)
  • Errors and bottlenecks

We're sorry to hear that. Please share your feedback so we can do better

Contact our Support team for immediate help while we work on improving our docs.

We're continuously improving our docs. We'd love to know what you liked


Thank you for your valuable feedback

Is this page helping you?

Yes
No

We're sorry to hear that. Please share your feedback so we can do better

Contact our Support team for immediate help while we work on improving our docs.

We're continuously improving our docs. We'd love to know what you liked


Thank you for your valuable feedback!

Talk to an Expert
Download Copy Check Circle