Test efficiency is a critical concept in software testing that quantifies how effectively the testing process identifies defects before software reaches the end user.
As software development cycles become faster and more iterative, evaluating test efficiency ensures that testing activities add measurable value and are aligned with delivery goals.
Overview
Formula for Calculating Test Efficiency:
Test Efficiency (%) = (Defects Detected During Testing / Total Defects) * 100
Essential Metrics for Test Efficiency:
1. Metrics that Cover Cost-effectiveness and ROI
- Cost per Defect
- Test Cost Ratio
- ROI of Testing Tools/Automation
2. Metrics that Cover Test Case Efficiency
- Defects per Test Case
- Test Case Execution Rate
- Test Case Failure Rate
3. Metrics that Measure Test Coverage
- Requirements Coverage
- Code Coverage
- Risk Coverage
4. Defect-Oriented Metrics for Test Efficiency
- Defect Detection Percentage (DDP)
- Defect Leakage
- Defect Removal Efficiency (DRE)
- Severity Index
This article explores test efficiency, how it differs from test effectiveness, and which metrics help organizations track and improve this performance indicator.
What is Test Efficiency?
Test efficiency refers to the capability of a testing process to detect and report defects relative to the effort, cost, or time invested. It’s not just about finding bugs, but doing so in a timely and resource-efficient manner.
Mathematically, it is often expressed as:
Test Efficiency (%) = (Defects Detected During Testing / Total Defects) * 100
Where “Total Defects” includes both those detected during testing and those found after release (in production).
For example, if 80 defects are found during testing and 20 post-release:
Test Efficiency = (80 / (80 + 20)) * 100 = 80%
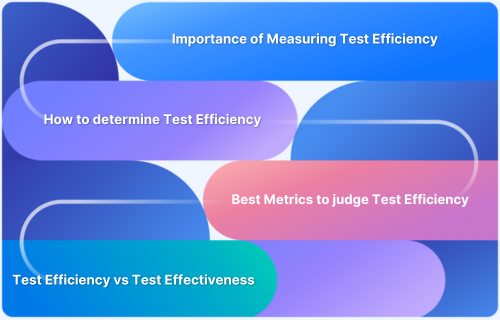
Importance of Measuring Test Efficiency
Monitoring test efficiency offers multiple strategic advantages:
- Optimization of Testing Resources: It helps allocate time and resources to the most productive testing practices.
- Reduction in Post-release Defects: Early detection minimizes the cost of fixing bugs later.
- Better Planning: High or low efficiency helps QA managers decide whether to revise the test strategy.
- Alignment with Business Goals: Efficient testing supports faster time-to-market without compromising quality.
By measuring test efficiency, teams can shift their approach from reactive testing to proactive quality assurance.
Read More: How to determine the right testing metrics
Test Efficiency vs Test Effectiveness
While both metrics sound similar, they evaluate different dimensions:
- Test Efficiency measures how well the testing process uses resources to find defects.
Test Efficiency (%) = (Defects Found During Testing / Total Defects) * 100
- Test Effectiveness measures how many actual defects are identified compared to the total defects present.
Test Effectiveness = (Number of valid defects fixed / Number of defects injected + Number of defects escaped) * 100
| Metric | Focus | Key Question |
|---|---|---|
| Test Efficiency | Resource utilization | Are we using time and effort efficiently? |
| Test Effectiveness | Defect detection capability | Are we catching most of the critical defects? |
A high-efficiency score with low effectiveness may indicate resourceful testing with poor coverage. Conversely, high effectiveness with low efficiency may mean exhaustive but costly testing.
Best Metrics to Judge Test Efficiency
Test efficiency is multi-dimensional. Judging it accurately involves combining metrics across cost, coverage, defect analysis, and test case performance. Below are categorized metrics that contribute to a robust evaluation of test efficiency.
Metrics that Cover Cost-effectiveness and ROI
These metrics help evaluate how testing impacts overall project costs and return on investment:
1. Cost per Defect: Measures the cost-effectiveness of your testing efforts.
- Formula: Cost per Defect = Total Testing Cost / Number of Defects Found
2. Test Cost Ratio: Reflects how much of the total project budget is consumed by testing.
- Formula: Test Cost Ratio = Testing Cost / Total Project Cost
3. ROI of Testing Tools/Automation: Determines whether investment in tools or automation returns measurable benefits.
- Formula: ROI (%) = (Benefits from Testing Tools – Cost of Tools) / Cost of Tools * 100
Metrics that Cover Test Case Efficiency
These metrics measure how effective individual test cases are in identifying defects:
1. Defects per Test Case: Evaluates the yield of each test case in detecting bugs.
- Formula: Defects per Test Case = Total Defects Found / Total Test Cases Executed
2. Test Case Execution Rate: Tracks how many test cases are executed within a time frame.
- Formula: Test Case Execution Rate = Number of Test Cases Executed / Total Time (e.g., per day or sprint)
3. Test Case Failure Rate: Indicates the percentage of test cases that lead to defect detection.
- Formula: Test Case Failure Rate = (Failed Test Cases / Total Test Cases Executed) * 100
Read More: Essential Metrics for the QA Process
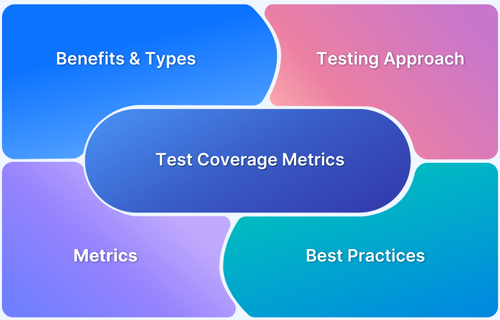
Metrics that Measure Test Coverage
Coverage metrics assess how comprehensively the software has been tested:
1. Requirements Coverage: Ensures that each requirement has at least one test case.
- Formula: Requirements Coverage (%) = (Requirements with Test Cases / Total Requirements) * 100
2. Code Coverage: Measures the amount of code exercised during testing.
- Formula: Code Coverage (%) = (Number of Code Elements Tested / Total Code Elements) * 100
3. Risk Coverage: Evaluates how well high-risk areas of the application are tested.
- Formula: Risk Coverage (%) = (Tested High-Risk Features / Total High-Risk Features) * 100
Defect-Oriented Metrics for Test Efficiency
These metrics provide insight into the defect detection capability of your testing process:
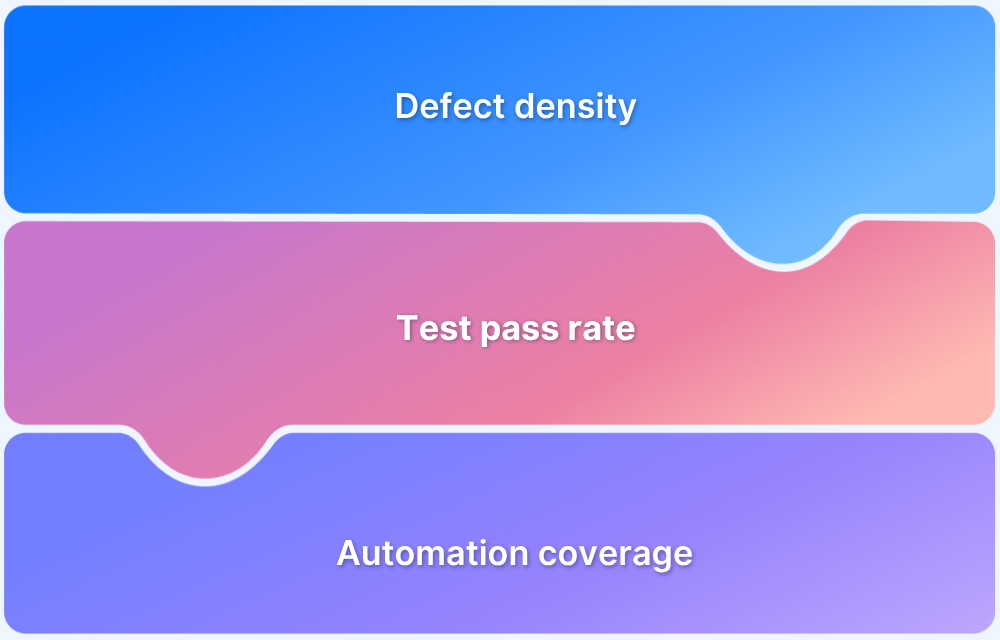
1. Defect Detection Percentage (DDP): Indicates how many of the total defects were detected before release.
- Formula: DDP (%) = (Defects Found During Testing / Total Defects) * 100
2. Defect Leakage: Highlights the number of bugs that escaped into production.
- Formula: Defect Leakage (%) = (Defects Found Post-release / Total Defects) * 100
3. Defect Removal Efficiency (DRE): Measures the effectiveness of defect removal during testing.
- Formula: DRE (%) = (Defects Found and Fixed During Testing / (Defects Found During Testing + Post-release)) * 100
4. Severity Index: Reflects the criticality of discovered defects.
- Formula: Severity Index = Σ (Number of Defects at Severity Level * Weight of Severity Level) / Total Defects.
Read More: Defect Management in Software Testing
Ways to Improve Test Efficiency
Improving test efficiency is not about cutting corners; it’s about smarter testing. Here are effective strategies to enhance efficiency:
- Shift Left Testing: Start testing early in the development cycle to catch defects at the source.
- Automation of Repetitive Tasks: Use test automation for regression, smoke, and load tests to save time and reduce manual effort.
- Risk-Based Testing: Prioritize test cases based on business-critical or high-risk areas of the application.
- Better Test Case Design: Use techniques like boundary value analysis, equivalence partitioning, and decision tables to improve the quality of test cases.
- Continuous Integration and Testing: Integrate testing into the CI/CD pipeline for faster feedback and defect detection.
- Regular Test Case Review and Optimization: Remove obsolete test cases and refine existing ones for relevance and effectiveness.
- Use of Metrics and Dashboards: Actively monitor test metrics to identify bottlenecks and improvement areas.
- Training and Skill Development: Invest in upskilling testers in new tools, frameworks, and methodologies.
- Collaborative Testing: Encourage cross-functional collaboration (dev, QA, product) to improve clarity and coverage.
- Exploratory Testing: Complement scripted testing with exploratory sessions to uncover unexpected defects.
Best Practices for using Test Efficiency Metrics
While metrics offer valuable insights, their interpretation and application require care. Here are some best practices:
- Use Multiple Metrics Together: No single metric gives the full picture; combine different types.
- Align Metrics with Project Goals: Prioritize what matters—cost, speed, risk, or quality.
- Review Regularly and Iterate: Evaluate metrics after each sprint or release to refine strategies.
- Avoid Vanity Metrics: Focus on actionable data, not just favorable numbers.
- Ensure Data Accuracy: Use reliable tools and consistent logging practices
Conclusion
Getting the right metrics pinned down and leveraging them optimally is essential to the planning and execution of a QA process. These metrics can be especially important in an Agile environment as the test managers have to be mindful of even the most minute goals and objectives being considered for every sprint.
Comprehensive and contextually right test metrics help testers to stay on track and understand the exact nature of the goals they are trying to meet. Any sub-optimality in these results can allow test leaders to recalibrate the efficiency of the test process.
It is imperative to understand that the entire QA process hinges on the use of a real device cloud. Without real device testing, it is impossible to identify every possible bug a user may encounter. Naturally, undetected bugs cannot be tracked, monitored, or resolved, and even the most efficient QA metrics cannot be used to set baselines and measure success.
Use BrowserStack’s Cloud Selenium Grid of 3500+ real browsers and devices to run all requisite tests in real user conditions. Manual testing is also easily accomplished on the BrowserStack cloud. Sign Up for free, choose the requisite device-browser combinations, and start testing.


