In control theory, observability is a measure of how well internal states of a system can be inferred from knowledge of its external outputs. - Wikipedia
The term observability means that one can determine the current state of the system (in this case, the software application) based on its external outputs or signals. Observability helps in understanding what is happening on the inside of the system just by leveraging the external indicators.
Need for observability
The main goal for every company is to be successful by generating revenue and gaining customers. In order to gain customers, the software application should be reliable and scalable. In an ideal world, the company would constantly keep growing because the software application continues to be reliable and always scales well. However, in reality, unexpected scenarios do happen.
During such a scenario, an on-call engineer has to act fast and resolve it. Usually, the engineer is flooded with questions to figure out what is happening. The questions to be answered would be identifying the duration of the failure, type of failure, affected customers, and time to uptime. This is where observability provides visibility into the system. It is a gateway for handling known and unknown situations.
Now, the observability becomes an important characteristic of the software system just like reliability and scalability. As a result, the system is scalable from not only from the technology aspect but also from engineer productivity aspect. With observability, one can identify potential bottlenecks and areas of optimization. Thus, leading to a performant system and lesser failures.
Pillars of Observability
The three popular pillars of observability are: Metrics, Tracing and Logs.
Metrics
Metrics help in measuring the system quantitatively. Everything in the system is measurable. But the key lies in identifying what to measure. Since metrics are the foundation of trend analysis and alerting, it is important to identify the critical metrics. Hence, metrics are the golden signals that provide insight into the system.
Types of Metrics:
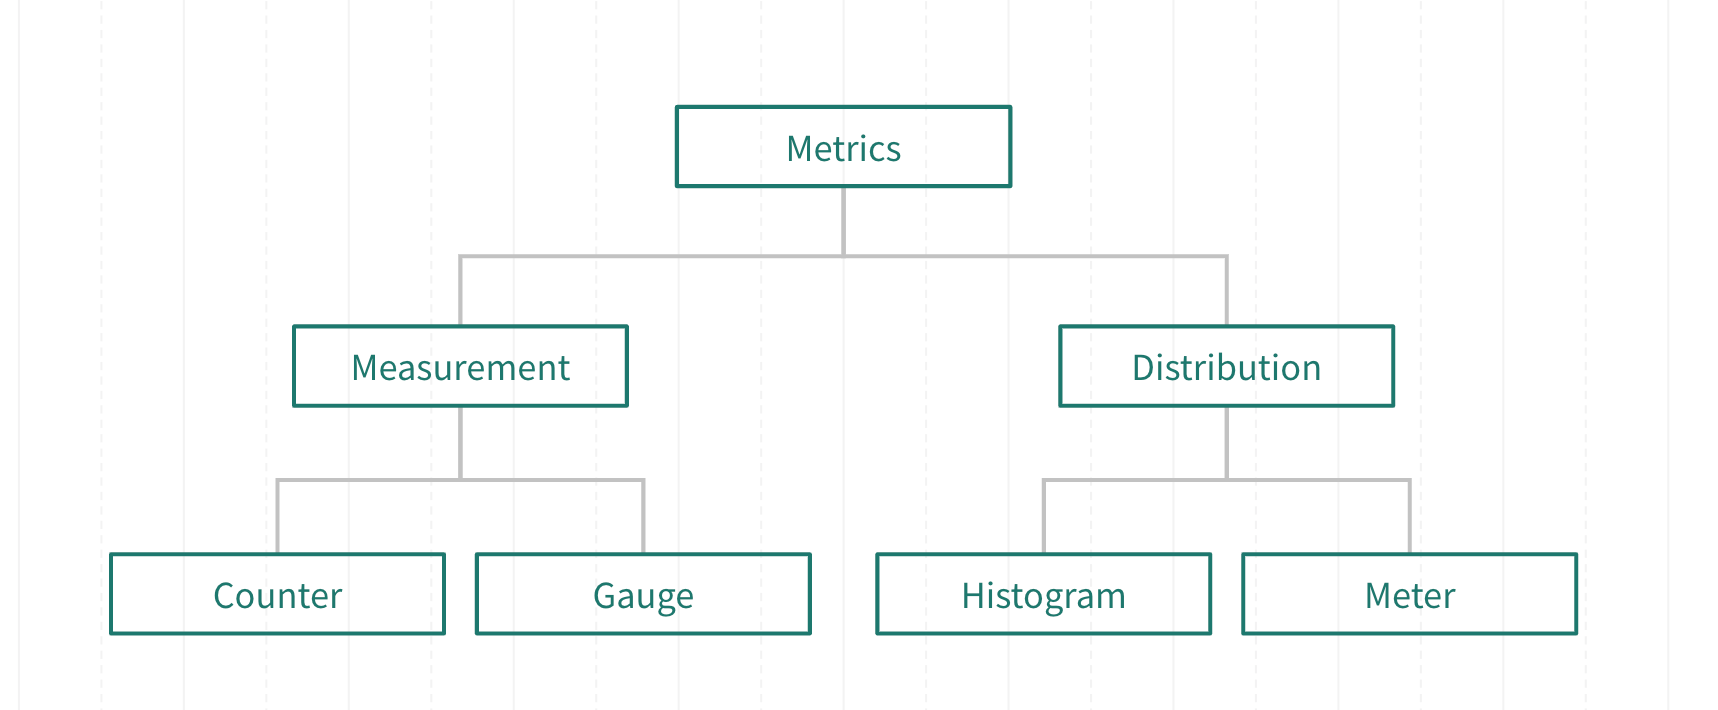
Metrics can be classified broadly into two categories—Measurement and Distribution.
There is no standardization in the terms used in this section. The key is understanding the underlying concepts.
Measurement
Measurement metrics are the simplest and most basic types of metrics. They provide accurate measurement values.
Counter
As the name suggests, it is used to count. It is an additive measure since it adds to or subtracts from a base value. Usually, counters are monotonically increasing or decreasing but sometimes they can be both. Monotonically increasing means the value either remains the same or increases but does not decrease.
Example:
- Total no. of users
- Successful/ Failed requests
- No. of open-connections
Gauge
Gauge is a value at that instant of time. A simple example of the gauge is a thermometer, it shows the temperature at that instant. Since gauge does not add to a base value, it is a non-additive metric.
Example:
- Current no. of threads
- Current memory usage
- Queue size
Distribution
Distribution type metrics are complex in nature. They provide an approximate representation of the underlying metrics data.
Histogram
Histogram metrics represent the distribution of data. It primarily provides quantile and percentile value. In order to understand this further let’s quickly revisit a simple median calculation. Consider a set of 9 numbers, in order to calculate the median we first sort the numbers and pick the middle element i.e the 5th element. This number is the median or 50th percentile, which means that 50% numbers are below the median and 50% numbers are above the median value. Similarly, for 99th percentile, 99% of the value are below that value.
It is easy to calculate these values for a small set of numbers, but with the time-series nature of metrics, the data explodes into million data points easily and to sort and store them to get percentile values is not practical. Hence, the data is sampled to represent the underlying data approximately and the values are calculated over a sliding window of a time-period (Ex: 1 minute, 5 minutes, 10 minutes).
Values like 99th percentile are used to identify the outlier values and this is important to make engineering decisions. Example, for an on-call engineer it would important to know that the 99th percentile request latency for the application went from 10ms to 50ms in the last 10 minutes than knowing the actual values per millisecond. It depicts the shift in the whole data distribution.
Example:
- CPU usage
- Request latency
Meter
It is a rate metric. One common example is the number of requests handled per second. Meter is sometimes included as part of the histogram. Knowing the rate for each second is not very useful, hence aggregation over this data adds value. A common aggregation would be average. Again, the average calculated over a sliding window of time is more useful than the average calculated from the time the application started. Average filters out the noisy data. Hence a weighted average is a better aggregate. Ideally with more weight given to the recent data or more weight given to the higher values will keep the shape of the graph intact to identify peaks and dips.
Example:
- No. of requests per second
- Error count per 5 minutes window
Logs and Event logs
Logging is identifying important points in the code and recording the information at the instant. It also involves identifying the logging level to be used based on the information recorded. Logging is often done in a human-readable format or structured format for machines to analyze and search over it. Logs are key for debugging and simulating IDE debug feature when code is running in production.
A simple log example :
16:27:57.042 INFO [LoggingOptions.getTracer] - Using OpenTelemetry for tracing
116:27:57.042 INFO [LoggingOptions.getTracer] - Using OpenTelemetry for tracing
Structured logging is a common practice of recording logs consistently in a fixed format. It commonly contains fields like:
- Timestamp
- Logging level
- Logger class
- Log message (This is further broken down into fields relevant to the operation where the log was recorded)
A structured log is the same as a simple log but with key-value pairs, where the keys are fixed fields.
1{"class": "LoggingOptions", 2"log-level": "INFO", 3"log-message": "Using OpenTelemetry for tracing", 4"log-name": "org.openqa.selenium.grid.log.LoggingOptions", 5"log-time-local": "2020-11-12T16:27:57.042+05:30", 6"log-time-utc": "2020-11-12T10:57:57.042Z", 7"method": "getTracer"} 89
However, there is a better way to look at logs. Think of important operations in your code as events. Each event can record all the context of the event as a log. So each step in the application workflow should have event-logs that provide all the answers about that step. It can include the inputs, outputs, results, error details, and/or important attributes collected along the way. Pretty much whatever information is available and can help debug should be included in an event log. Event-logs like all structured logs have fix fields but the fields can have variable nested fields to encapsulate the context. Observe the two-event logs below, at first sight, they seem like structured-logs but the event-logs are from Selenium 4.0.0 Alpha 7 capturing context to for a specific operation.
116:34:34.136 INFO [LoggingOptions$1.lambda$export$0] - { 2 "traceId": "a9a9a87f0be04eec6ca4fed26b77274f", 3 "spanId": "534e81ac65fe1c20", 4 "spanKind": "INTERNAL", 5 "eventTime": 1605179071797141816, 6 "eventName": "Session request received by the distributor", 7 "attributes": { 8 "logger": "org.openqa.selenium.grid.distributor.local.LocalDistributor", 9 "request.payload": "{\n \"desiredCapabilities\": {\n \"browserName\": \"chrome\"\n },\n \"capabilities\": {\n \"firstMatch\": [\n {\n \"browserName\": \"chrome\"\n }\n ]\n }\n}" 10 } 11} 116:34:34.132 INFO [LoggingOptions$1.lambda$export$0] - { 2 "traceId": "a9a9a87f0be04eec6ca4fed26b77274f", 3 "spanId": "8f55a7dbdff8f03a", 4 "spanKind": "INTERNAL", 5 "eventTime": 1605179074130876199, 6 "eventName": "Added session into local session map", 7 "attributes": { 8 "logger": "org.openqa.selenium.grid.sessionmap.local.LocalSessionMap", 9 "session.id": "49da51d92257d7466dd178341403b87e" 10 } 11}
Tracing
Earlier applications were monolithic in nature and all components were tightly coupled. It was easier to trace a request. But in the advent of microservices architecture, a single request or transaction spans multiple services and components. Hence tracing becomes crucial. Tracing tracks the request lifecycle as each service executes the request. It is useful in debugging in an error scenario. Some key terms used in tracing context are:
Trace
Tracing allows tracing a request through multiple services, starting from its origin to its final destination. This request's journey helps in debugging, monitoring the end-to-end flow and identifying failures. A trace depicts the end-to-end request flow. Since each request is unique, each trace is unique. To identify a trace a unique trace id is used.
Span
Each trace is made up of timed operations called spans. A span has a start and end time and it represents operations done by a service. The length of the span depends on the operation length. Each span has a unique identifier. All spans within a trace share the same trace id.
Span Attributes
Span attributes are key-value pairs which provide additional information about each span.
Events
Events are timed-stamped logs within a span. They provide additional context to the existing spans. Events also contain key-value pairs as event attributes.
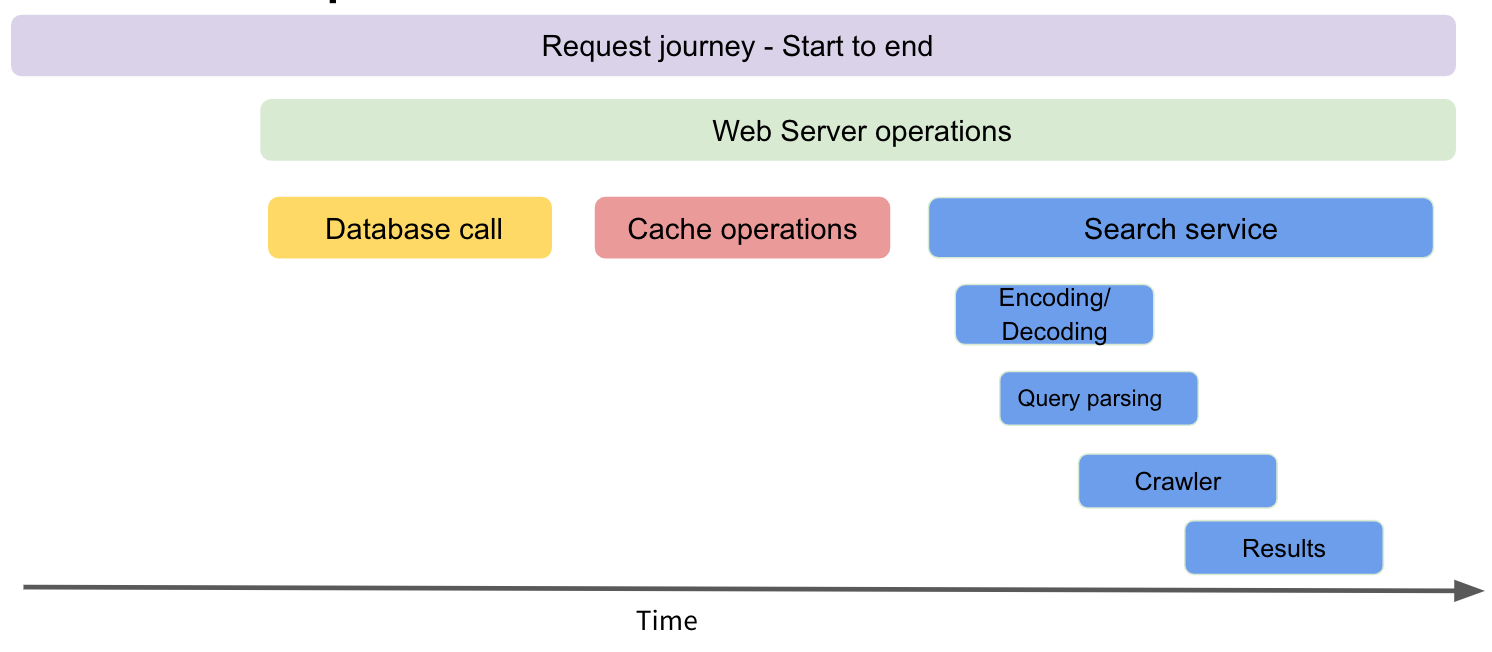
In the image above, the entire request journey is a trace. A request will do important operations along the way like a database call, store information in a cache and then search a query. These operations are spans. Making a trace collection of spans.
Within each operation, there might nested operations (child spans). The search service will have child spans for encoding/decoding step and query parsing.
For each span, span attributes containing the context can be added. For a database call, one can record the database name, host and port, database query and the result. If the result failed, the event can capture the time of the error along with error details.
Observability Pipeline
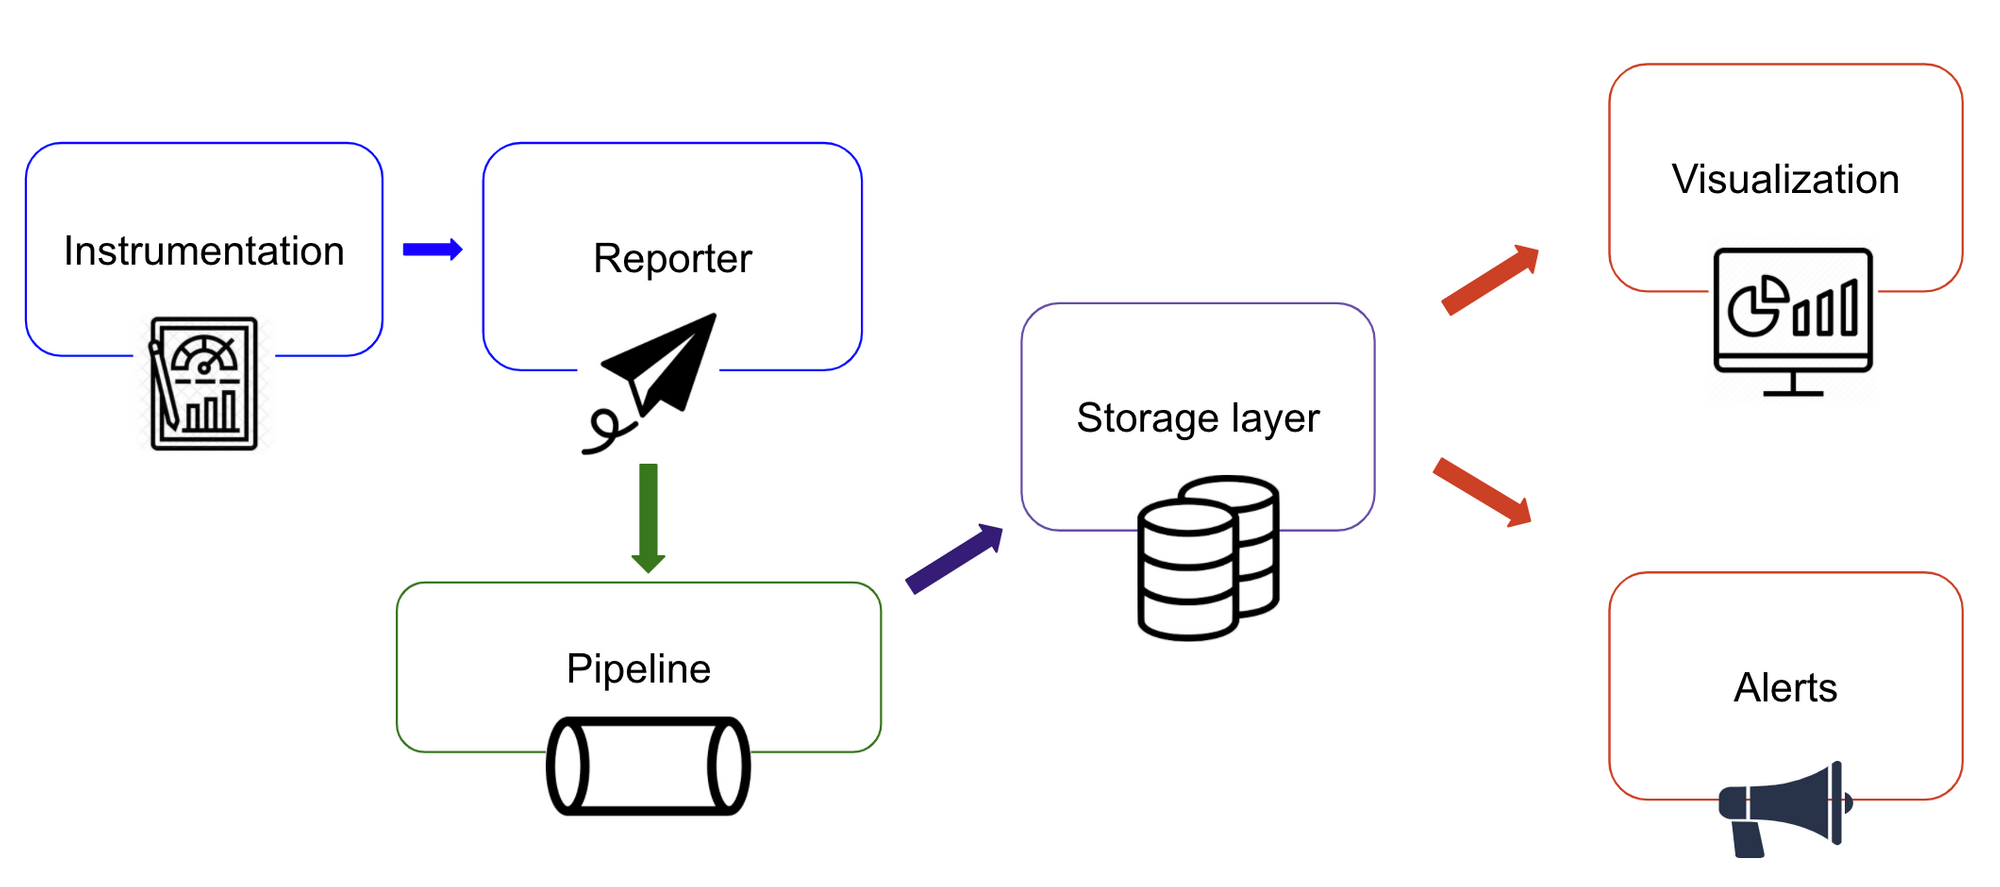
So far, we have covered the instrumentation part of the observability workflow. Making a system observable by instrumenting code is not enough to reap the benefits. Additional components are required as follows:
- Reporter - Suppose the metrics are recorded every millisecond but we want it reported every second. Then the data collected has to be aggregated and flushed out of the system. This work is done by the reporter. The reporter can also flush out and write logs and traces. Reporter prevents the filling up the memory with metrics data.
- Pipeline - Think of the pipeline as the staging area for the metrics. A pipeline would typically have the producer(reporter) and a consumer (something that writes to the database). Both the producer and the consumer would be independent of each other. One might think that reporter can directly write to the database, but this will not scale well in an error scenario. Consider a scenario where the database is handling heavy-weight queries and as a result, the data ingestion is slow or paused. At this time, the mechanisms for retries and back-pressure can be implemented while consuming from the pipeline. The pipeline is capable of storing high volume data for a longer duration. The reporter storing high volume metrics will impact the service and result in out-of-memory exceptions.
Storage - This includes :
- A database specialized in storing time-series database for metrics
- A storage mechanism specialized in indexing and searching logs.
- A storage mechanism specialized in correlating traces and allowing search on traces.
- Visualization - This includes visualization tools for metrics to create dashboards for various scenarios is a must and trace visualization tools for correlating traces along a timeline.
- Alerting - A component that allows setting thresholds for metrics and fires alerts to various channels of communication.
Selenium Observability
Selenium 4.0.0 Alpha 7 Grid leverages OpenTelemetry to instrument traces and event-logs. Every new request has its own trace and important operations in the workflow are covered using spans and events.
The traces can be visualized using Jaeger. OpenTelemetry provides the APIs and SDKs to instrument traces in the code. Whereas Jaeger is a tracing backend, that aids in collecting the tracing telemetry data and providing querying, filtering and visualizing features for the data. Jaeger can be easily configured with Grid to visualize traces.
Traces and event-logs will allow Selenium Grid users to identify how well the requests are performing on their infrastructure. This aids in identifying potential bottlenecks and performance improvement.
Refer to Selenium Grid Observability.
Popular Tools
A plethora of tools and resources available of tools and resources are available to get started with observability or to enhance existing observability stack. Some of the popular tools are listed below. Most of them have good resources to understand and implement observability.
References
All my understanding of observability stems majorly from the resources enlisted below. Big thanks to the authors of the following docs.
- https://metrics.dropwizard.io/4.1.2/manual/core.html
- https://prometheus.io/docs/concepts/metric_types/#:~:text=A%20gauge%20is%20a%20metric,the%20number%20of%20concurrent%20requests.
- https://www.honeycomb.io/blog/you-could-have-invented-structured-logging/
- https://www.honeycomb.io/blog/how-are-structured-logs-different-from-events/
- https://opentelemetry.io/docs/
- https://lightstep.com/distributed-tracing/
- https://github.com/open-telemetry/opentelemetry-specification/blob/master/specification/trace/semantic_conventions/http.md
- SeleniumHQ/selenium
- https://www.youtube.com/watch?v=czes-oa0yik
- The Selenium Browser Automation Project :: Documentation for Selenium