Debugging is an essential part of developing JavaScript-based programs. It helps to identify and fix bugs.
However, many new developers face roadblocks when it comes to debugging JavaScript-based programs in Chrome.
Overview
How to Debug JavaScript in Chrome?
- Add Breakpoints: Pause code execution at specific lines to inspect behavior.
- View/Make Changes to Local, Closure, and Global Properties: Inspect and modify variable values in different scopes.
- Create, Save and Run Snippets: Write and execute reusable code snippets directly in DevTools.
- View the Call Stack: Trace the sequence of function calls leading to the current point.
- Blackboxing: Exclude library scripts from debugging to focus on your code.
- Using Conditional Breakpoints and the Watch Panel: Set breakpoints with conditions and monitor variables in real time.
This article talks about how to debug JavaScript in Chrome with practical techniques and tools to streamline development and resolve issues efficiently
What Is Chrome DevTools?
Chrome DevTools is an integrated set of web development tools built directly into the Google Chrome browser. It allows developers to inspect, debug, and analyze web applications in real-time.
Key features include:
- Elements Panel: Inspect and modify the DOM and CSS.
- Console Panel: View messages, run JavaScript, and interact with the page.
- Sources Panel: Debug JavaScript, set breakpoints, and step through code.
- Network Panel: Monitor network requests and performance.
- Performance Panel: Analyze runtime performance.
- Memory Panel: Profile memory usage and detect leaks.
- Application Panel: Inspect storage, service workers, and other resources.
- Security Panel: Review security aspects like HTTPS and certificates.
Note: It’s important to learn some keyboard shortcuts of DevTools like :
- To open DevTools Elements, press “Command + Option + C” (Mac) or CTRL + Shift + C (Other OS)
- To open the DevTools Console panel, press Command + Option + J (Mac) or CTRL + Shift + J (Other OS).
Also Read: How to Perform Mobile Browser Debugging
How To Access The Debugger In Chrome
Accessing the debugger in Chrome is essential for quickly identifying and fixing JavaScript issues. Chrome DevTools offers a robust environment for inspecting code, setting breakpoints, and monitoring execution.
Here are simple ways to open the debugger:
- Keyboard Shortcut: Press F12 or Ctrl + Shift + I (Cmd + Option + I on Mac) and go to the Sources tab.
- Right-Click Inspect: Right-click on the page, select Inspect, then open the Sources tab.
- Chrome Menu: Click the three dots at the top-right, navigate to More Tools > Developer Tools, and select Sources.
Inside the Sources tab, scripts can be viewed, breakpoints set, and code execution paused or stepped through for detailed debugging.
Also Read: How to debug Angular App in Chrome
How to Debug JavaScript in Chrome?
Debugging JavaScript in Chrome is streamlined using Chrome DevTools, a robust set of features designed to identify and fix issues quickly.
Start by opening the DevTools panel (press F12 or Ctrl + Shift + I) and navigating to the Sources tab. You can set breakpoints, step through your code, and inspect variables in real time.
A typical debugging workflow includes:
- Setting breakpoints to pause code execution at specific lines
- Stepping through code to monitor behavior line-by-line
- Inspecting variables and call stacks to understand program state
- Using conditional breakpoints and watch expressions for precise control
Mastering these techniques allows you to quickly locate errors, optimize your code, and improve application performance.
The sections below cover these methods in detail:
1. Add Breakpoints
The main purpose of adding Breakpoints is to pause the code. It helps developers to test each line of code and resume whenever the process is done. For large JavaScript programs, breakpoints prove useful in identifying bugs.
The main purpose of adding Breakpoints is to pause the code. It helps developers to test each line of code and resume whenever the process is done. For large JavaScript programs, breakpoints prove useful in identifying bugs.
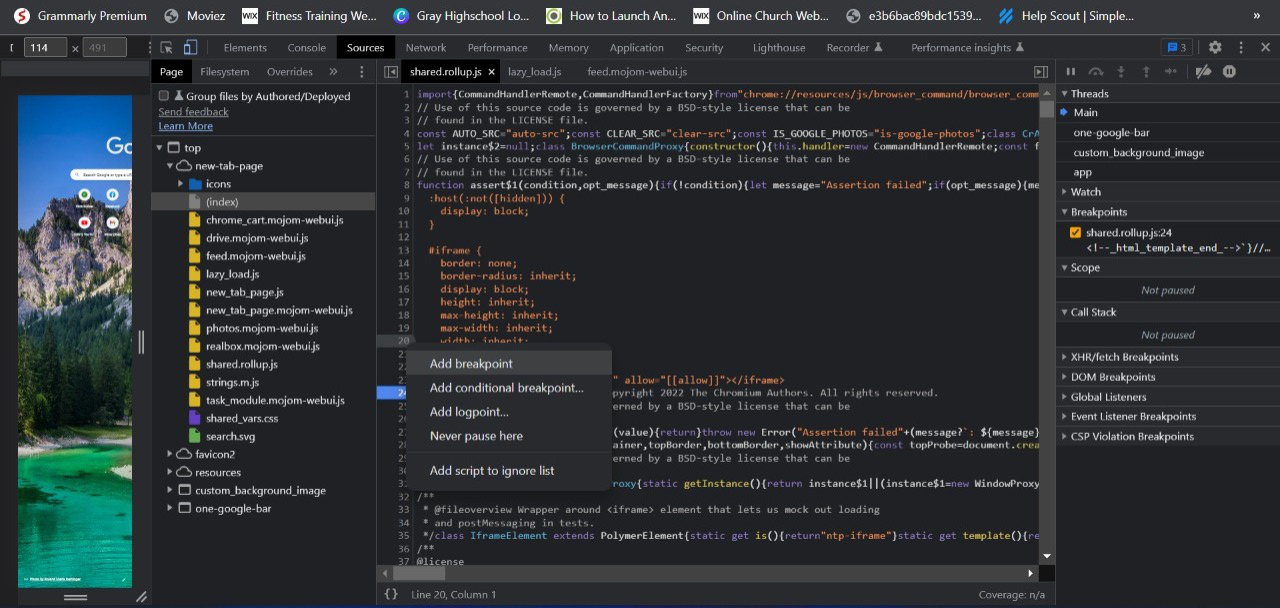
Here’s the process of adding a Breakpoint with an example:
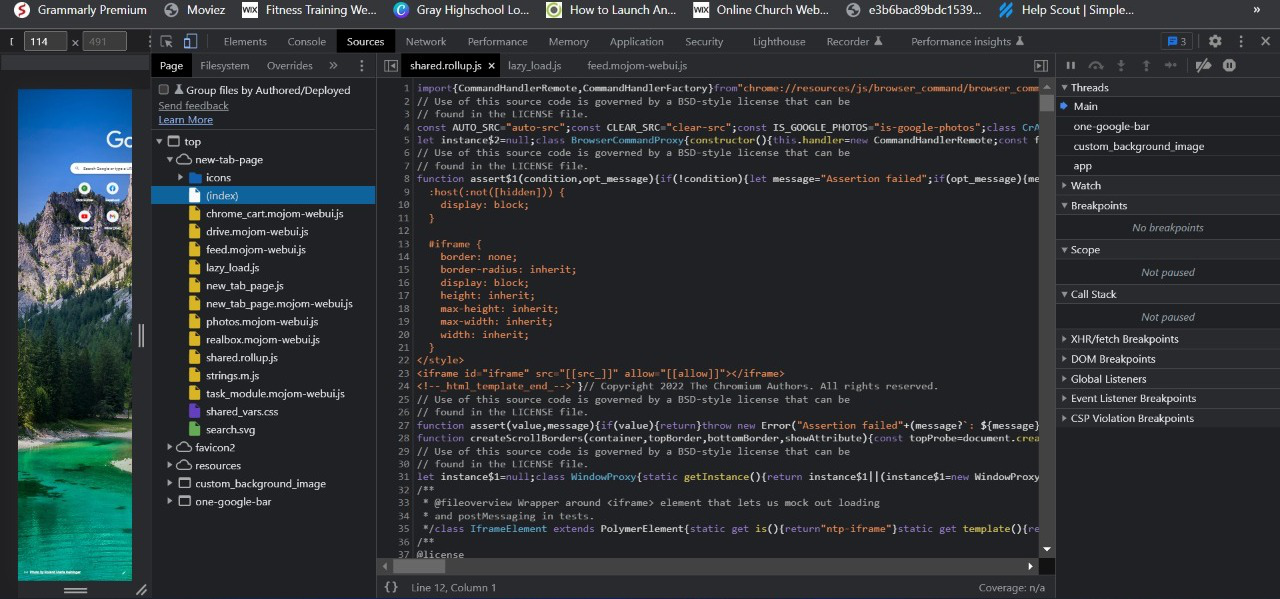
On the DevTools Sources Panel, click on the left navigation panel and select the .js file to open the lines of code to add a breakpoint.
Right-click on the line where you want to add a breakpoint and select “Add Breakpoint.”
Hence after adding a breakpoint, when the code runs then, it pauses at the breakpoint.
2. View/Make Changes to Local, Closure, and Global Properties
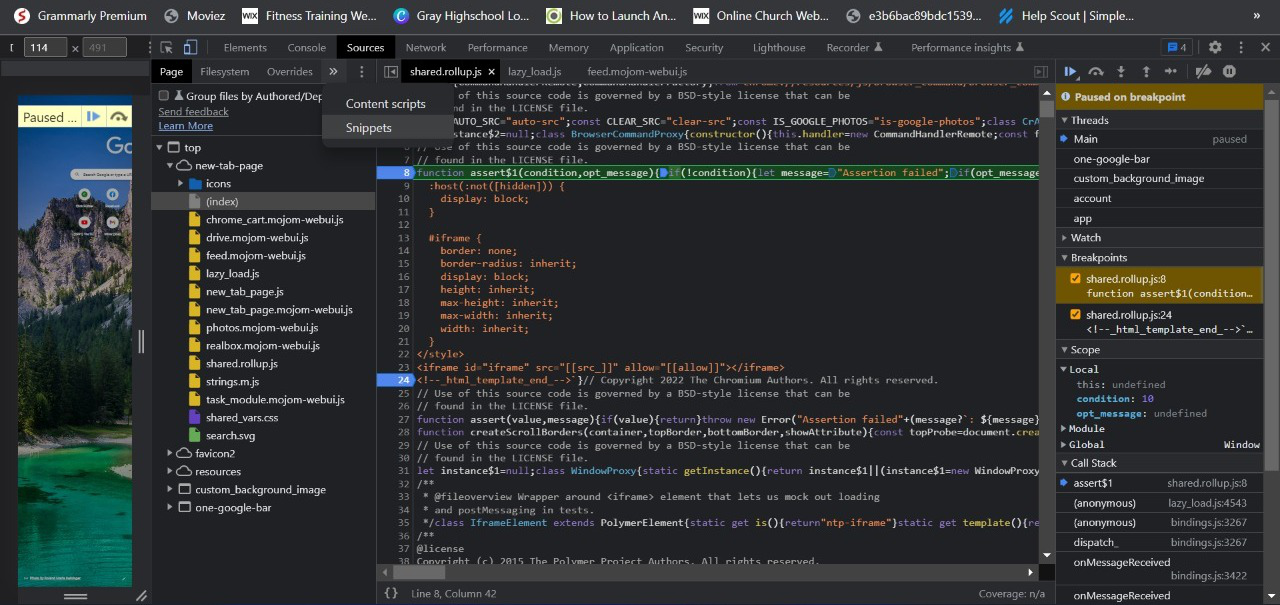
Once you’ve paused the code by adding Breakpoints, it’s time to view & edit the local, closure, and global properties. In this step, you can test the functionalities and see whether the output is satisfactory or needs further editing. With Breakpoints, it’s easier to run the specific portion of code to check functions.
By clicking the “Scope” panel, a panel opens that displays useful information to fix bugs.
Read More: Breakpoints for Responsive Web Design
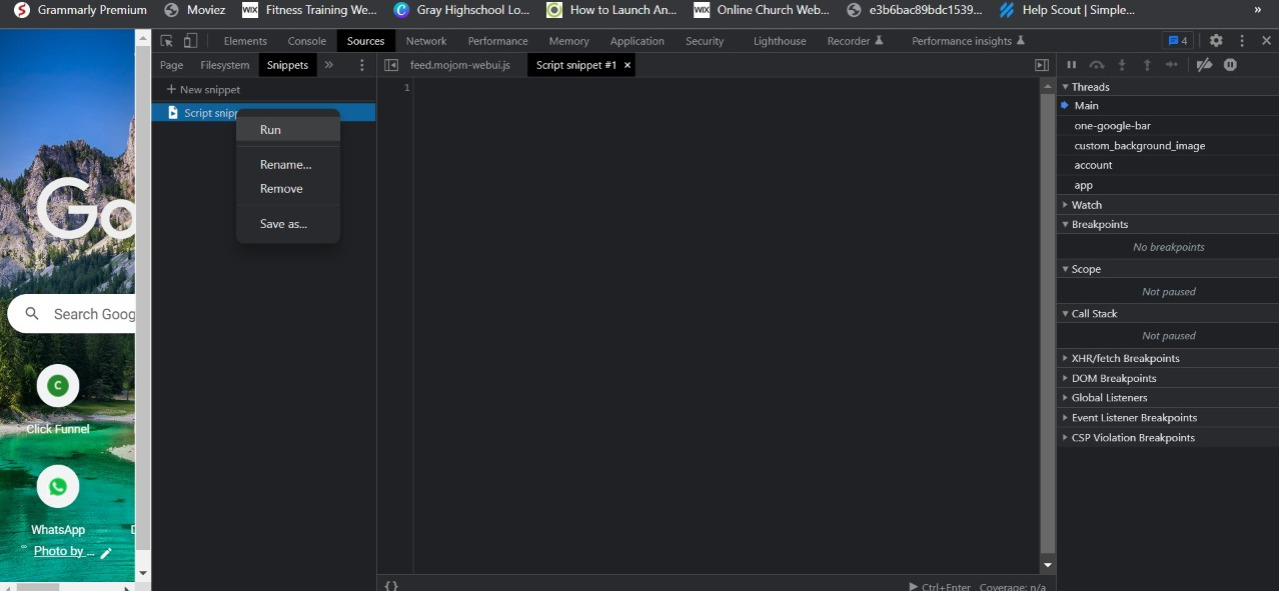
3. Create, Save and Run Snippets
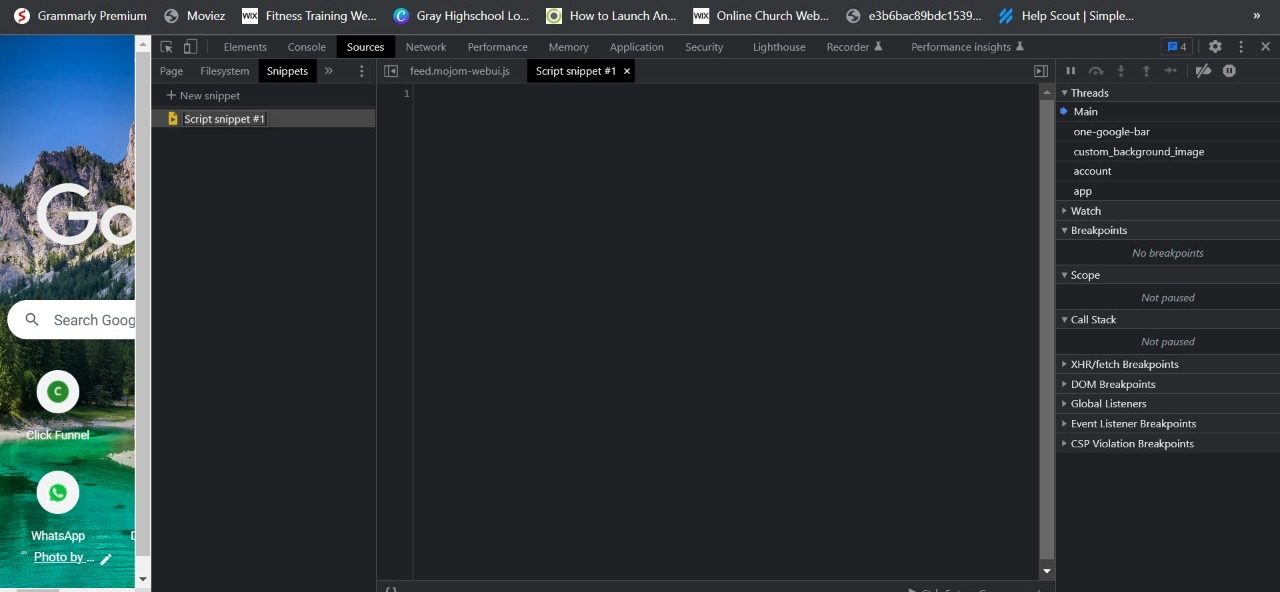
Now, you can use Snippets that help to create, save and run scripts in any part. To add a snippet, click on the Snippets menu on the left panel.
Click “+ New Snippet” and write the code in the middle panel.
To save the snippet, press Command + S (Mac) & Ctrl + S (other OS).
To run the snippet, click “Run” and press Command + Enter (Mac) or Ctrl + Enter (other OS)
4. View the Call Stack
With Chrome DevTools, you can view the call stack. It’s mainly used for those JavaScript programs that have many asynchronous functions and show errors.
While debugging a large program, the call stack is a great option that helps to see the program’s functions and makes it easy to identify the errors from which function.
By clicking the “Source” Panel, you can open the Call Stack to see the functions.
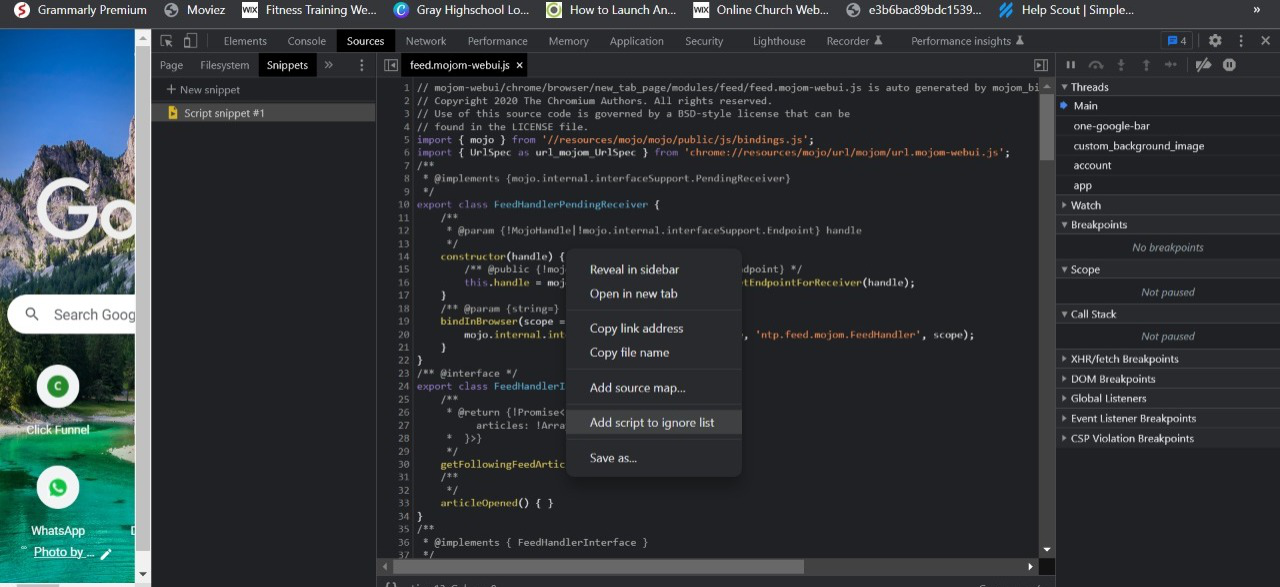
5. Blackboxing
When debugging the javascript program, some scripts work without showing any error and must be ignored for debugging. This is where Blackboxing comes in, which helps you ignore these specific scripts from debugging. Without Blackboxing, it’s hectic to comment out each line of code.
To use Blackboxing, select the script file you want to ignore.
- Now, click on the left panel in the Source Tab and right-click on the middle panel to “Add script to ignore list.”
- Once you use Blackboxing to add a particular script to the ignore list, then you can debug to identify & resolve errors.
With Chrome DevTools, debugging JS in Chrome becomes an easier process.
6. Using Conditional Breakpoints and the Watch Panel
Conditional breakpoints allow code to pause only when specific conditions are met, reducing noise during debugging. The Watch panel lets you monitor variables or expressions over time.
Setting Conditional Breakpoints:
- Right-click on the line number in the Sources panel.
- Choose Add conditional breakpoint
- Enter a condition like user.isLoggedIn === true.
Using the Watch Panel:
- Navigate to the right sidebar and open the “Watch” section.
- Click + Add expression and enter a variable or statement.
- It will auto-update as you step through your code.
This approach is beneficial when dealing with loops or deeply nested conditions.
Integrating Chrome DevTools with VS Code
You can debug JavaScript in Chrome directly from Visual Studio Code using the Debugger for Chrome extension.
Setup Steps:
1. Install the “Debugger for Chrome” extension from the VS Code marketplace.
2. Create a launch.json file in your .vscode folder.
3. Add a configuration like:
{

  "type": "chrome",

  "request": "launch",

  "name": "Launch Chrome",

  "url": "http://localhost:3000",

  "webRoot": "${workspaceFolder}"

}
4. Start debugging with F5. VS Code will launch Chrome and attach the debugger, enabling you to place breakpoints within the editor.
Real-World Debugging Scenarios
Here are a few practical examples to demonstrate effective JavaScript debugging in Chrome:
Scenario 1: Unresponsive Button Click
- Use the Elements tab to ensure the button exists and is visible.
- Set a breakpoint inside the click handler.
- Use the Console to verify event listeners are attached.
Scenario 2: API Call Fails Without Message
- Open the Network tab and inspect the failed request.
- Use the Preview and Response tabs for error messages.
- Set breakpoints where the fetch/axios call is handled to trace logic errors.
Scenario 3: Dynamic UI Not Rendering
- Set a breakpoint where the DOM is being updated.
- Use the Call Stack to backtrack what triggered the render.
- Monitor variables using the Scope and Watch panels.
Some Common Errors of JavaScript with Solutions
JavaScript errors can often be traced to common patterns, DOM issues, syntax mistakes, or browser inconsistencies.
Common Errors of JavaScript:
- DOM-related Errors: Incorrect DOM access or manipulation.
- Cross-Browser Compatibility Issues: Code behaves inconsistently across browsers.
- Syntax-based Errors: Code syntax mistakes blocking execution.
- Reference Errors: Using undeclared or out-of-scope variables.
- Type Errors: Calling non-function values as functions.
- Async/Await Errors: Missing error handling causing promise failures.
- Logical Errors: Faulty logic causing wrong behavior.
- Memory Leaks: Unreleased resources causing performance drops.
Below are real-world examples of these errors, what causes them, and how to fix them effectively.
1. DOM-related Errors
DOM is also known as the Document Object Model. It plays a major role in JavaScript-based website interfaces. It handles the interface to make the website user-friendly, interactive, and mobile responsive. Whenever developers build JavaScript-based programs, DOM is the most common error every developer should work on.
Read More: How to find Bugs on your Website
Understand with an example:
If the code below runs on the Chrome browser, it shows an error that counts as DOM error. This error shows because the Chrome browser isn’t aware of the <div> element.
<!DOCTYPE html>
<html>
<body>
<script>
document.getElementById("container").innerHTML = "Common JS Bugs and Errors";
</script>
<div id="container"></div>
</body>
</html>
Now, this error can be easily resolved by adding <div id=”container”></div> in the beginning of the script.
It seems like
<!DOCTYPE html>
<html>
<body>
<div id="container"></div>
<script>
document.getElementById("container").innerHTML = "Common JS Bugs and Errors";
</script>
</body>
</html>
Now, the code can run successfully!
2. Cross-Browser Compatibility Issues
Cross-browser compatibility issues are a major one that developers face while working on a JavaScript-based website or web app. These JavaScript-based websites may not be compatible with different web browsers, so resolving this issue is essential.
Here are some common cross-browser errors that occur in JavaScript:
- Modern JavaScript features on Old browsers: When developers build JavaScript-based programs with modern features, the program may not support older browser versions.
- Browser Sniffing: Browser sniffing is also known as Browser Detection. In this process, whenever visitors come to the website from any browser, a code is executed to run the program that supports the particular browser. However, the code might not execute properly on different browsers.
- Using Libraries: When developers build any JavaScript program, then some native & third-party libraries are not supported on different browsers.
Solution
BrowserStack Live is a cloud-based testing infrastructure where QA testers can access a robust testing environment along with a real device cloud of 3500+ real devices and browsers with different versions.
Teams can access quick & accurate reports so that developers can quickly identify & resolve bugs. Just create a free account in BrowserStack, choose any device or browser, and start testing on different browsers and versions.
Debug JS in Chrome with BrowserStack
3. Syntax-based Errors
It’s very common to see syntax errors in hundreds of lines of code where errors occur, like missing parentheses, unmatched brackets, or syntax faults. Developers need to resolve this issue.
To resolve this issue, developers should follow the standard syntax to reduce the chances of getting errors.
Understand with an example:
When you run the code given below:
if((x > y) && (y < 80) {
//more code here
}
Then, you can notice a parenthesis missing that shows an error.
The correct the syntax should be:
if ((x > y) && (y < 80)) {

        //more code here

    }
Now, the code can run successfully without showing any syntax errors.
These are some of the most common JavaScript errors developers face while working on the JavaScript program.
Follow-up Read: 5 Tests You Must Run Before Launching A Website
4. Reference Errors
Error:
Uncaught ReferenceError: myVariable is not defined
Cause: Trying to use a variable before it is declared or outside its scope.
Problematic Code:
console.log(userName);

let userName = 'Alice';
Solution: Declare variables before use, or use var carefully with hoisting in mind:
let userName = 'Alice';

console.log(userName);
5. Type Errors
Error:
Uncaught TypeError: myFunction is not a function
Cause: Calling something as a function which is not a function.
Problematic Code:
const data = { name: 'Bob' };

data();Solution: Ensure the variable is a function before calling:
const data = function() { console.log('Hello'); };

data();
Or check the type before invocation:
if (typeof data === 'function') {

  data();

}6. Async/Await Errors (Unhandled Promise Rejections)
Error:
Uncaught (in promise) TypeError: Cannot read property 'value' of undefined
Cause: Accessing properties on unresolved or rejected promises, or missing error handling in async functions.
Problematic Code:
async function fetchData() {

  const response = await fetch('invalid-url');

  const data = await response.json();

  console.log(data.value);

}


fetchData();Solution: Add error handling with try-catch blocks in async functions:
async function fetchData() {

  try {

    const response = await fetch('invalid-url');

    if (!response.ok) throw new Error('Network response was not ok');

    const data = await response.json();

    console.log(data.value);

  } catch (error) {

    console.error('Fetch error:', error);

  }

}


fetchData();
Learn More: Synchronous vs Asynchronous in JavaScript
7. Logical Errors
These errors do not throw exceptions but cause incorrect behavior due to flawed logic.
Example: Incorrect condition causing unintended execution.
Problematic Code:
if (user.isAdmin = true) {

  grantAccess();

}Cause: Assignment operator used instead of equality comparison.
Solution: Use strict equality operators (===):
if (user.isAdmin === true) {

  grantAccess();

}
8. Memory Leaks
Error: Application performance degrades over time without explicit error messages.
Cause: Variables or event listeners not properly cleaned up, causing excessive memory consumption.
Problematic Code:
function startTimer() {

  setInterval(() => {

    console.log('Timer running');

  }, 1000);

}

startTimer();
If startTimer() is called repeatedly without clearing intervals, memory will leak.
Solution: Clear intervals or detach listeners when no longer needed:
let timerId;

function startTimer() {

  timerId = setInterval(() => {

    console.log('Timer running');

  }, 1000);

}

function stopTimer() {

  clearInterval(timerId);

}

startTimer();

// Later call stopTimer() when needed
Testing on Real Devices With BrowserStack
Testing your JavaScript on real devices ensures consistent behavior across browsers, operating systems, and screen sizes.
Use BrowserStack Live to debug JavaScript in Chrome across real Android and iOS devices:
- Sign up for a free account at BrowserStack.
- Navigate to Live testing.
- Select a real device (e.g., iPhone 14, Samsung Galaxy S23) and open Chrome.
- Use DevTools directly within the live session to inspect and debug your code.
Benefits of Testing on Real Device Cloud with BrowserStack:
- Access to diverse real devices without the need for physical hardware.
- Accurate representation of user environments, reducing platform-specific issues.
- Ability to debug in real-time with full DevTools functionality.
- Faster identification and resolution of device-specific JavaScript bugs.
Conclusion
Mastering how to debug JavaScript in Chrome is essential for building stable, responsive web applications.
With features like breakpoints, the Watch panel, and integration with editors like VS Code, Chrome DevTools offers everything developers need to track down and resolve issues effectively.
By combining these tools with real device testing on platforms like BrowserStack, teams can ensure their code performs flawlessly in real user environments.

