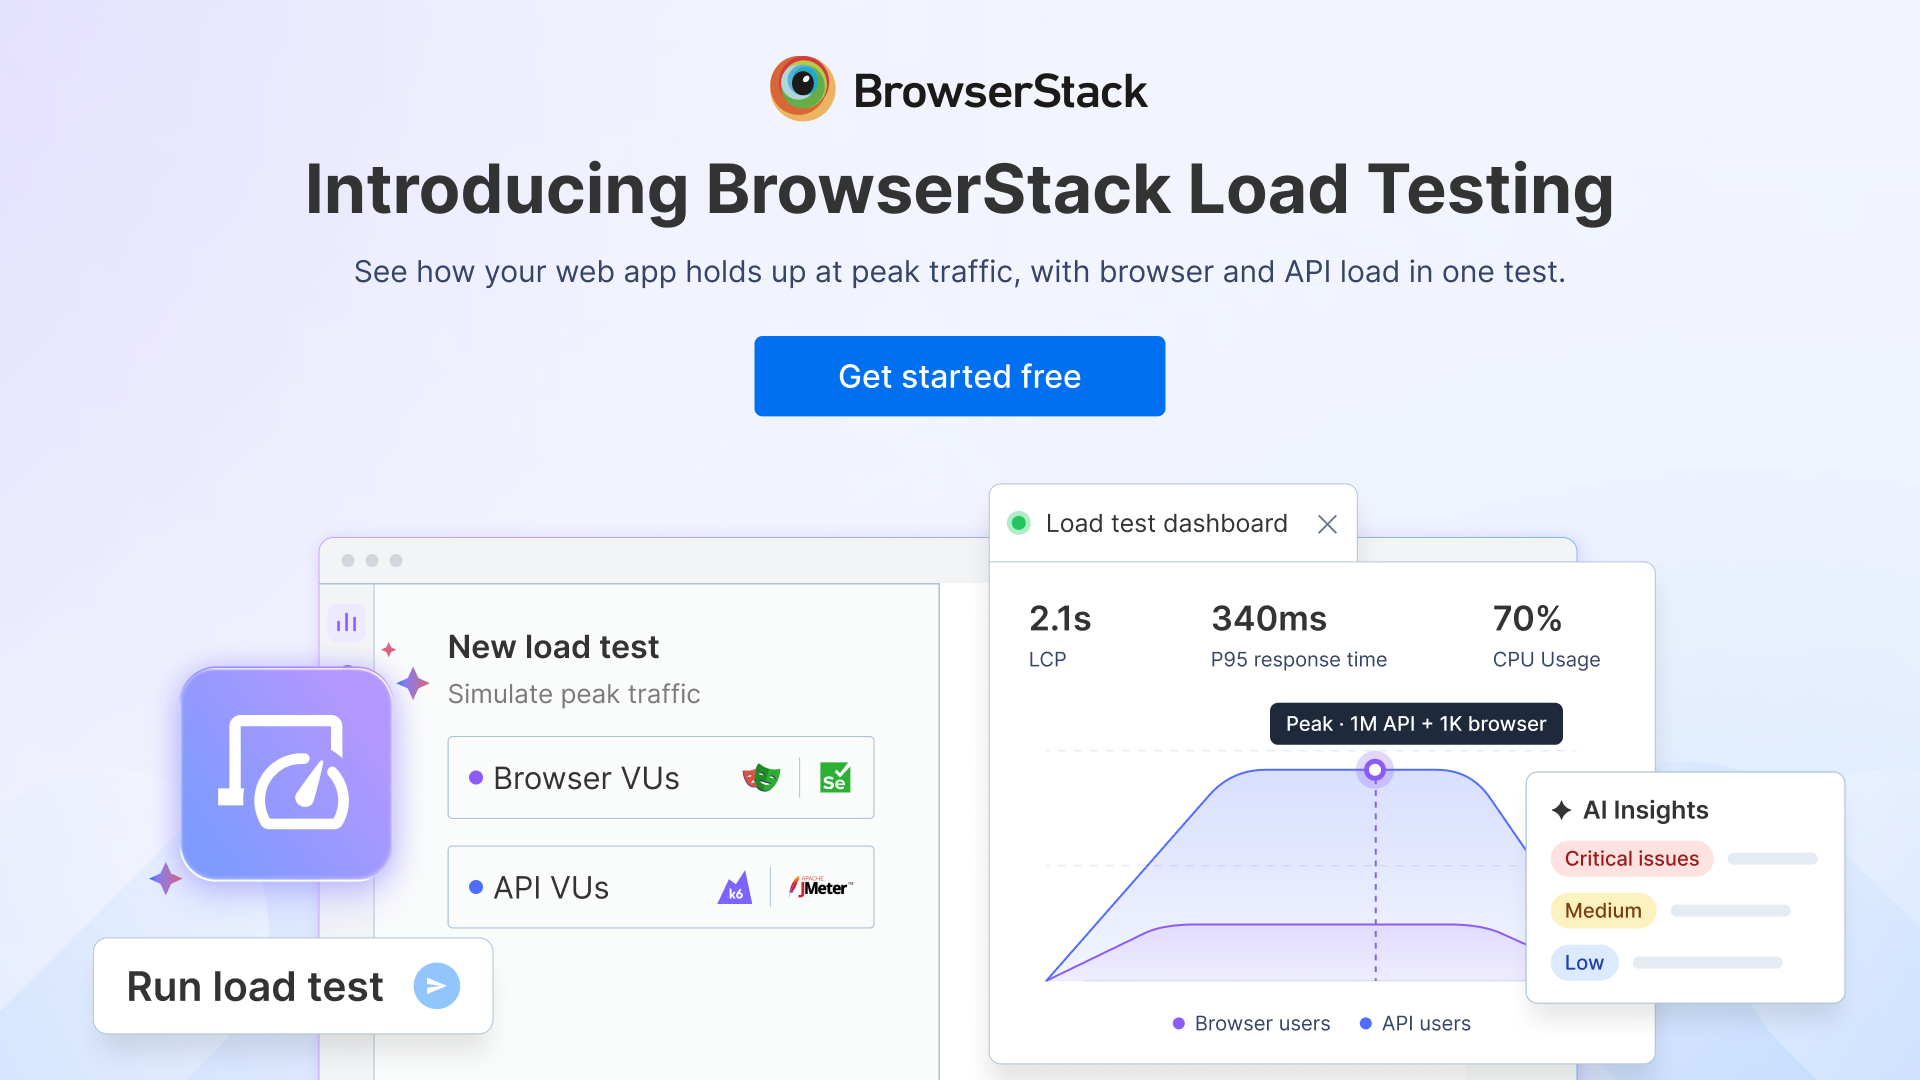
Every team that runs a busy website knows the feeling before a big sale or launch. The load test has passed, the dashboards look fine, and still nobody is fully sure the site will hold up. Too often, the real answer arrives on the day itself, from customers.
Today we're launching BrowserStack Load Testing, now generally available, to give teams that answer weeks earlier.
Why Load Testing Needed A Rethink
For years, load tests have worked at the protocol level. A tool sends thousands of requests to an application's servers and measures how quickly they reply. That made sense when the server sent back a finished page.
Modern web apps work differently. Much of each page is now put together inside the visitor's browser, which runs JavaScript, calls other services and renders the content. Under heavy traffic, that is often where things slow down, and a protocol-level test never sees it. So a site can pass its load test while customers sit waiting for the checkout page to load.
On the busiest days, that wait is expensive. During peak hours on Black Friday 2025, U.S. shoppers spent $12.5 million online every minute, according to Adobe Analytics.
Meet BrowserStack Load Testing
BrowserStack Load Testing runs real browsers and API traffic in the same test. You can run up to 1 million API virtual users against your backend while up to 1,000 browser virtual users load and click through your pages, from multiple regions, on fully managed cloud infrastructure. Server response times, page load times and Core Web Vitals appear together on one dashboard, so you can see where performance breaks and how it affects the people using your site.
You also don't need to start from zero. The tests you already have can become load tests.
How It Works: Three Real Scenarios
Scenario 1: Getting ready for a sale day
Your team expects a traffic spike during the festive sale. You set up a single test with two parts: API load that ramps up to your expected peak, and a group of browsers running your checkout flow at the same time.
As the test runs, you watch API response times and checkout page load times side by side. If the APIs hold steady but the page slows down past a certain number of users, you know where to look, weeks before the sale begins.

Scenario 2: Reusing the scripts you already have
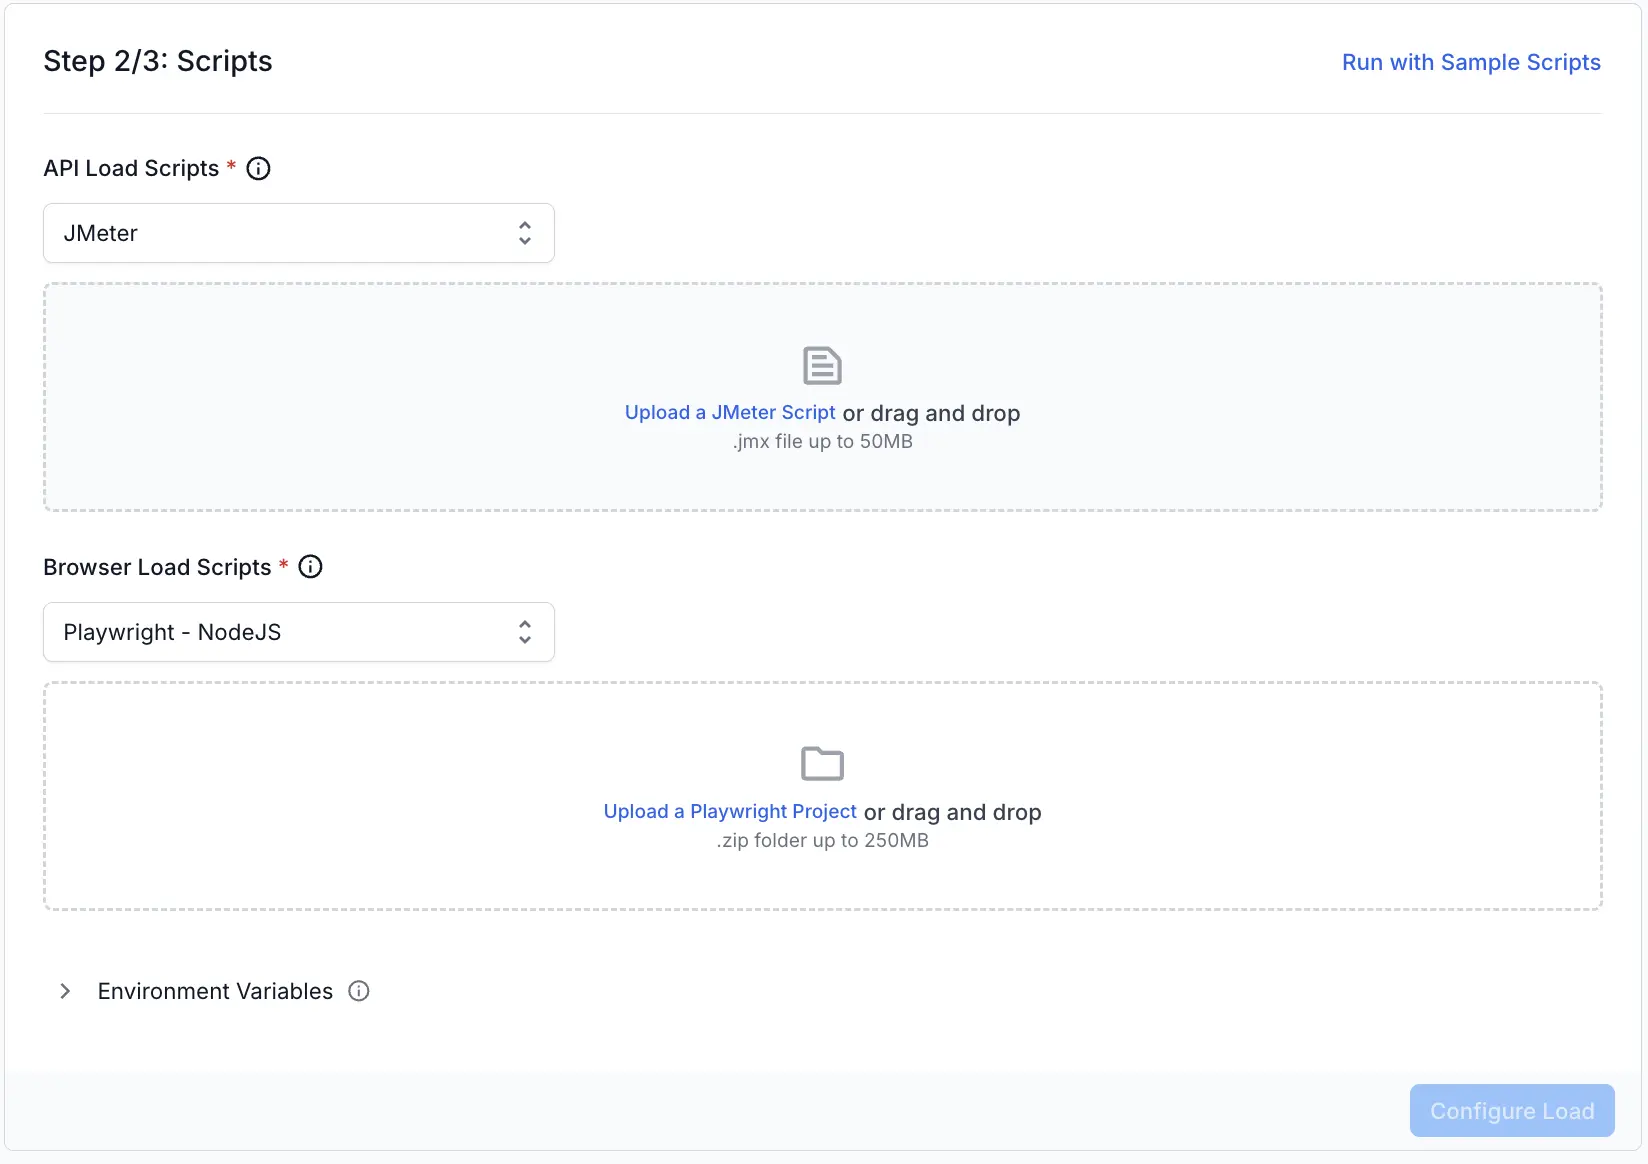
Your automation team has a Playwright suite for the main user journeys, and your performance engineers maintain JMeter scripts for the APIs. With BrowserStack Load Testing, you upload both and run them as they are. The Playwright tests become browser load, the JMeter scripts become API load, and nobody has to rewrite anything in a new format.
If you're moving off NeoLoad or LoadRunner, an AI migration agent converts those scripts for you, with BrowserStack Customer Engineers available to help.
Scenario 3: Finding the cause of a slowdown
A test shows error rates climbing as traffic peaks. Instead of digging through logs in several tools, you open AI Insights. It reads the test logs alongside your frontend and backend metrics, flags anomalies and points to the likely cause, with a severity rating and a suggested fix. If you've connected an APM tool such as Datadog or New Relic, that data sits in the same view, so you can trace the problem to a specific service.

What you get on day one
- Browsers and API load in one test: Run up to 1 million API virtual users and 1,000 browser virtual users per test, from multiple regions, on fully managed infrastructure. There are no load generators to set up or maintain.
- Use the tests you already have: Bring your Playwright, Selenium, WebdriverIO or Nightwatch tests for browser load, and your JMeter, k6, Gatling or Locust scripts for API load. If you don't have scripts yet, record a user journey with the low-code recorder.

- Frontend, backend and APM metrics in one view: Core Web Vitals, server response times and APM data from tools like Datadog and New Relic sit on one dashboard, with reports you can share with your team. You can also run tests from Jenkins, GitHub Actions or GitLab and set thresholds that catch performance regressions before release.
- AI agents across the workflow: AI Insights finds the likely root cause of a slowdown, rates its severity and suggests a fix. The AI migration agent moves your NeoLoad and LoadRunner tests over. Natural language scripting and an MCP server are coming soon.
Getting started
- Get started for free at browserstack.com/load-testing
- Create a load test by uploading your existing scripts or recording a user journey
- Set your load profile: number of users, ramp-up, duration and regions
- Run the test and review browser and API results side by side
Holiday and festive sales are only weeks away. It's a good time to find out how your site holds up before your customers do.

