In our previous post, we explored the industry-wide challenge of issue over-reporting; how automated site scans often report thousands of violations, overwhelming QA and engineering teams and creating a heavy administrative burden. The triage fatigue caused by multi-queue workflows and scattered context makes it difficult to identify, prioritize, and fix relevant accessibility issues.
The Table View in the Accessibility Reporting Dashboard.
We’ve completely overhauled the reporting experience to eliminate issue bloat, consolidate your workflows, and reduce the time it takes to triage accessibility violations.
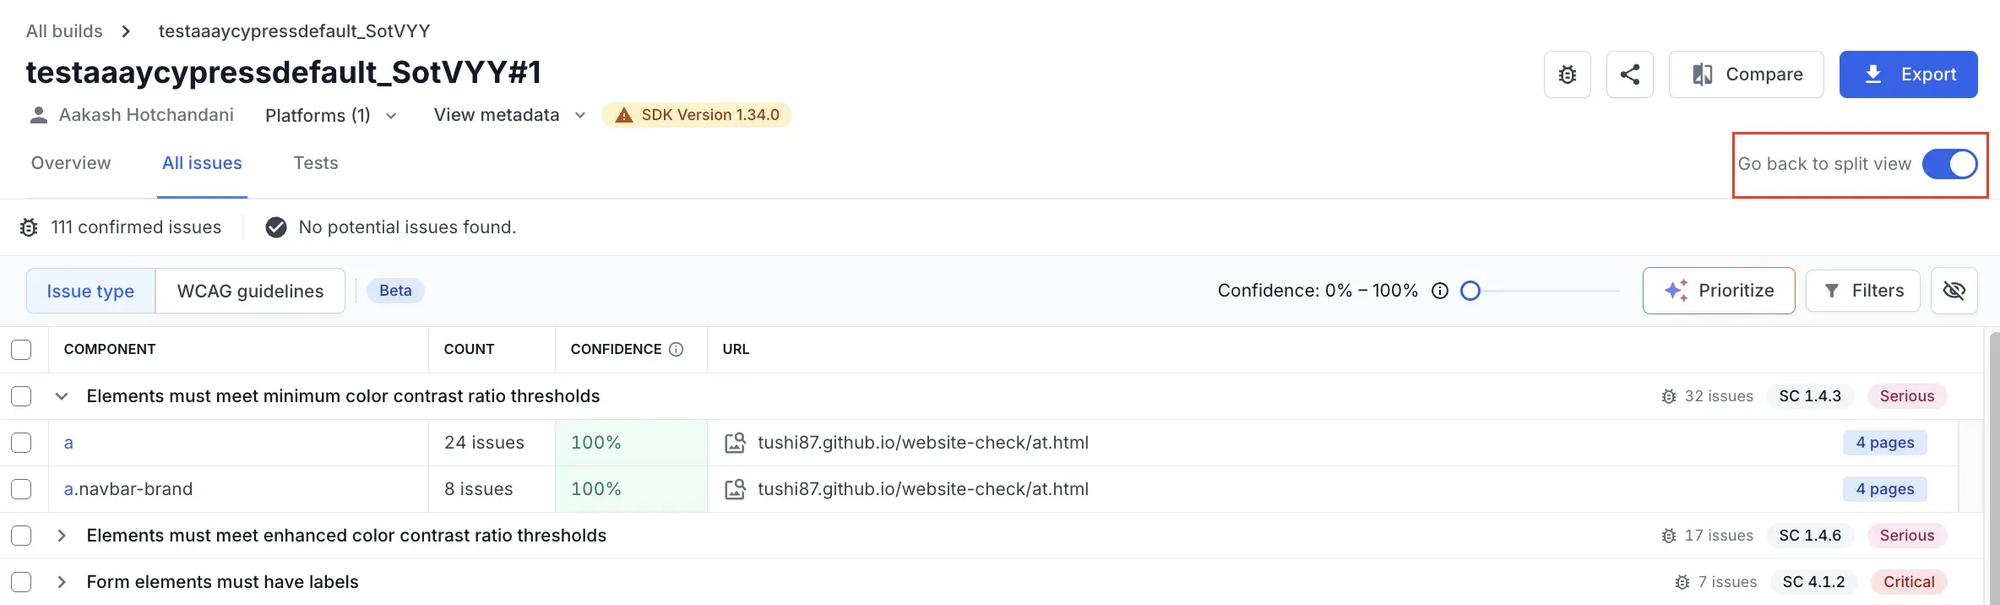
Here’s a deep dive into the core capabilities of the new Table View and how it accelerates your fix-vs-investigate decision-making.
1. Component-level aggregation
Scanners often flag the same issue across hundreds of pages. If a navigation header has an accessibility issue, you don't need to see 1,200 individual page violations, you need to know the component is broken.
The new Table View groups repetitive violations by components. By condensing thousands of site-wide issues into roughly 15-20 distinct component line items, teams can address issues directly at the source. This reduces triage effort and gives developers a clear, actionable list.
2. Unified view with confidence scores
We had introduced a Confirmed vs Potential segregation of issues in our previous iteration. However, for some customers, separating unconfirmed violations into a standalone "Potential Issues" queue added mental overhead, making reviews feel like an administrative chore. We’ve eliminated the multi-queue workflow.
The Table View merges all findings into a single, consolidated list. To help you prioritize, we’ve introduced inline confidence scores and advanced filtering. This transparent confidence indicator allows teams to instantly zero in on high-confidence violations without switching context or workflows.
3. At-a-glance context
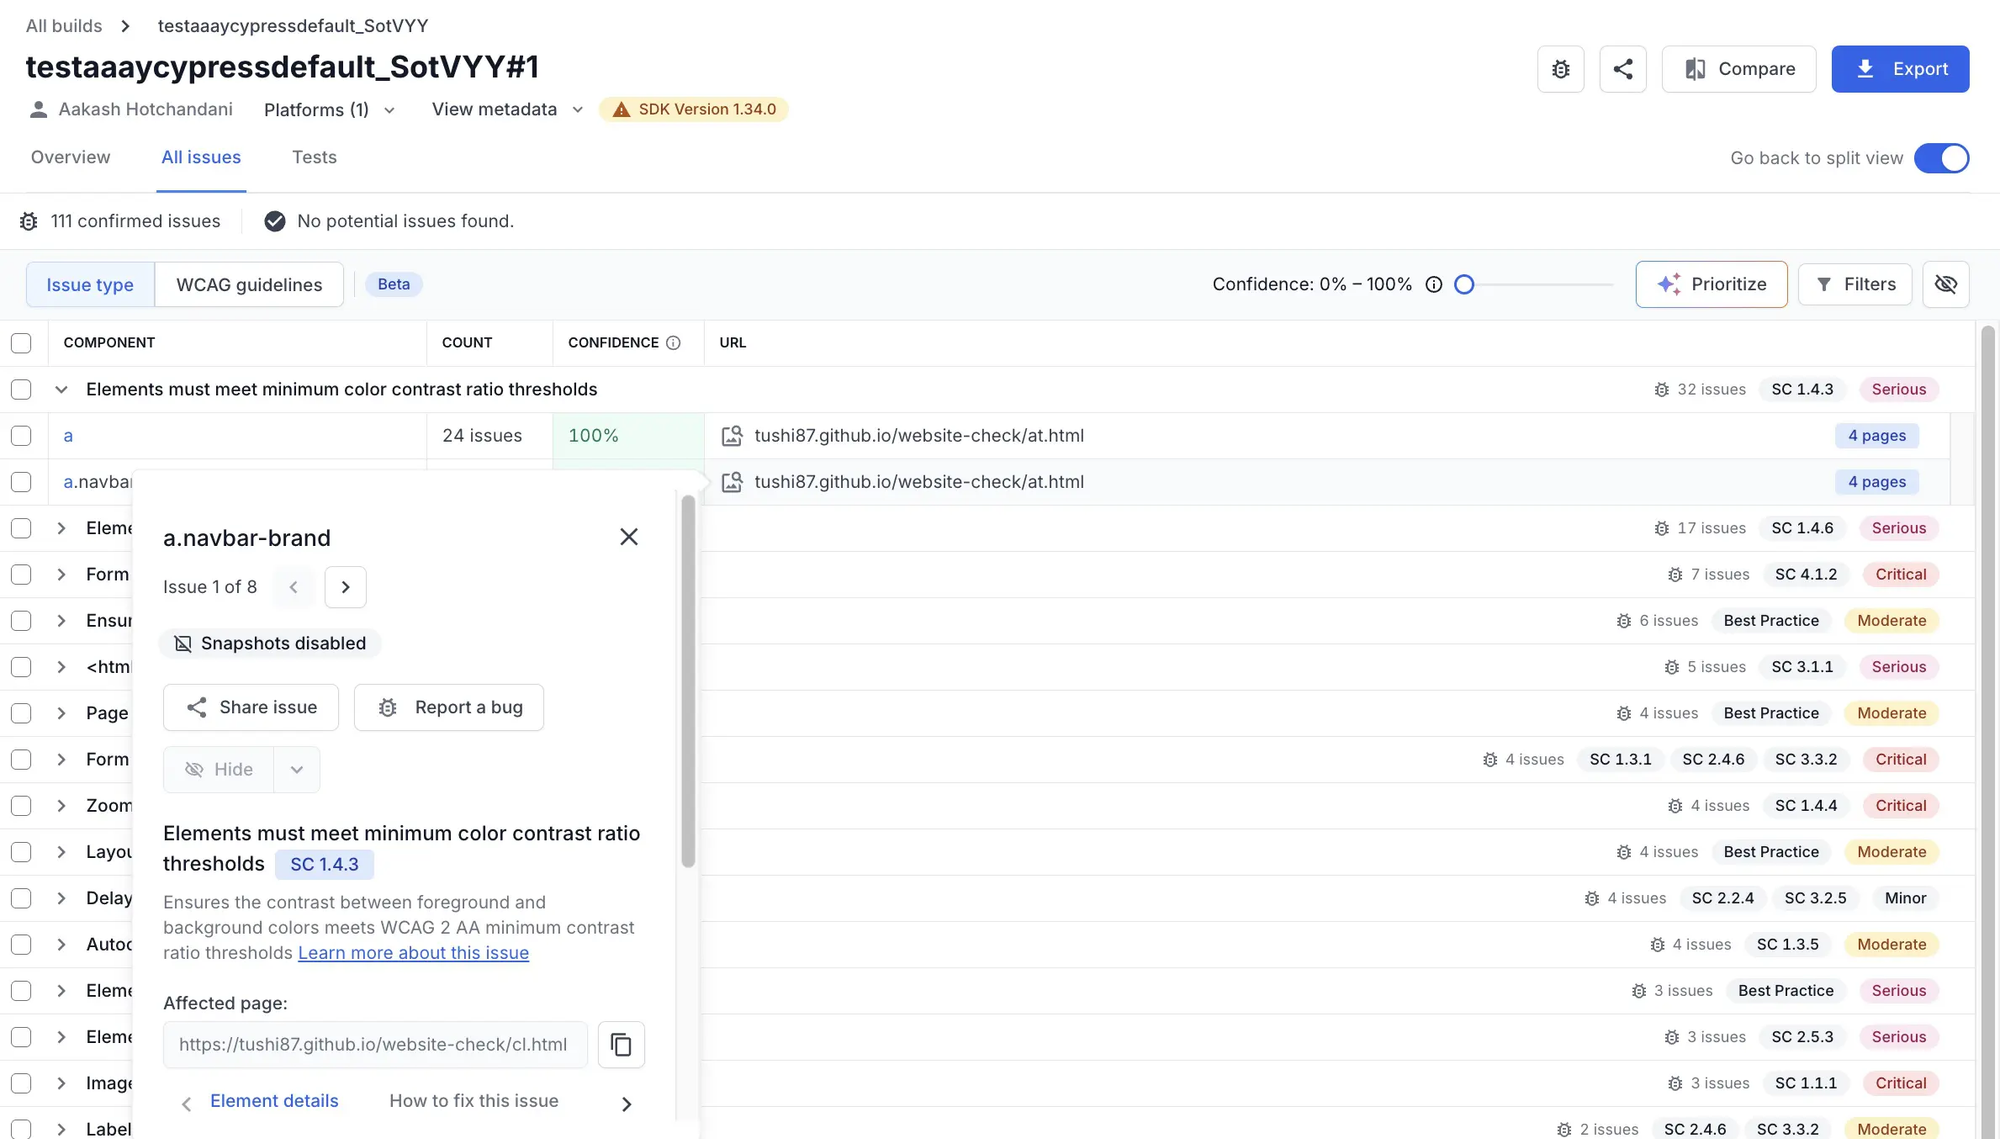
During sprint planning and bug triaging, speed is everything. You shouldn't have to open multiple drawer panels to understand an issue.
Now, context such as WCAG success criteria, rule metadata, severity levels, confidence scores, and issue screenshots are displayed directly in the table row. This at-a-glance visibility accelerates your decision-making, helping you seamlessly determine whether an issue needs to be investigated or immediately fixed.
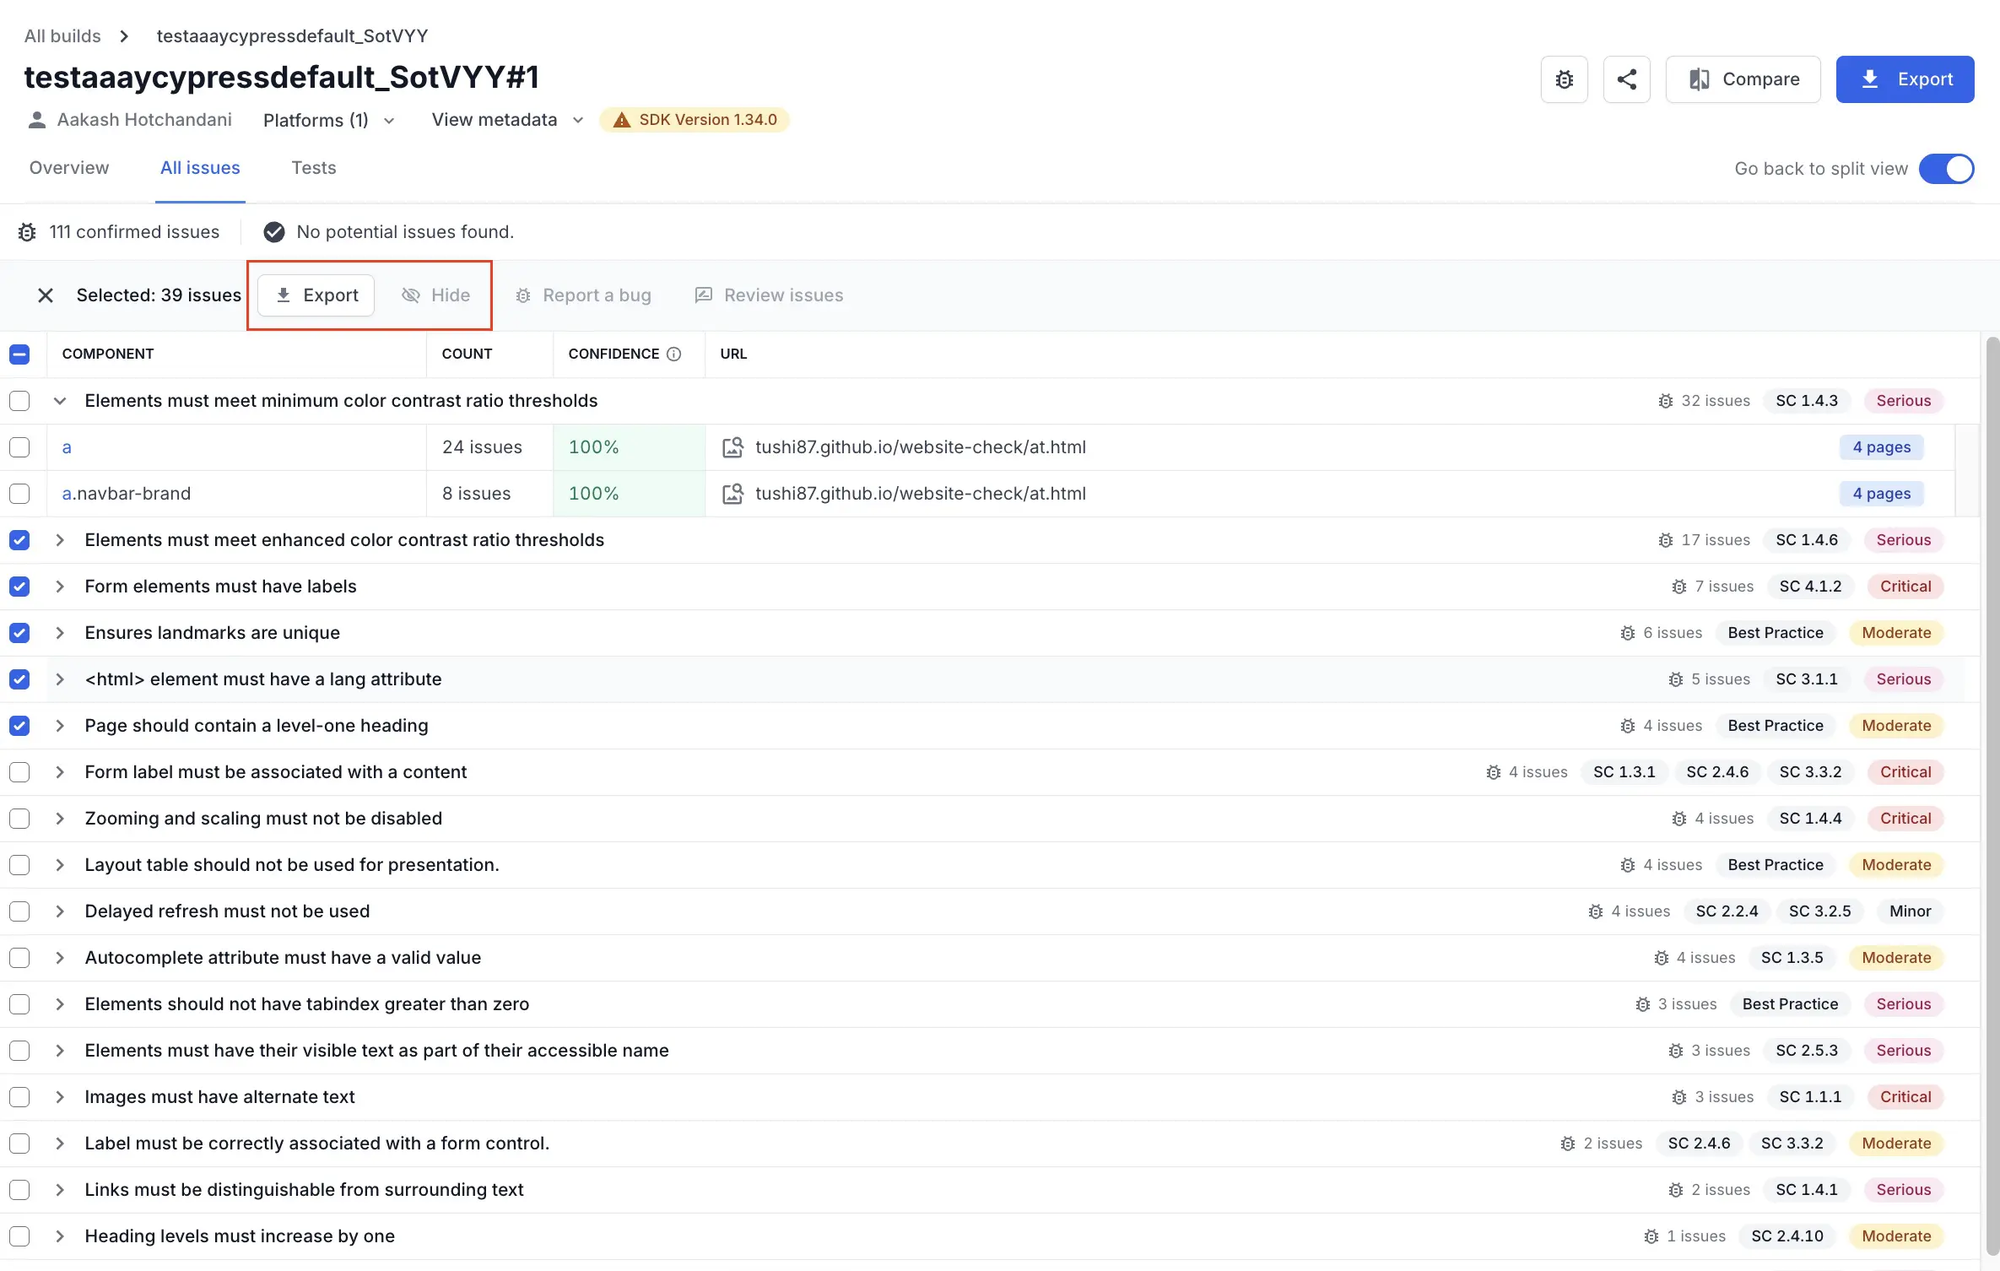
4. Granular multi-select actions
We’ve added granular multi-select actions at both the component and individual issue level. Whether you need to hide a batch of low-priority findings or export a targeted list for your engineering team, these actions are designed to save time, enhance focus, and improve searchability. Plus, we’re actively working on adding "Report a bug" and "Review issues" capabilities to this menu very soon.
Stop managing issues, start fixing them
The Table View isn’t just a UI refresh. It’s a completely new way to handle accessibility reporting. By consolidating queues, aggregating components, and providing immediate context, we’re helping teams ditch triage fatigue and get back to building accessible web experiences.
Ready to experience the difference? Log in to your dashboard and switch to the new Table View!

