JUnit Test Report
JUnit Test Report with Test Reporting and Analytics
Capture detailed JUnit Test Report with BrowserStack Test Reporting and Analytics for every build run, irrespective of the test environment, and share it on the go with your stakeholders.
Get JUnit Test Report with Test Reporting and Analytics
Keep track of every JUnit Test Automation build run by creating a detailed JUnit Test Report on Observability Dashboard with all historical data. Leverage automatic flaky & failure reason detection with AI. Easily share the report with all stakeholders for better collaboration.
How to get JUnit Test Report with Test Reporting and Analytics
BrowserStack Test Reporting and Analytics is a centralized dashboard that checks Test Suite Health and offers a centralized Test Automation Dashboard.
It integrates seamlessly with different Test Automation Frameworks like JUnit and fetches report for every build run with detailed insights and custom view.
You can get JUnit5 Test Reports for your,
- Tests running on BrowserStack without SDK
- Tests Running on BrowserStack with SDK
- Tests running Locally or Elsewhere by easy integration
You can also upload existing JUnit XML reports to BrowserStack Test Reporting and Analytics to get detailed insights and visualizations on the central dashboard.
You can create, manage, download, and share dashboards with Test Reporting and Analytics.
Features
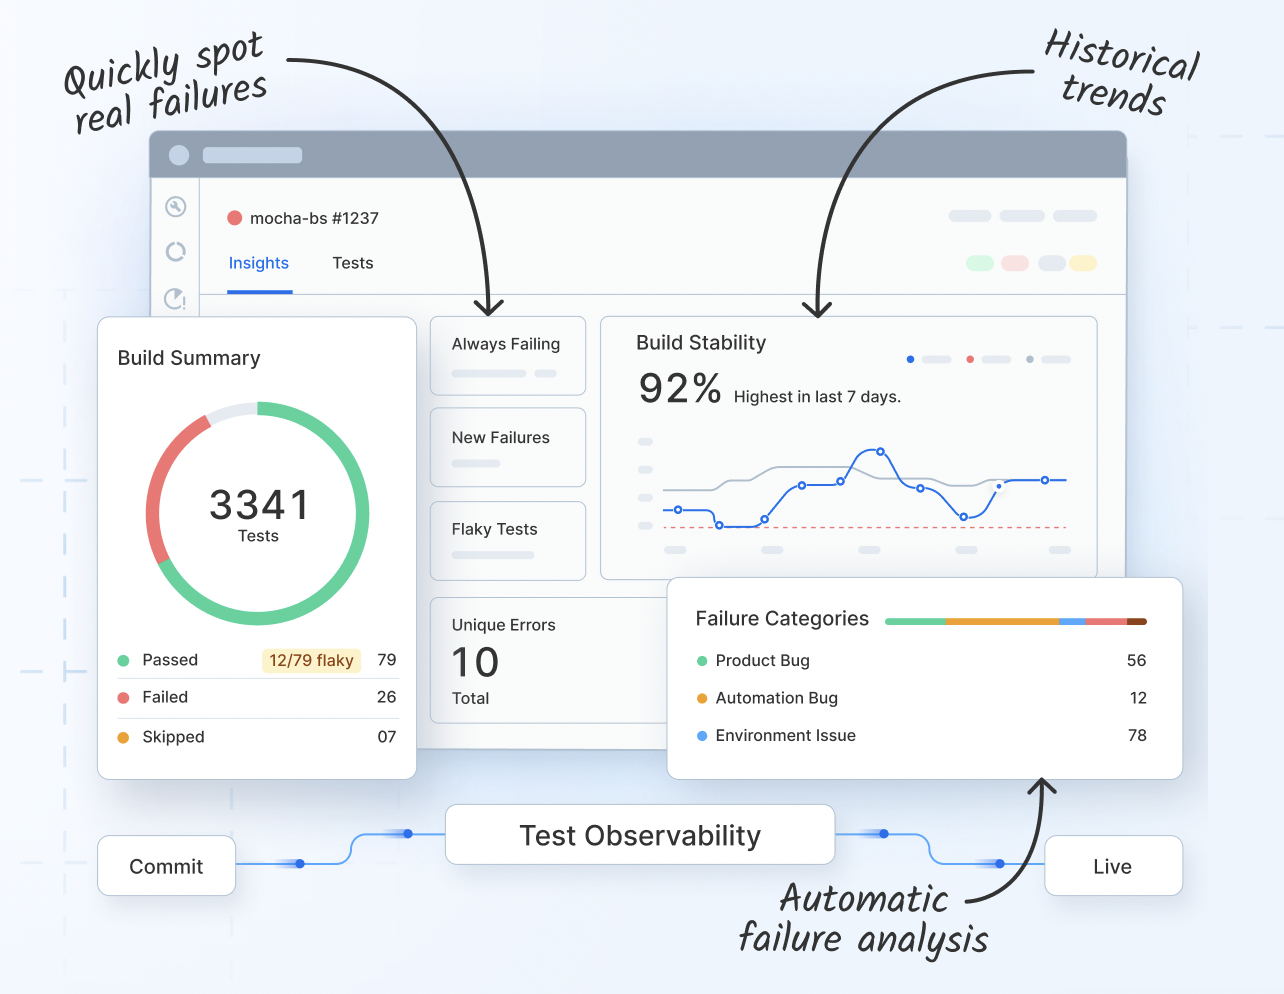
Get Detailed Test Build InsightsYou can access comprehensive test build insights like performance, flakiness, new failures, always failing, build stability, run summary, and more. | ||
Track Failure Rate of Test BuildsKnow the performance of each test build and track the failure rate of tests, flakiness, and average failure rate to keep an eye on the health of test suite. | ||
Better Team CollaborationDownload & share report PDFs of build insights, unique errors, test health, testing trends, and more with stakeholders. | ||
Complete End-to-End VisibilityInteractive testing trends charts that provide a 360-degree end-to-end visibility into automation metrics for all teams, projects, and modules. | ||
Enhanced Debugging with Rich ArtifactsEffectively identify and debug any issues in your test build with detailed analytics and rich artifacts on the central test automation dashboard. | ||
Get Historical Data and TrendsIdentify trends with comprehensive historical data for all re-runs and merged runs of test builds for a better understanding of reoccurring issues. | ||
Get JUnit Test Report using BrowserStack Test Reporting and Analytics
Frequently Asked Questions
Yes! You can seamlessly integrate BrowserStack Test Reporting and Analytics with JUnit to get detailed reports in a centralized Test Automation Dashboard. You can get JUnit Test Reports for your Tests running on BrowserStack without SDK , Tests Running on BrowserStack with SDK , and Tests running Locally or Elsewhere by easy integration by easy integration.
Yes! You can easily upload JUnit XML reports on BrowserStack Test Reporting and Analytics to access all the historic build runs on a central dashboard with detailed insights.
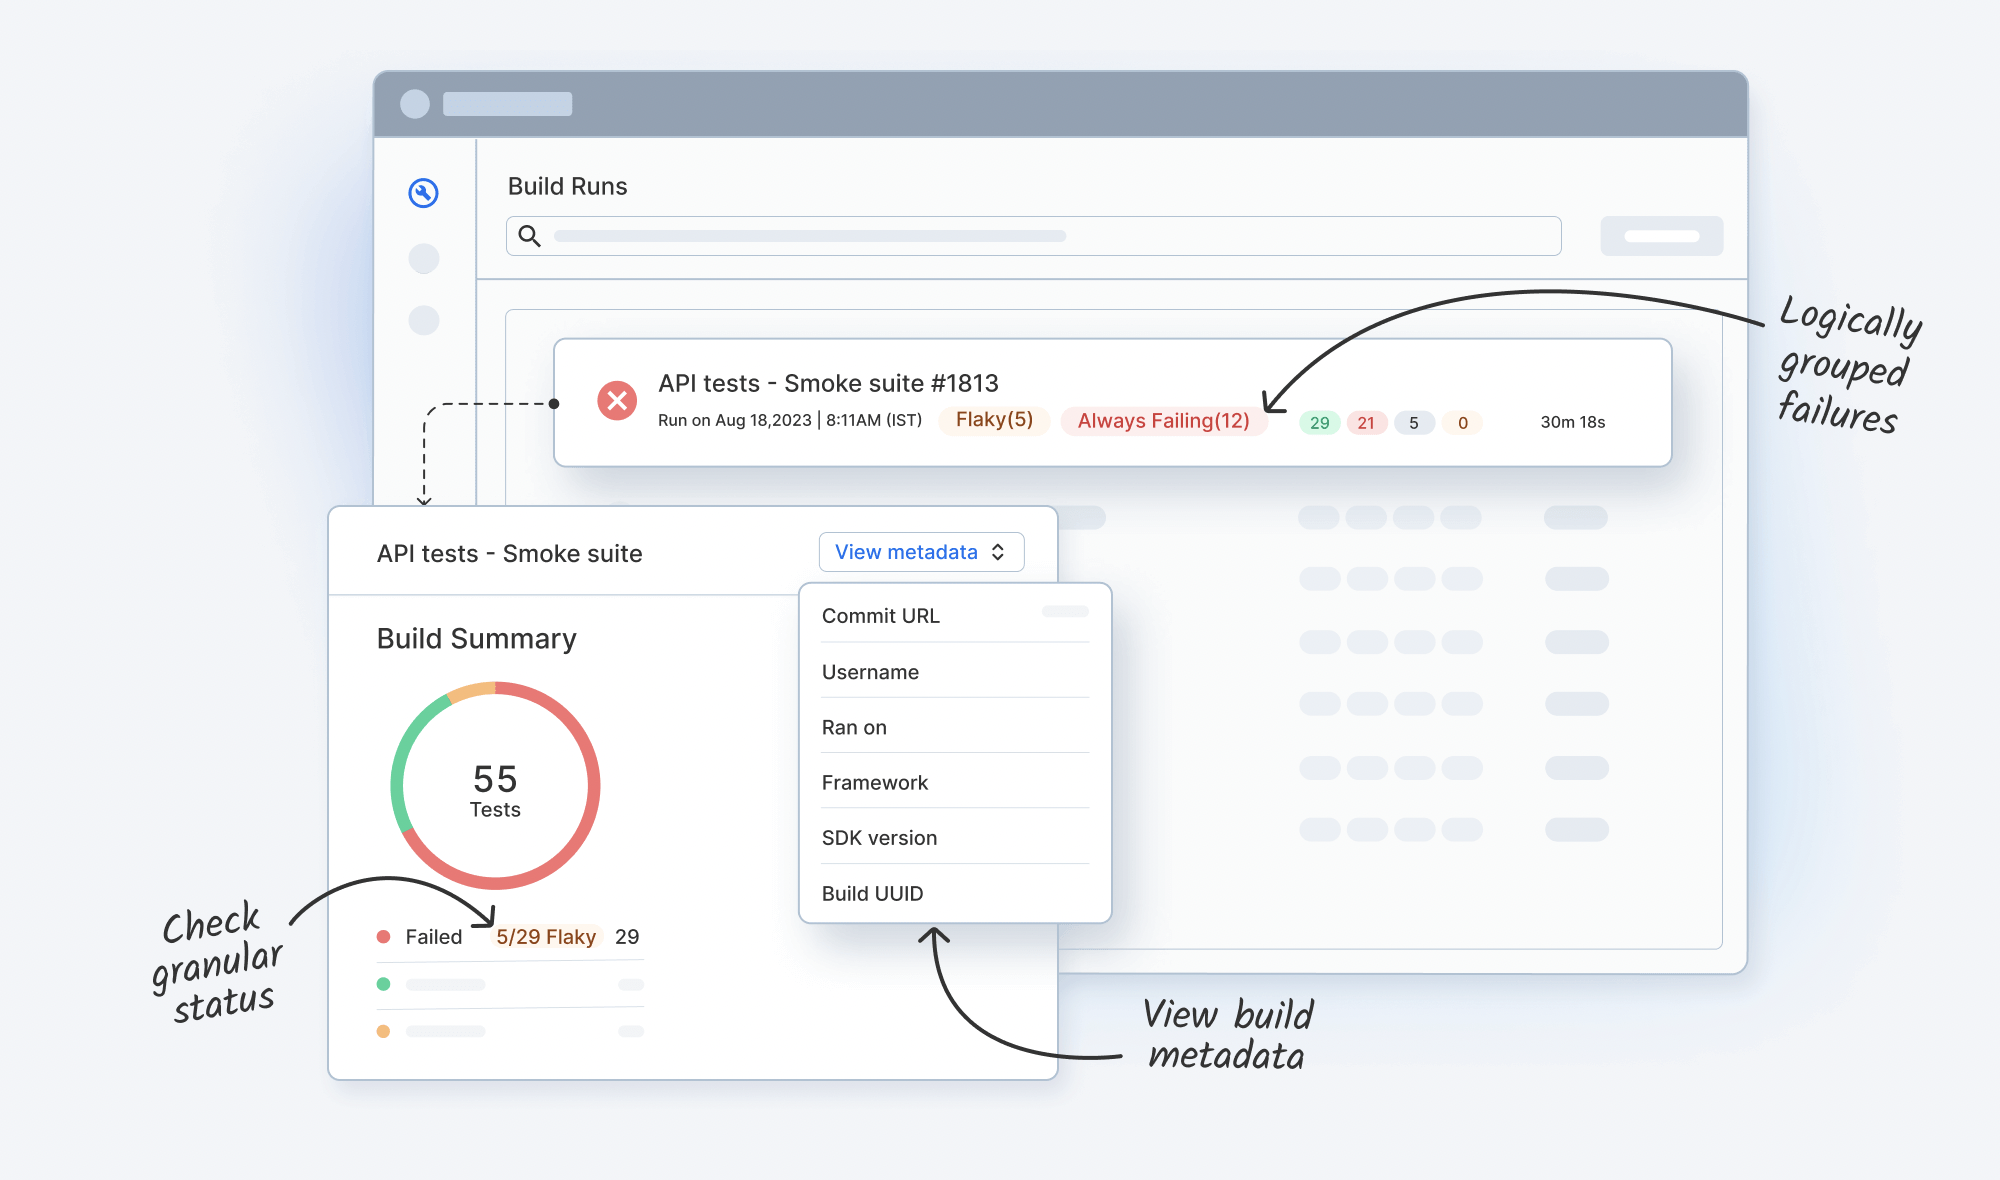
Yes, all the meta-data and insights of all the build-runs from different triggers can be viewed in JUnit Test Report with BrowserStack Test Reporting and Analytics.
BrowserStack Test Reporting and Analytics allows you to Download & Share report PDFs of detailed JUnit Test Report containing build insights, unique errors, test health, testing trends, and more with stakeholders.
You can easily get all the historical test result data at a centralized test automation dashboard using BrowserStack Test Reporting and Analytics, even for local test runs. Also, it allows you to download and share the JUnit Test Report with fellow stakeholders and team.
To view JUnit reports using BrowserStack Test Reporting and Analytics, simply upload your JUnit XML reports to the tool. It will then provide you with comprehensive insights and visualizations.
Need detailed Test Reports for your JUnit Test Suite?

Contact sales
Help us with your details & our sales team will get back with regarding our new team wide plans.
Get in touch with us
Please share some details regarding your query
Thank you
Fetching available slots...
You can book a time to talk with us.
Request received!
We will respond back shortly to
In the meantime, here are some resources that might interest you:
Meanwhile, these links might interest you:

