Get screenshots of Appium tests
Automatically capture screenshots for Appium commands executed in your test session on BrowserStack App Automate. Find the exact step and page when test failure occurred.
If you are using the older dashboard, refer to the old dashboard documentation.
Visual Logs enable you to automatically capture screenshots for various Appium commands executed in your test session. Using visual logs you can:
- Detect the exact step where the failure occurred.
- Identify any layout or design related issues in your application.
Visual logs are available on the BrowserStack dashboard for 30 days. These logs are deleted after 30 days from the day they are generated.
Visual logs are disabled by default. To enable visual logs, use the capability as shown below.
If you are using BrowserStack SDK, you can set the following capability within the browserstack.yml file:
| Capability | Description | Value |
|---|---|---|
debug |
Generate screenshots for various appium commands in your test |
true, false Default: false
|
BrowserStack SDK is a plug-n-play solution that takes care of all the integration steps for you. Using the BrowserStack SDK is the recommended integration method for your project. To know more, visit the SDK core concepts page.
Use the following code snippet to set the Visual logs capability to true:
| Capability | Description | Value |
|---|---|---|
debug |
Generate screenshots for various appium commands in your test |
true, false Default: false
|
Example :
DesiredCapabilities capabilities = new DesiredCapabilities();
HashMap<String, Object> browserstackOptions = new HashMap<String, Object>();
browserstackOptions.put("debug", "true");
var capabilities = {
	'bstack:options' : {
		"debug" : "true",
	}.
}
AppiumOptions capabilities = new AppiumOptions();
Dictionary<string, object> browserstackOptions = new Dictionary<string, object>();
browserstackOptions.Add("debug", "true");
$caps = array(
    'bstack:options' => array(
        "debug" => "true",
    ),
)
desired_cap = {
	'bstack:options' : {
		"debug" : "true",
	},
}
capabilities = {
    'bstack:options' => {
        "debug" => "true",
    },
}
| Capability | Description | Value |
|---|---|---|
browserstack.debug |
Generate screenshots for various appium commands in your test |
true, false Default: false
|
Example :
DesiredCapabilities capabilities = new DesiredCapabilities();
capabilities.setCapability("browserstack.debug", "true");
var capabilities = {
"browserstack.debug" : "true",
}
AppiumOptions capabilities = new AppiumOptions();
capabilities.AddAdditionalCapability("browserstack.debug", "true");
$caps = array(
"browserstack.debug" => "true"
)
desired_cap = {
"browserstack.debug" : "true"
}
caps = Selenium::WebDriver::Remote::Capabilities.new
caps["browserstack.debug"] = "true"
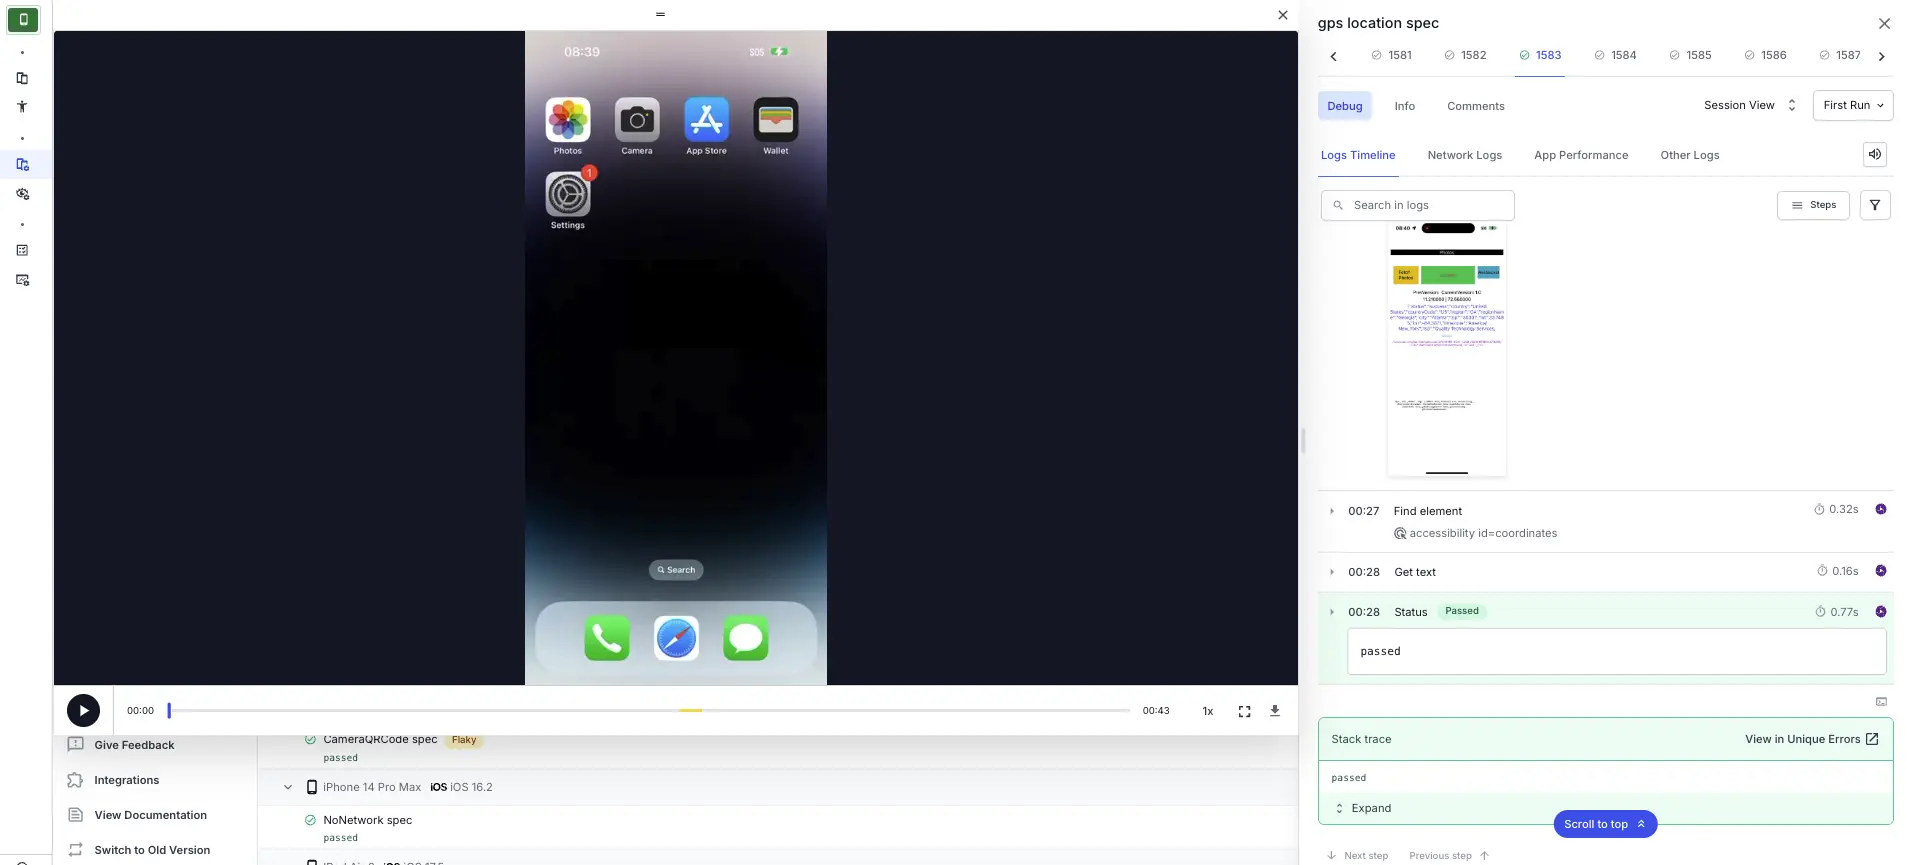
Access visual logs from the dashboard:
The visual logs can be accessed from the test sessions details page on the App Automate Dashboard.
We're sorry to hear that. Please share your feedback so we can do better
Contact our Support team for immediate help while we work on improving our docs.
We're continuously improving our docs. We'd love to know what you liked
We're sorry to hear that. Please share your feedback so we can do better
Contact our Support team for immediate help while we work on improving our docs.
We're continuously improving our docs. We'd love to know what you liked
Thank you for your valuable feedback!