Component Summay widget in custom dashboards
Track the health of all your test suite components in a consolidated grid-like view.
This widget helps you see how different sections or components of your test suite are performing against important QA metrics. You can view a component-wise breakdown of any two of the following metrics using this widget:
- Flakiness
- Stability
- Unique Tests
- Test Runs
- Failure Rate
- New Failure Rate
- Always Failing Rate
You can use test attributes like Folder, OS, Device, and Browser to identify the components or sections of your test suite. Alternatively, you can use segments to define various components of your test suite.
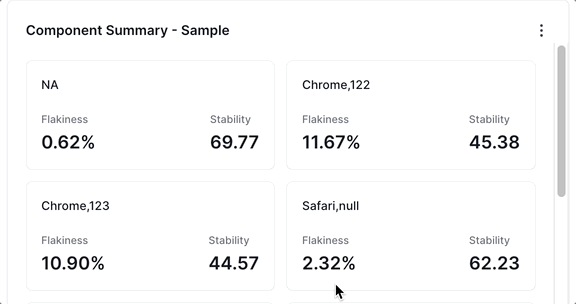
For example, the sample widget above illustrates a browser-wise view of the Failure Rate and Stability of the test runs. The insights chosen in this case are Failure Rate and Stability and the test attribute used here to define components is Browser.
Drill down for more information
You can investigate more contextual information on all dashboard widgets using the drill-down feature.
You can use the drill-down feature in the Component Summary widget to analyze more information on the insights. For example, if you want to investigate why a particular indicater, like flakiness, is high, you can click it and discover more details.
Follow these steps to use the drill-down feature:
- Click any insight on the Component Summary widget. A project-wise breakdown of the metrics related to the insight for the selected date range opens up in a side pane.
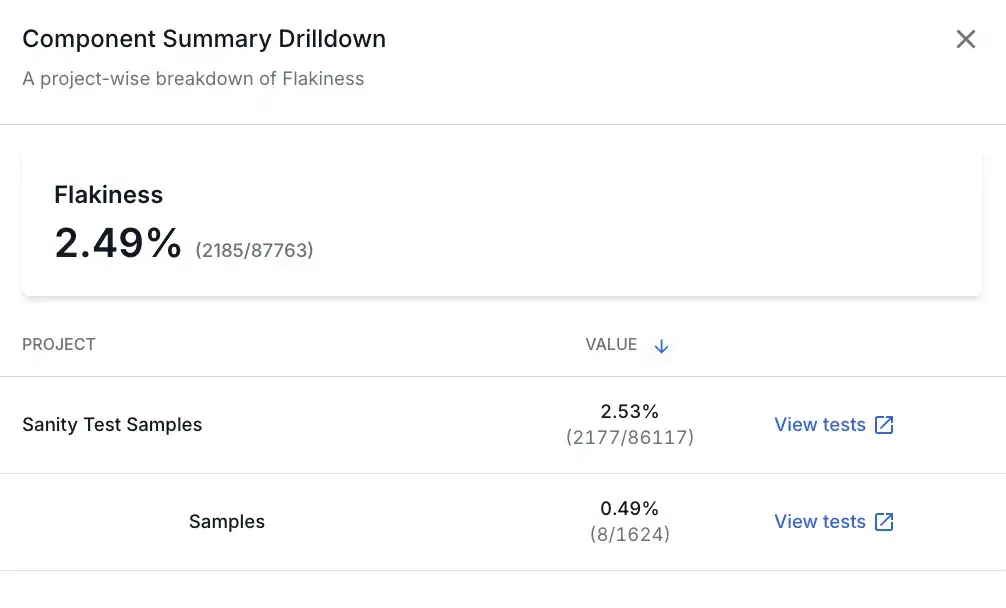
- If the option is present, click View tests to get to the tests that contribute to the insight.
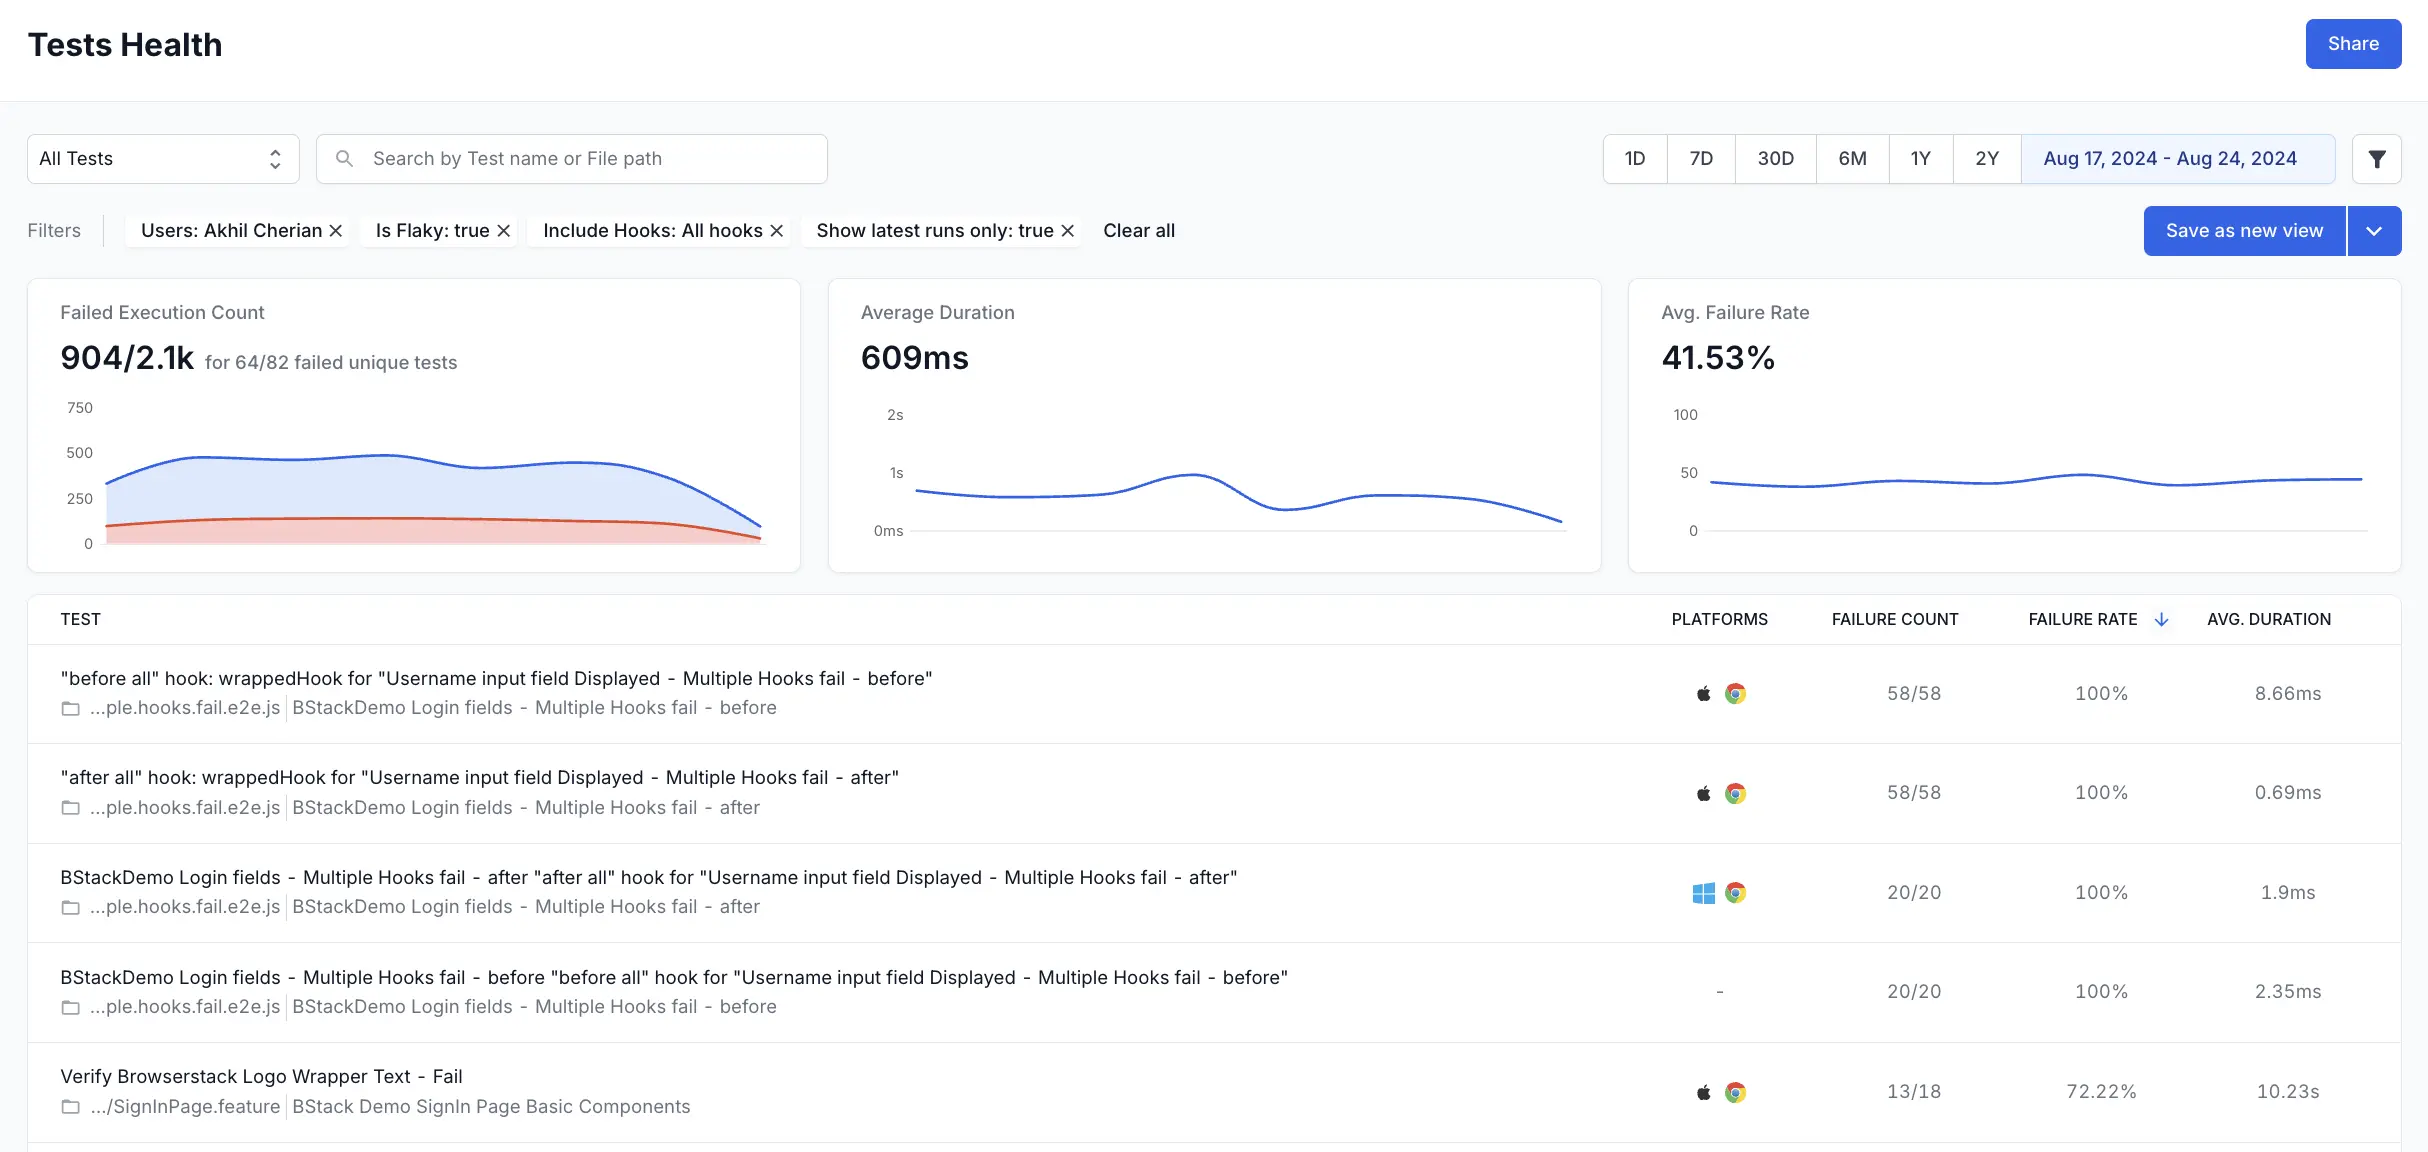
This opens Tests Health in a new tab with the applicable filters. On Tests Health, you can view the individual tests that contributed to the insight to investigate further.
Widget configuration - Component Summay
You can configure the following options in the Component Summay widget:
-
Widget name: A suitable name to easily identify the purpose of the widget.
-
Description: An optional widget description to explain the purpose in detail. A user can view this description by hovering over an info icon on the widget and gain valuable context about the widget.
-
Insights: A drop-down from which you can select a metric to track, among
Flakiness,Stability,Unique Tests,Test Runs,Failure Rate,New Failure Rate, andAlways Failing Rate. You can choose two insights in a widget.
-
Test Attributes: Test Attributes are one way of defining the components in your component summary widget. You can use test attributes like
Folder,OS,Device, andBrowserto define your components. You will see separate tiles for all the unique values of your chosen attribute. -
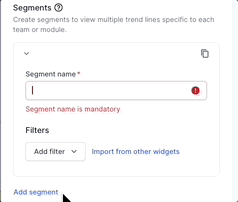
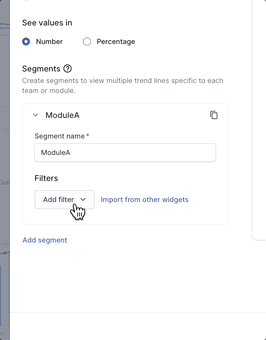
Segments: Segments are another way of defining the components in your component summary widget. You can add segments in the component summary widget using the Add segment option. These segments appear as separate tiles in the widget. Segments should be used along with filters. You can use various filters in each segment to compare different projects, builds, users, etc.
-
Filter: You can add a filter to include only the data you want in a particular segment. The parameters by which you can filter data are Projects, Unique Build Names, Users, Build Tags, Test Tags, Hooks Visibility, Host Names, Folder names, Device, OS, and Browser.
You can also import filters from other widgets to avoid duplicate efforts.
Sample use cases
You can use the Component Summary widget to track and compare insights of different segments or sections in your test suites. Here are a few sample use cases to get you started:
View the Always Failing Rate and New Failure Rate across different modules or teams in a single view
You can configure separate segments for different modules or teams in your test suites. You can use segments in combination with the following filters to identify modules and teams:
- Unique build names filter to identify build names that belong to a particular module or team.
- Users filter to differentiate between team members who triggered the build.
- Folder names filter to identify modules based on folders in your test repository.
- Build tags and Test Tags that represent team or module information.
Consider the following example in which the Always Failing Rate and New Failure rate in three modules are tracked.
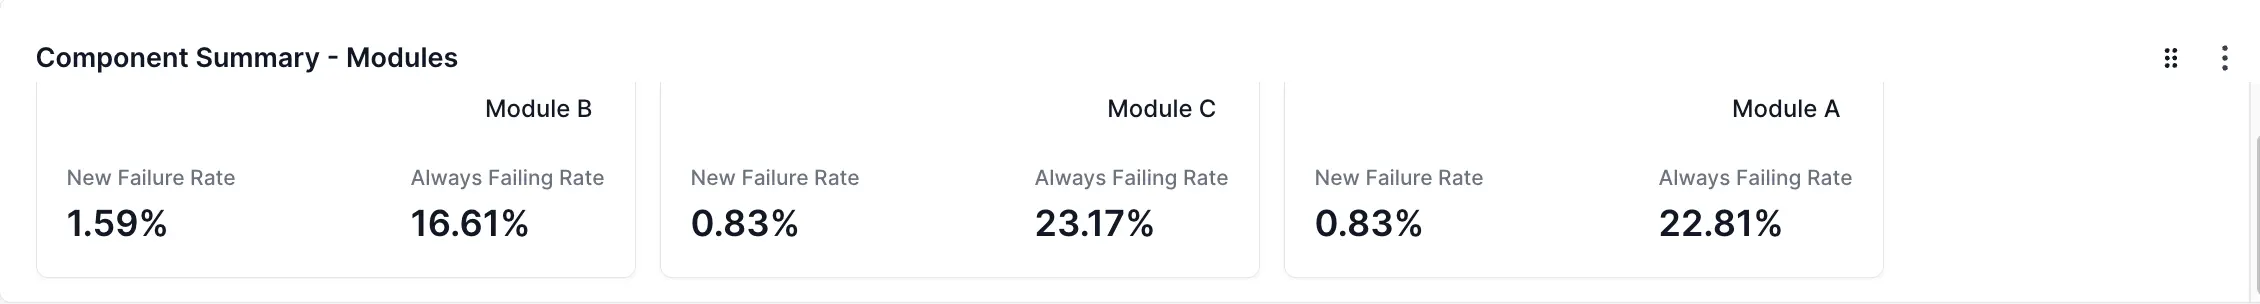
To create the above widget, in the following sample configuration, different Folder names filters are configured on each of the three segments that define Module A, Module B, and Module C.
Compare Flakiness and Stability across multiple operating systems
To track Flakiness and Stability of tests that run on multiple operating systems, you can configure Insights 1 as Flakiness, Insights 2 as Stability, and use Test Attribute as ‘OS’. The Component Summary widget will automatically create separate tiles for each of the operating systems used in your test suite.
In the following example, tests run on multiple operating systems are compared.
We're sorry to hear that. Please share your feedback so we can do better
Contact our Support team for immediate help while we work on improving our docs.
We're continuously improving our docs. We'd love to know what you liked
We're sorry to hear that. Please share your feedback so we can do better
Contact our Support team for immediate help while we work on improving our docs.
We're continuously improving our docs. We'd love to know what you liked
Thank you for your valuable feedback!